Inclusive growth? Varying trends in disposable household income over the last decade
The economic crisis has put income inequality high on the political agenda. Thomas Piketty's "Capital in the 21st century" made the topic also a subject of coffee breaks, while Wilkinson and Pickett's "The Spirit Level" illustrated how inequality is associated with various social ills in our societies.
Citizens are worried as well: according to a Eurobarometer survey more than three quarters of the Europeans consider income inequalities too big in their country.
In our "Employment and Social Developments in Europe 2013", we argued that GDP should be complemented with other indicators to take into account equity considerations and social well-being. This approach seems fundamental in that economic progress cannot be sustainable or enjoy democratic support if its fruits are reaped only by a privileged few.
The idea of inclusive growth in the Europe 2020 strategy acknowledges that the benefits of growth need to be widely and fairly distributed across the society.
In 2008, the OECD reported on the rising inequalities that affected the majority of democratic capitalist societies. Now there is a growing concern that the economic crisis might have made the things worse.
Income developments surprisingly varied
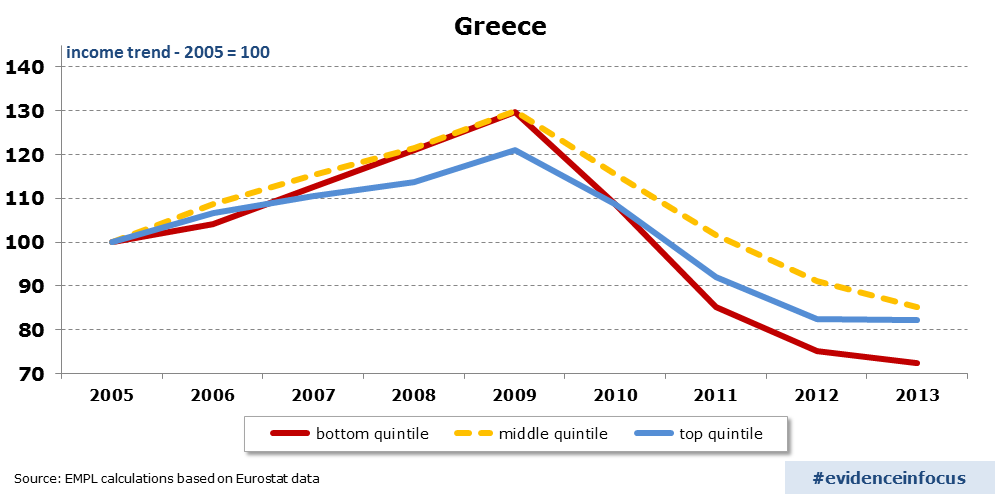
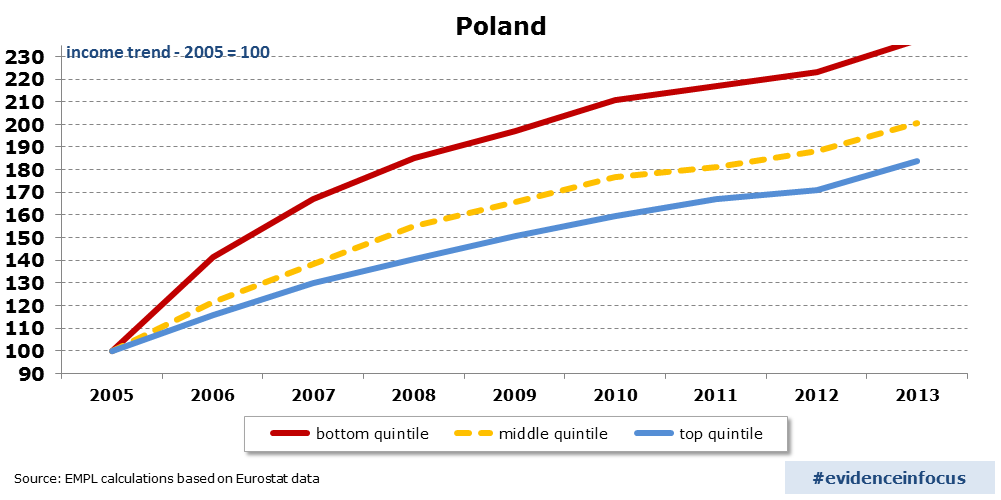
In the charts below we want to illustrate the income developments for the poorest, middle and richest quintile in 18 EU countries to see whether the past years of economic turmoil have affected people across the income ladder the same way.
The charts for these 18 countries are surprisingly varied, particularly in the way the recession shows in the evolution of household incomes (click to enlarge).


A strong decrease in some countries...
As one would expect, we see a strong decrease in disposable income in countries worst hit by the crisis (Ireland, Portugal, Spain and Greece). However, the impact of the crisis was felt very differently across the income distribution.
In Ireland and Portugal, the poorest 20 per cent of the population were less affected than the richest 20 per cent of the population. In addition, there seems to be a positive income development again as of 2011 in Ireland, while in Portugal income continued to decline for the poorest people.
In contrast, in Greece, the poor suffered more than the rest of the population. In the last year for which data are available, the decline slowed down, but there was still no sign of a recovery. In Spain, the poor have also suffered relatively more in the crisis than the better-off, although the impact has been less harsh than in Greece.
... and steady growth in others
In many countries the picture is one of steady growth of personal incomes – and often all three income groups appear to be benefiting in equal measure. For example in Belgium, the bottom, the middle and the top income quintile have experienced similar income developments since 2005.
A very different story can be told of Germany where the rich have enjoyed a quite steady increase in income, while the poorest have seen their income stagnate since the crisis and even decrease in the last year for which we have data.
Poland, by contrast, displays a remarkably positive income development which resulted in the incomes of the poorest 20% of the population more than double within a decade. Poland is one of the few countries in the EU where income inequality has significantly decreased in the last decade.
How do we explain this?
To understand these different stories across countries, one needs to look at a wide range of determinants, including:
- the effectiveness of the welfare state to protect the most vulnerable groups of the society,
- the functioning of the labour market,
- trends in employment and unemployment, and
- reforms in the tax-benefit system.
We will be writing on these topics in this blog, so future Evidence in Focus posts may provide at least some explanations for these differences across EU countries.
For an in-depth reflection on indicators of inclusive growth see the 2013 European and Social Developments in Europe, chapter 7 ‘Indicators of inclusive growth to complement GDP growth’.
Authors: B. Lessaer worked in the unit of Social Analysis and M. Vaalavuo works in the unit of Thematic Analysis of DG EMPL.
The views expressed in this article are those of the authors and do not necessarily reflect the views of the European Commission.
Editor's note: this article is part of a regular series called "Evidence in focus", which puts the spotlight on key findings from past and on-going research at DG EMPL.