Copernicus Emergency Management Service (CEMS) - The Mapping Activation Viewer

date: 22/06/2021
See also: Mapping Activation Viewer
The Copernicus Emergency Management Service (CEMS) Mapping is the on-demand component that provides information before or after a disaster. Two elements, Rapid Mapping (RM) and Risk & Recovery Mapping (RRM) are designed to cover the entire lifecycle of extreme events, from prevention to response and recovery.
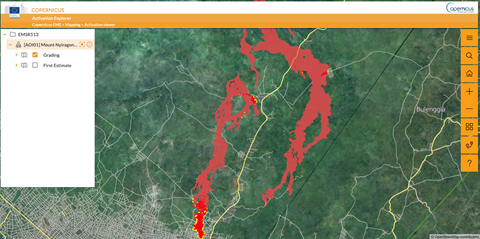
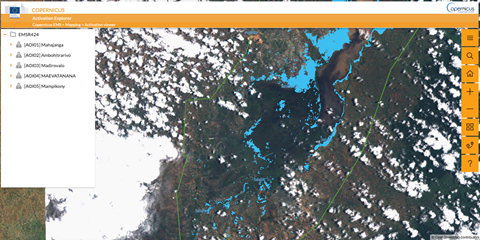
The service recently launched a new website that improves the way the data is shared through the use of interactive maps where users can quickly visualise the outcomes of the analysis before or in alternative to the download of the ready-to-print maps and vectors.
The data produced by RM and RRM, once released, don’t change anymore. In particular for the RM, which is active 24/7, when necessary the data is corrected through the release of new versions, while for RRM the data is released only when approved by the Mapping team. This is an important aspect that influenced the way the Activation Viewer has been designed.
Typically the web mapping tools are composed by many elements like:
- A database where the spatial data is stored
- A mapping engine which translates the data into human or computer readable formats
- A web server that responds to the requests from the client
- A catalog that provides search and discovery capabilities
This structure is necessary when the data change often therefore a database is required to allow editing and to keep consistency, but given the Mapping case where the data never change, it was decided to explore the possibility to remove the above-mentioned elements and to store the data in a static, well organized structure that could be hosted in the cloud.
Additionally it was decided to explore the use of innovative technologies for data visualization such as the Vector Tiles and the Cloud Optimized GeoTIFF (COG). The first one means that the data is transmitted in vector format to the internet browser when looking at the website and it will be the client’s computer to apply a style and render it on the map using the GPU of the pc. The second one is used to display satellite imagery, the COG is in fact a TIFF image that includes overviews and tiles supporting also the streaming of a portion of the image, pretty much like is possible to stream a portion of a video. This way is possible to efficiently display large images on the web without overloads and having fast performances.
All the above-mentioned data is currently stored in an Amazon S3 bucket and organised using a hierarchical architecture following a standard named Spatio Temporal Asset Catalog (STAC). In short STAC foresees that every folder should include a file named catalog.json that contains standardised information about the content of the folder and links to the parent and children so that a normal structure that we are all used to work with is translated into a static API understandable by both humans and computers. Such structure is also highly reliable, scalable and portable as there is no software used to serve it through the web or database to keep its consistency. A small metadata catalogue is acting as an index to provide also searching capabilities.

