
An interactive story map on Vulnerability to Disasters in Europe
date: 06/10/2022
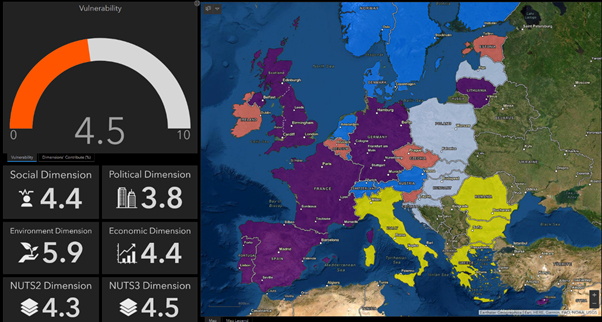
The Risk Data Hub team has been working on offering new ways of visualizing its extensive data catalogue and to derive insights that can drive actions. Following the official launch of the Facts and Figures section, the team recently released an interactive story map on Vulnerability to Disasters in Europe: it presents a cross-scale indicator for measuring hazard-independent vulnerability in Europe.
The indicator is composed of four dimensions (social, economic, political and environmental) and is meant to capture the systemic susceptibility of communities to disasters at different administrative levels (Country, NUTS2 and NUTS3). We derive an indicator with score ranging between 0 and 10 that encloses the four conceptual dimensions as well as the sub-national components.
Our sample covers a time span of 30 years including yearly observations from 2005 to 2035 resorting to observed values as well as projections. We use this data to identify country vulnerability trends over time. An assessment of the overall trend is performed by the detection of common patterns of the vulnerability over time.
A Principal Component Analysis (PCA) is then applied to identify the dimensions that mostly affect the vulnerability within each Member State. This constitutes the first step towards more spotlights on DRM salient issues: the Facts and Figures – Interactive Reports section will host regular releases of such analyses. Stay tuned for further updates!