Tutorials
Log in
Statistics Explained
menu
search
search
Navigation
Main page
Statistical themes
Glossary
Categories
Statistics 4 beginners
Tutorials
Help
Eurostat home
Education corner
Online publications
Regional yearbook
Sustainable development
Full list
Tools
User contributions
Logs
View user groups
Special pages
search
Navigation
Main page
Statistical themes
Glossary
Categories
Statistics 4 beginners
Tutorials
Help
Eurostat home
Education corner
Online publications
Regional yearbook
Sustainable development
Full list
Tools
User contributions
Logs
View user groups
Special pages
Navigation
Main page
Statistical themes
Glossary
Categories
Statistics 4 beginners
Tutorials
Help
Eurostat home
Education corner
Online publications
Regional yearbook
Sustainable development
Full list
Tools
User contributions
Logs
View user groups
Special pages
Uploads by N002hfib
This special page shows all uploaded files.
File list
Items per page:
20
50
100
250
500
Search for media name:
Username:
Include old versions of files
Go
First page
Previous page
Next page
Last page
Date
Name
Thumbnail
Size
Description
Versions
15:10, 17 June 2020
SE HBS 2015 soucefile v16.xlsx
(
file
)
459 KB
1
15:09, 17 June 2020
Mean consumption expenditure by number of active persons, 2015 10.PNG
(
file
)
68 KB
1
15:07, 17 June 2020
Mean consumption expenditure by number of active persons, 2015 10.png
(
file
)
68 KB
1
15:06, 17 June 2020
Mean consumption expenditure by number of active persons, 2015 8.png
(
file
)
68 KB
2
17:50, 17 April 2020
SE HBS 2015 soucefile v15.xlsx
(
file
)
459 KB
1
17:46, 17 April 2020
SE HBS 2015 soucefile v14.xlsx
(
file
)
459 KB
1
19:46, 15 April 2020
SE HBS 2015 soucefile v13.xlsx
(
file
)
459 KB
1
19:44, 15 April 2020
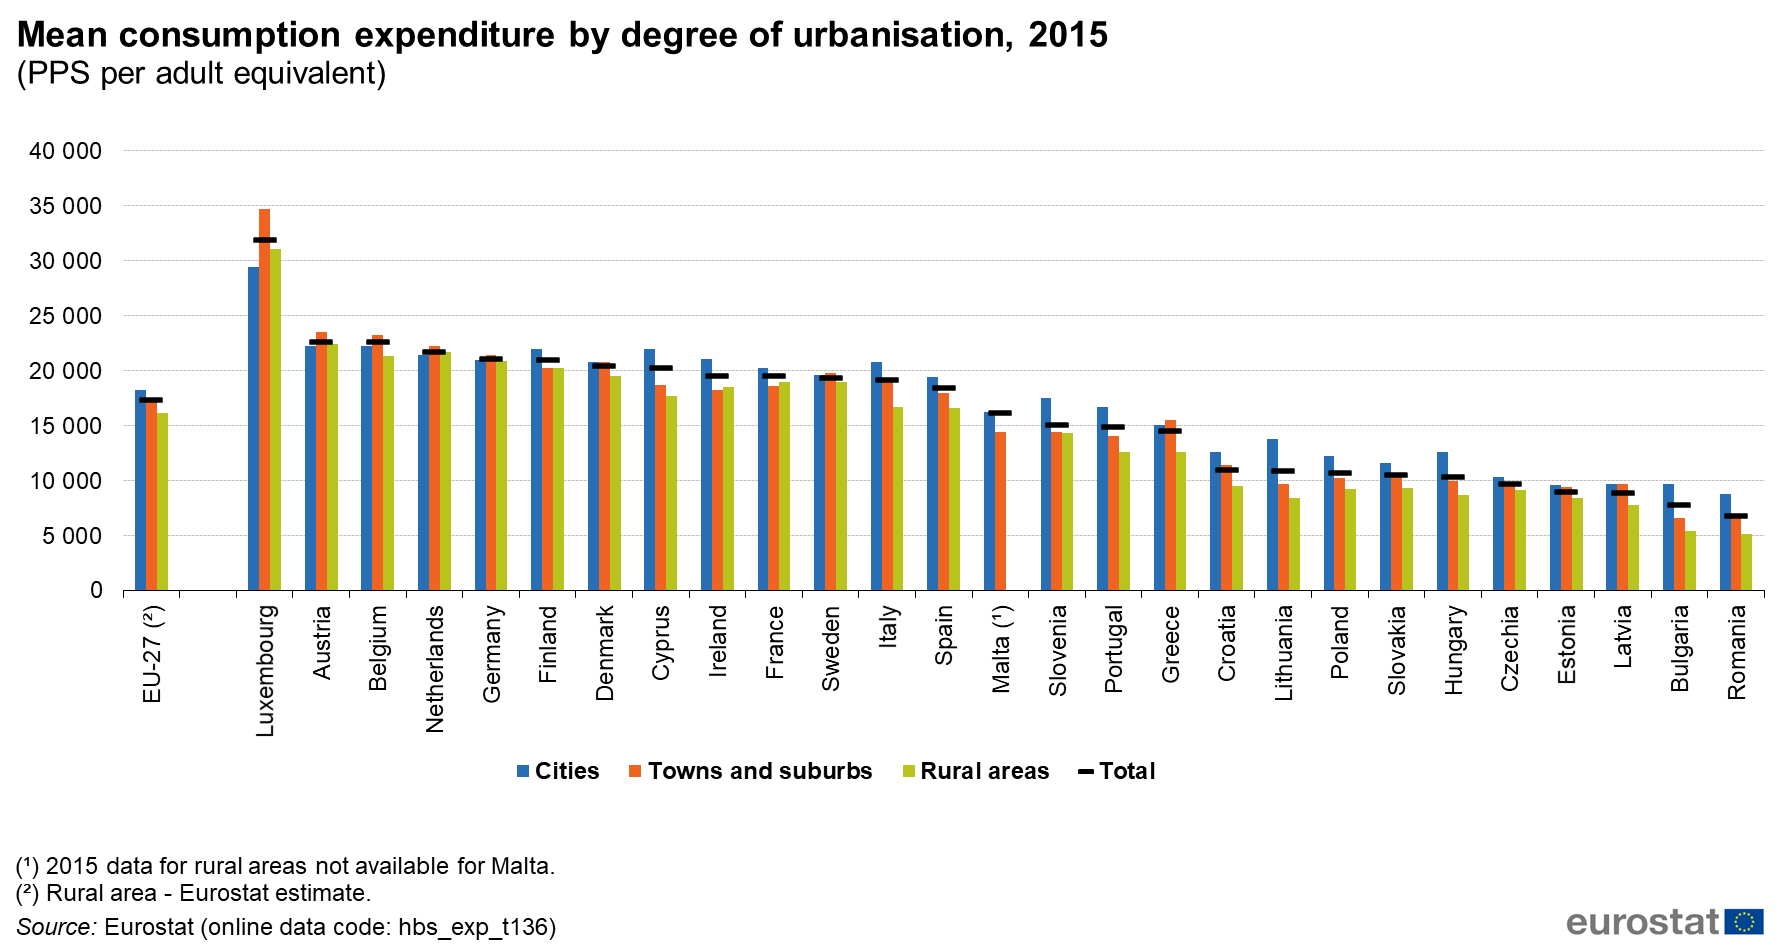
Mean consumption expenditure by degree of urbanisation, 2015 6.PNG
(
file
)
112 KB
1
19:41, 15 April 2020
Mean consumption expenditure for households with three or more adults, 2015 7.PNG
(
file
)
79 KB
1
19:35, 15 April 2020
Mean consumption expenditure for households with two adults, 2015 10.PNG
(
file
)
82 KB
1
19:31, 15 April 2020
Mean consumption expenditure for single person household, 2015 7.PNG
(
file
)
71 KB
1
10:56, 15 April 2020
SE HBS 2015 soucefile v12.xlsx
(
file
)
457 KB
1
10:53, 15 April 2020
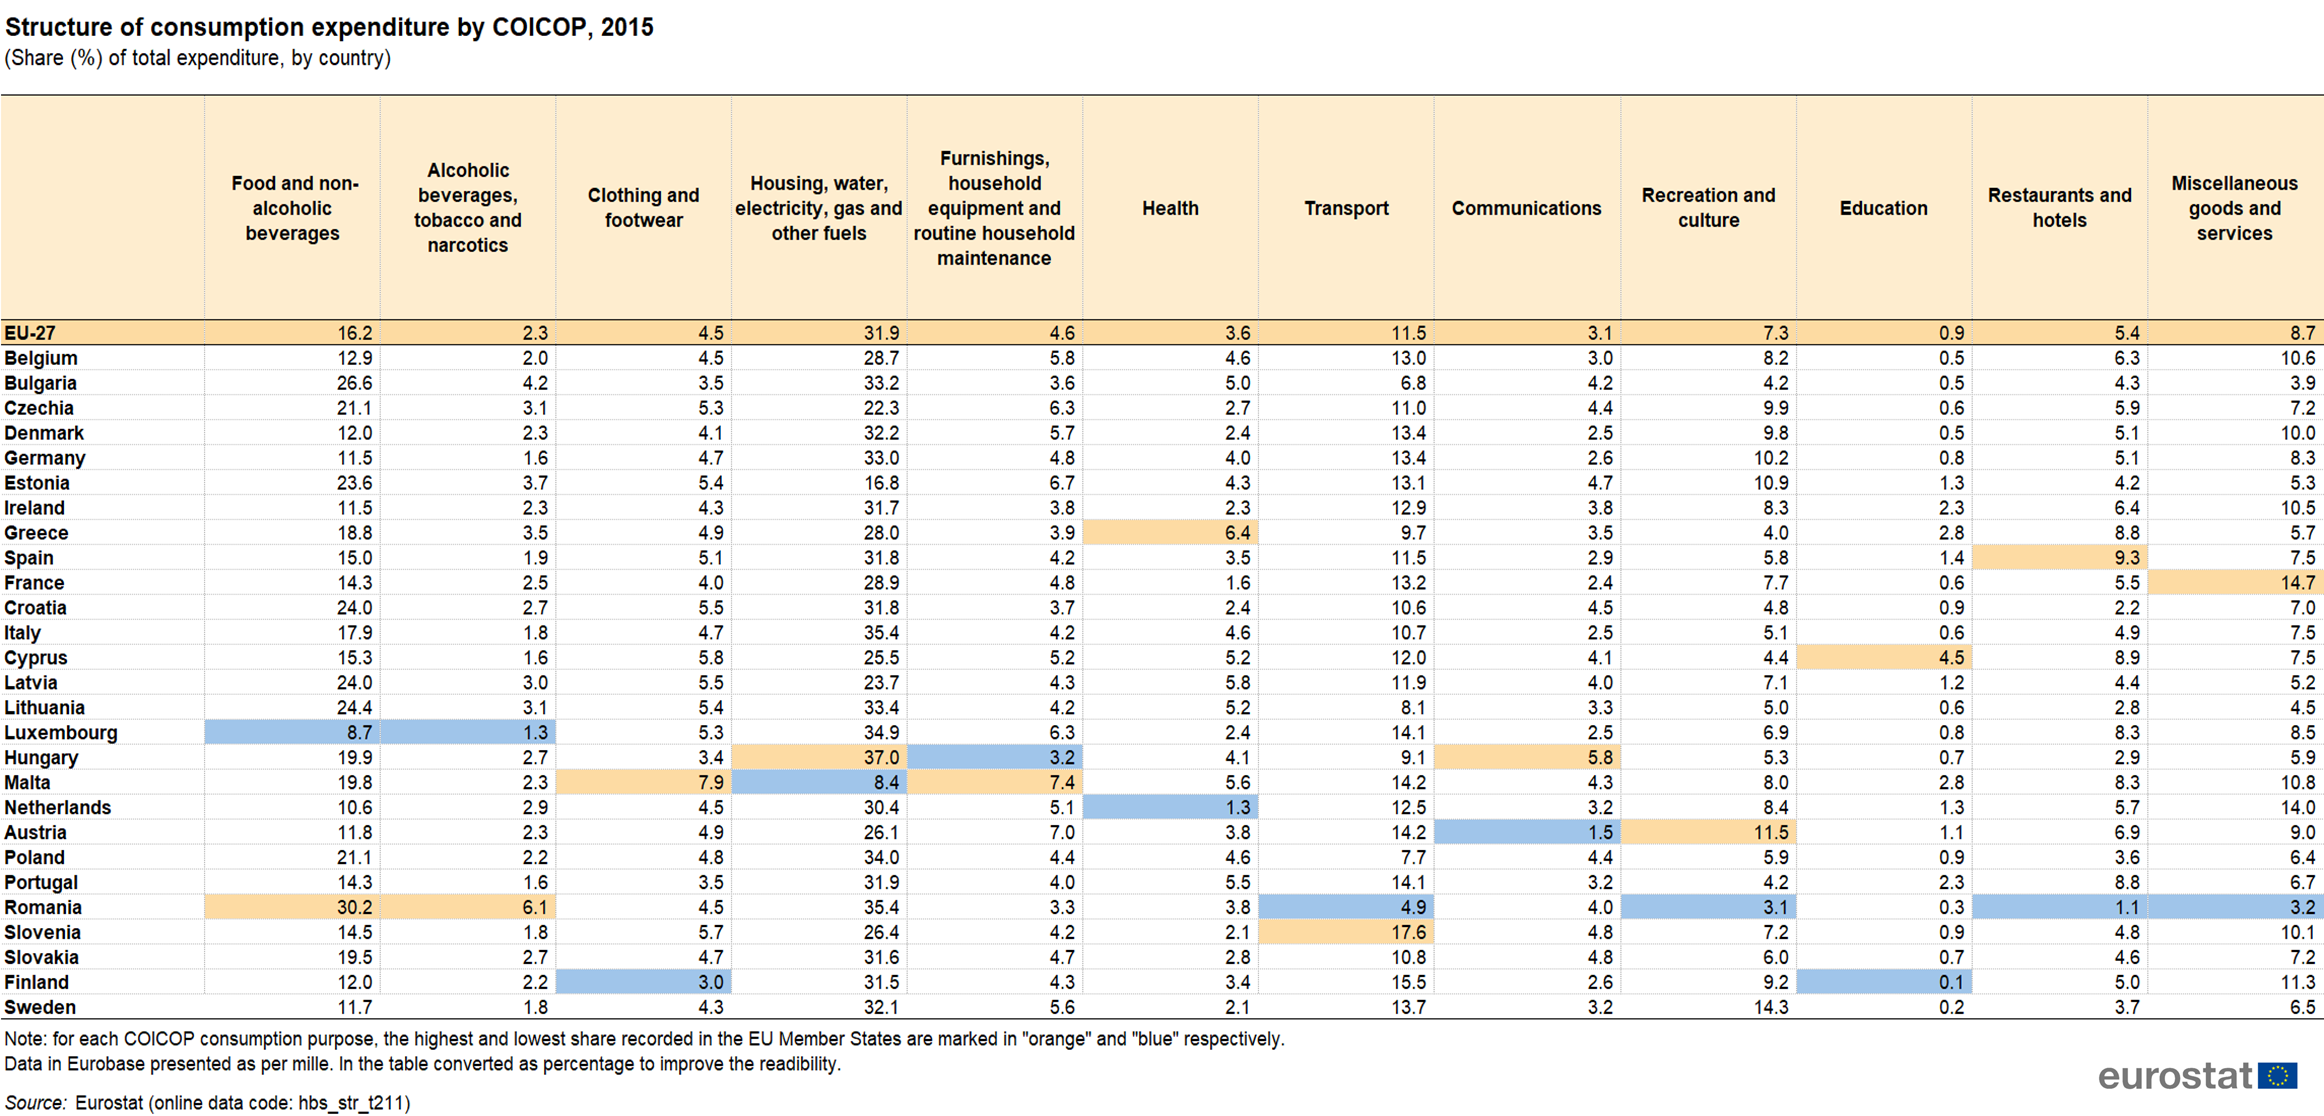
Structure of consumption expenditure by COICOP, 2015 7.PNG
(
file
)
761 KB
1
15:50, 3 April 2020
Healthy life years statistics 03 04 20.xlsx
(
file
)
294 KB
1
11:26, 3 April 2020
Healthy life years in absolute value at 65 - males 2018 1.png
(
file
)
82 KB
1
11:26, 3 April 2020
Healthy life years in absolute value at 65 - females 2018 1.png
(
file
)
80 KB
1
11:23, 3 April 2020
Healthy life years 2018 3.png
(
file
)
427 KB
1
11:21, 3 April 2020
Healthy life years 2018 2.png
(
file
)
430 KB
1
11:16, 3 April 2020
Healthy life years in absolute value at birth - males (2010-2018) 2.png
(
file
)
84 KB
1
11:14, 3 April 2020
Healthy life years in absolute value at birth - females (2010-2018) 2.png
(
file
)
80 KB
1
11:12, 3 April 2020
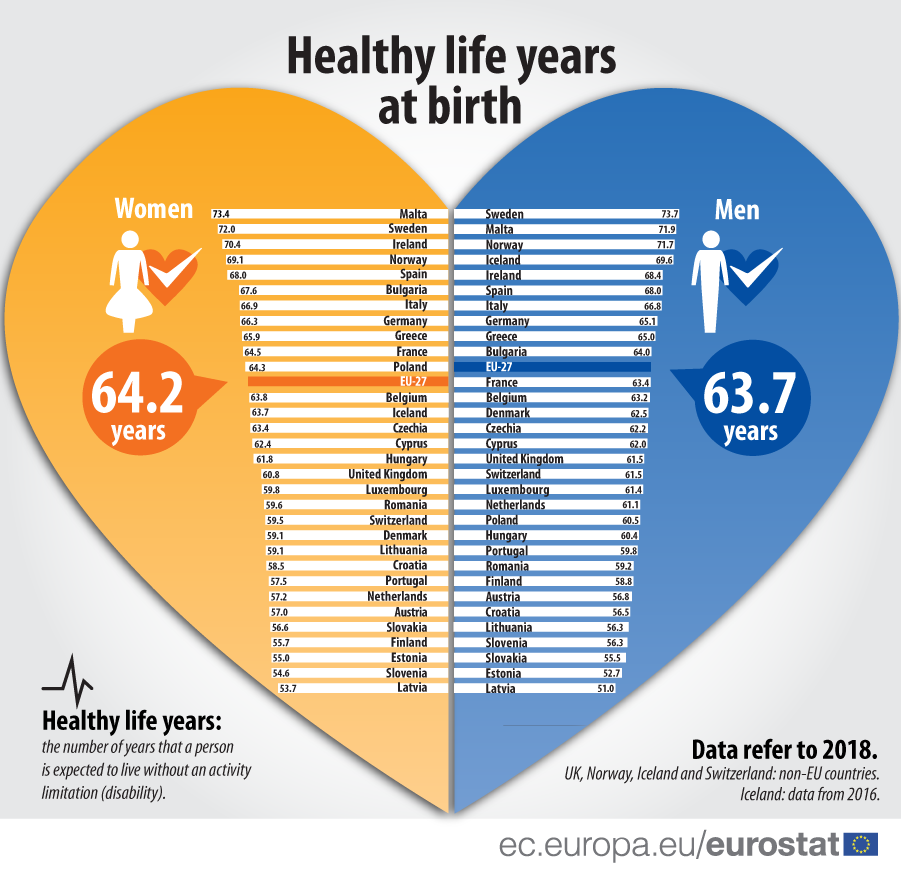
Healthy-life-years-at-birth 04 04 20.png
(
file
)
167 KB
1
17:48, 2 April 2020
Healthy life years in absolute value at 65 - males 2018.png
(
file
)
87 KB
1
17:45, 2 April 2020
Healthy life years in absolute value at 65 - females 2018.png
(
file
)
86 KB
1
17:41, 2 April 2020
Healthy life years 2018.png
(
file
)
447 KB
1
17:39, 2 April 2020
Healthy life years 2018 1.png
(
file
)
458 KB
1
17:29, 2 April 2020
Healthy life years in absolute value at birth - males (2010-2018) 1.png
(
file
)
90 KB
1
17:26, 2 April 2020
Healthy life years in absolute value at birth - females (2010-2018) 1.png
(
file
)
87 KB
1
17:19, 2 April 2020
Healthy-life-years-at-birth 03 04 20.png
(
file
)
167 KB
1
17:18, 2 April 2020
Healthy-life-years-at-birth 02 04 20.png
(
file
)
167 KB
2
11:01, 27 March 2020
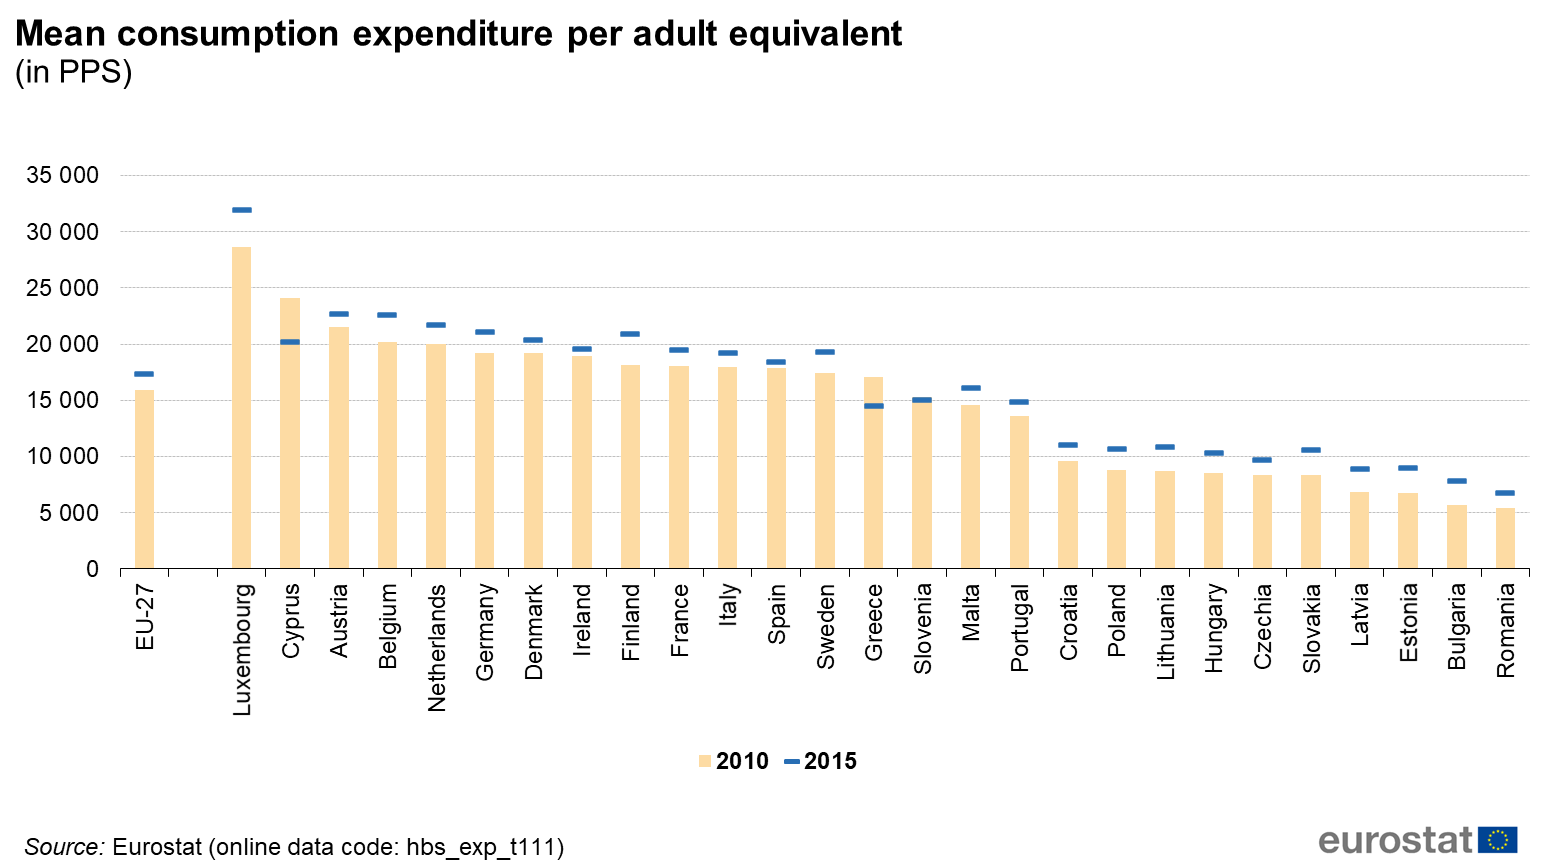
Mean consumption expenditure per adult equivalent 2015 2.PNG
(
file
)
72 KB
1
17:42, 24 March 2020
Mean consumption expenditure per household and per adult equivalent 2015 2.PNG
(
file
)
73 KB
1
16:35, 24 March 2020
SE HBS 2015 soucefile v11.xlsx
(
file
)
458 KB
1
16:33, 24 March 2020
Mean consumption expenditure by degree of urbanisation, 2015 5.PNG
(
file
)
112 KB
1
16:28, 24 March 2020
Mean consumption expenditure by number of active persons, 2015 7.PNG
(
file
)
67 KB
1
16:26, 24 March 2020
Mean consumption expenditure by income quintile, 2015 4.PNG
(
file
)
74 KB
1
16:22, 24 March 2020
Structure of consumption expenditure by COICOP, 2015 6.PNG
(
file
)
758 KB
1
15:51, 24 March 2020
Mean consumption expenditure per household and per adult equivalent 2015 1.PNG
(
file
)
73 KB
1
15:49, 24 March 2020
Mean consumption expenditure for three adults’ households, 2015 6.PNG
(
file
)
79 KB
1
13:24, 24 March 2020
Mean consumption expenditure for two adults’ households, 2015 9.PNG
(
file
)
82 KB
1
13:22, 24 March 2020
Mean consumption expenditure for single person household, 2015 6.PNG
(
file
)
71 KB
1
13:20, 24 March 2020
Mean consumption expenditure for single person household, 2015 5.PNG
(
file
)
73 KB
1
13:19, 24 March 2020
Mean consumption expenditure for single person household, 2015 5.png
(
file
)
73 KB
1
13:08, 24 March 2020
Mean consumption expenditure per household and per adult equivalent 2015.PNG
(
file
)
73 KB
1
11:47, 24 March 2020
SE HBS 2015 soucefile v10.xlsx
(
file
)
520 KB
1
11:43, 24 March 2020
Mean consumption expenditure per household and per adult equivalent 6.PNG
(
file
)
302 KB
1
12:48, 23 March 2020
HBS fig2 7 interactiv.xlsx
(
file
)
14 KB
1
10:09, 23 March 2020
HBS fig2 6 interactiv.xlsx
(
file
)
14 KB
1
09:57, 23 March 2020
HBS fig2 5 interactiv.xlsx
(
file
)
14 KB
1
09:25, 23 March 2020
SE HBS 2015 soucefile v9.xlsx
(
file
)
518 KB
1
18:53, 20 March 2020
Mean consumption expenditure by income quintile, 2019 6.PNG
(
file
)
474 KB
1
First page
Previous page
Next page
Last page
Special page
ISSN 2443-8219


_2.png)
_2.png)


_1.png)
_1.png)


