Tutorials
Log in
Statistics Explained
menu
search
search
Navigation
Main page
Statistical themes
Glossary
Categories
Statistics 4 beginners
Tutorials
Help
Eurostat home
Education corner
Online publications
Regional yearbook
Sustainable development
Full list
Tools
User contributions
Logs
View user groups
Special pages
search
Navigation
Main page
Statistical themes
Glossary
Categories
Statistics 4 beginners
Tutorials
Help
Eurostat home
Education corner
Online publications
Regional yearbook
Sustainable development
Full list
Tools
User contributions
Logs
View user groups
Special pages
Navigation
Main page
Statistical themes
Glossary
Categories
Statistics 4 beginners
Tutorials
Help
Eurostat home
Education corner
Online publications
Regional yearbook
Sustainable development
Full list
Tools
User contributions
Logs
View user groups
Special pages
Uploads by Anduesi
This special page shows all uploaded files.
File list
Items per page:
20
50
100
250
500
Search for media name:
Username:
Include old versions of files
Go
First page
Previous page
Next page
Last page
Date
Name
Thumbnail
Size
Description
Versions
19:32, 24 March 2020
Five main EU-27 Member states granting citizenship, 2018 v2.png
(
file
)
36 KB
1
19:23, 24 March 2020
Acquisitions of citizenship March 2020-v2.xlsx
(
file
)
129 KB
1
18:00, 23 March 2020
Table 4 RY2018 v20200323.xlsx
(
file
)
30 KB
1
17:54, 23 March 2020
Acquisitions of citizenships RY2018 v20200323.xlsx
(
file
)
129 KB
1
17:41, 23 March 2020
Acquisitions of citizenship per 1000 persons, EU-27, UK and EFTA, 2018.png
(
file
)
81 KB
1
17:38, 23 March 2020
Acquisitions of citizenship, relative change, EU-27, UK and EFTA, 2018-2017 v2.png
(
file
)
86 KB
1
17:34, 23 March 2020
Acquisitions of citizenship, relative change, EU-27, UK and EFTA, 2018-2017.png
(
file
)
87 KB
1
17:29, 23 March 2020
Five main EU-27 Member states granting citizenship, 2018.png
(
file
)
36 KB
1
17:23, 23 March 2020
Sex and age distribution of persons acquiring citizenship in the EU-27, UK and EFTA, 2018.png
(
file
)
617 KB
1
17:21, 23 March 2020
Thirty main countries of previous citizenship, 2018 Rank.png
(
file
)
522 KB
1
17:18, 23 March 2020
Acquisitions of citizenship by group of previous citizenship in the EU-27, UK and EFTA, 2018.png
(
file
)
535 KB
1
17:12, 23 March 2020
Total number of acquisitions of citizenship in the EU-27, UK and EFTA, 2009-2018.png
(
file
)
470 KB
1
19:37, 5 March 2019
Number of persons having acquired the citizenship of an EU Member State, EU-28, 2009–17 (thousand).png
(
file
)
25 KB
1
19:16, 5 March 2019
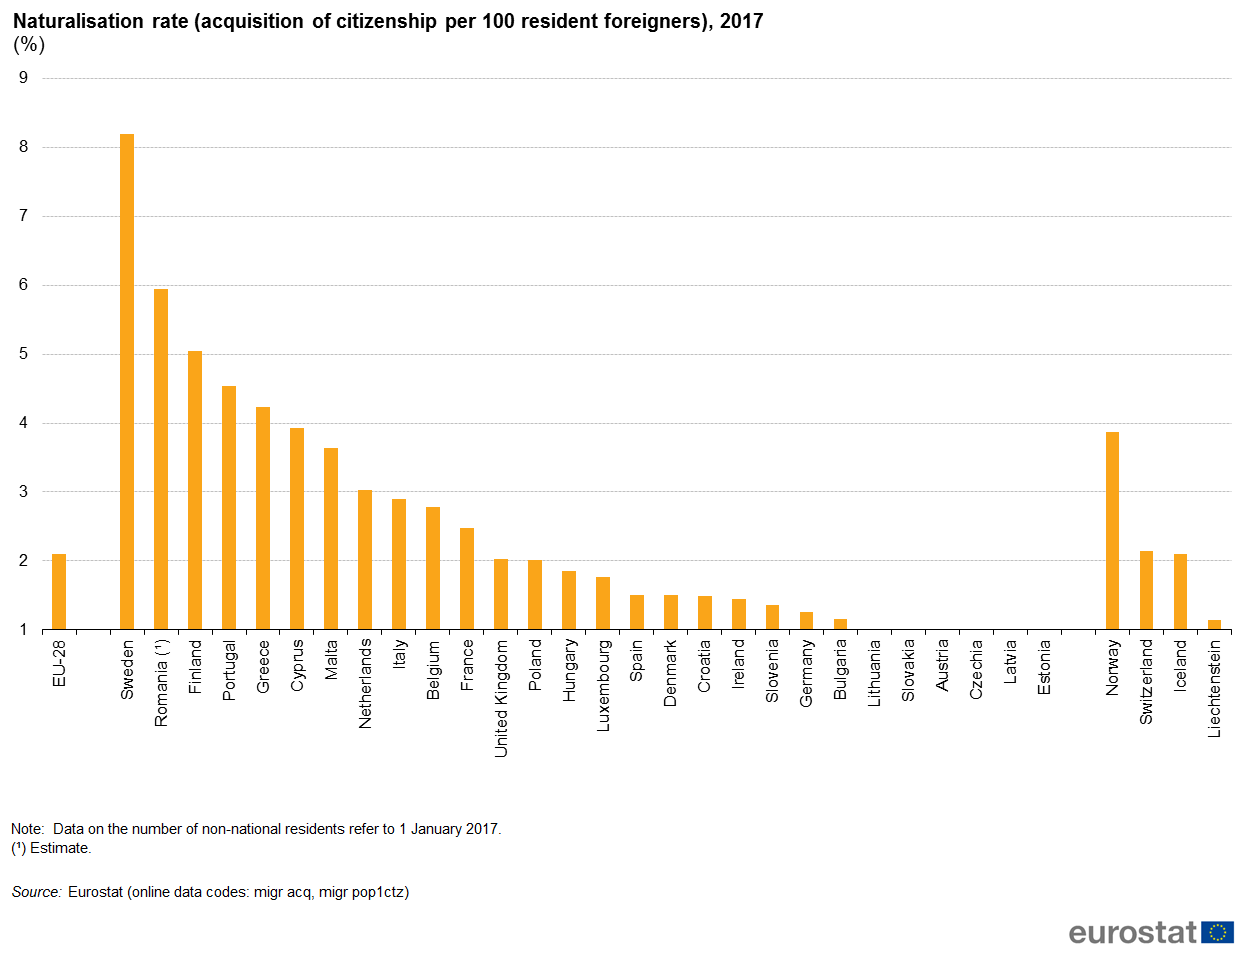
Naturalisation rate (acquisition of citizenship per 100 resident foreigners), 2017 (%) .png
(
file
)
45 KB
1
19:15, 5 March 2019
Acquisitions of citizenship by group of previous citizenship, 2017 .png
(
file
)
72 KB
1
19:11, 5 March 2019
Age structure of the national and non-national populations, EU-28, 1 January 2018 (%).png
(
file
)
37 KB
2
19:04, 5 March 2019
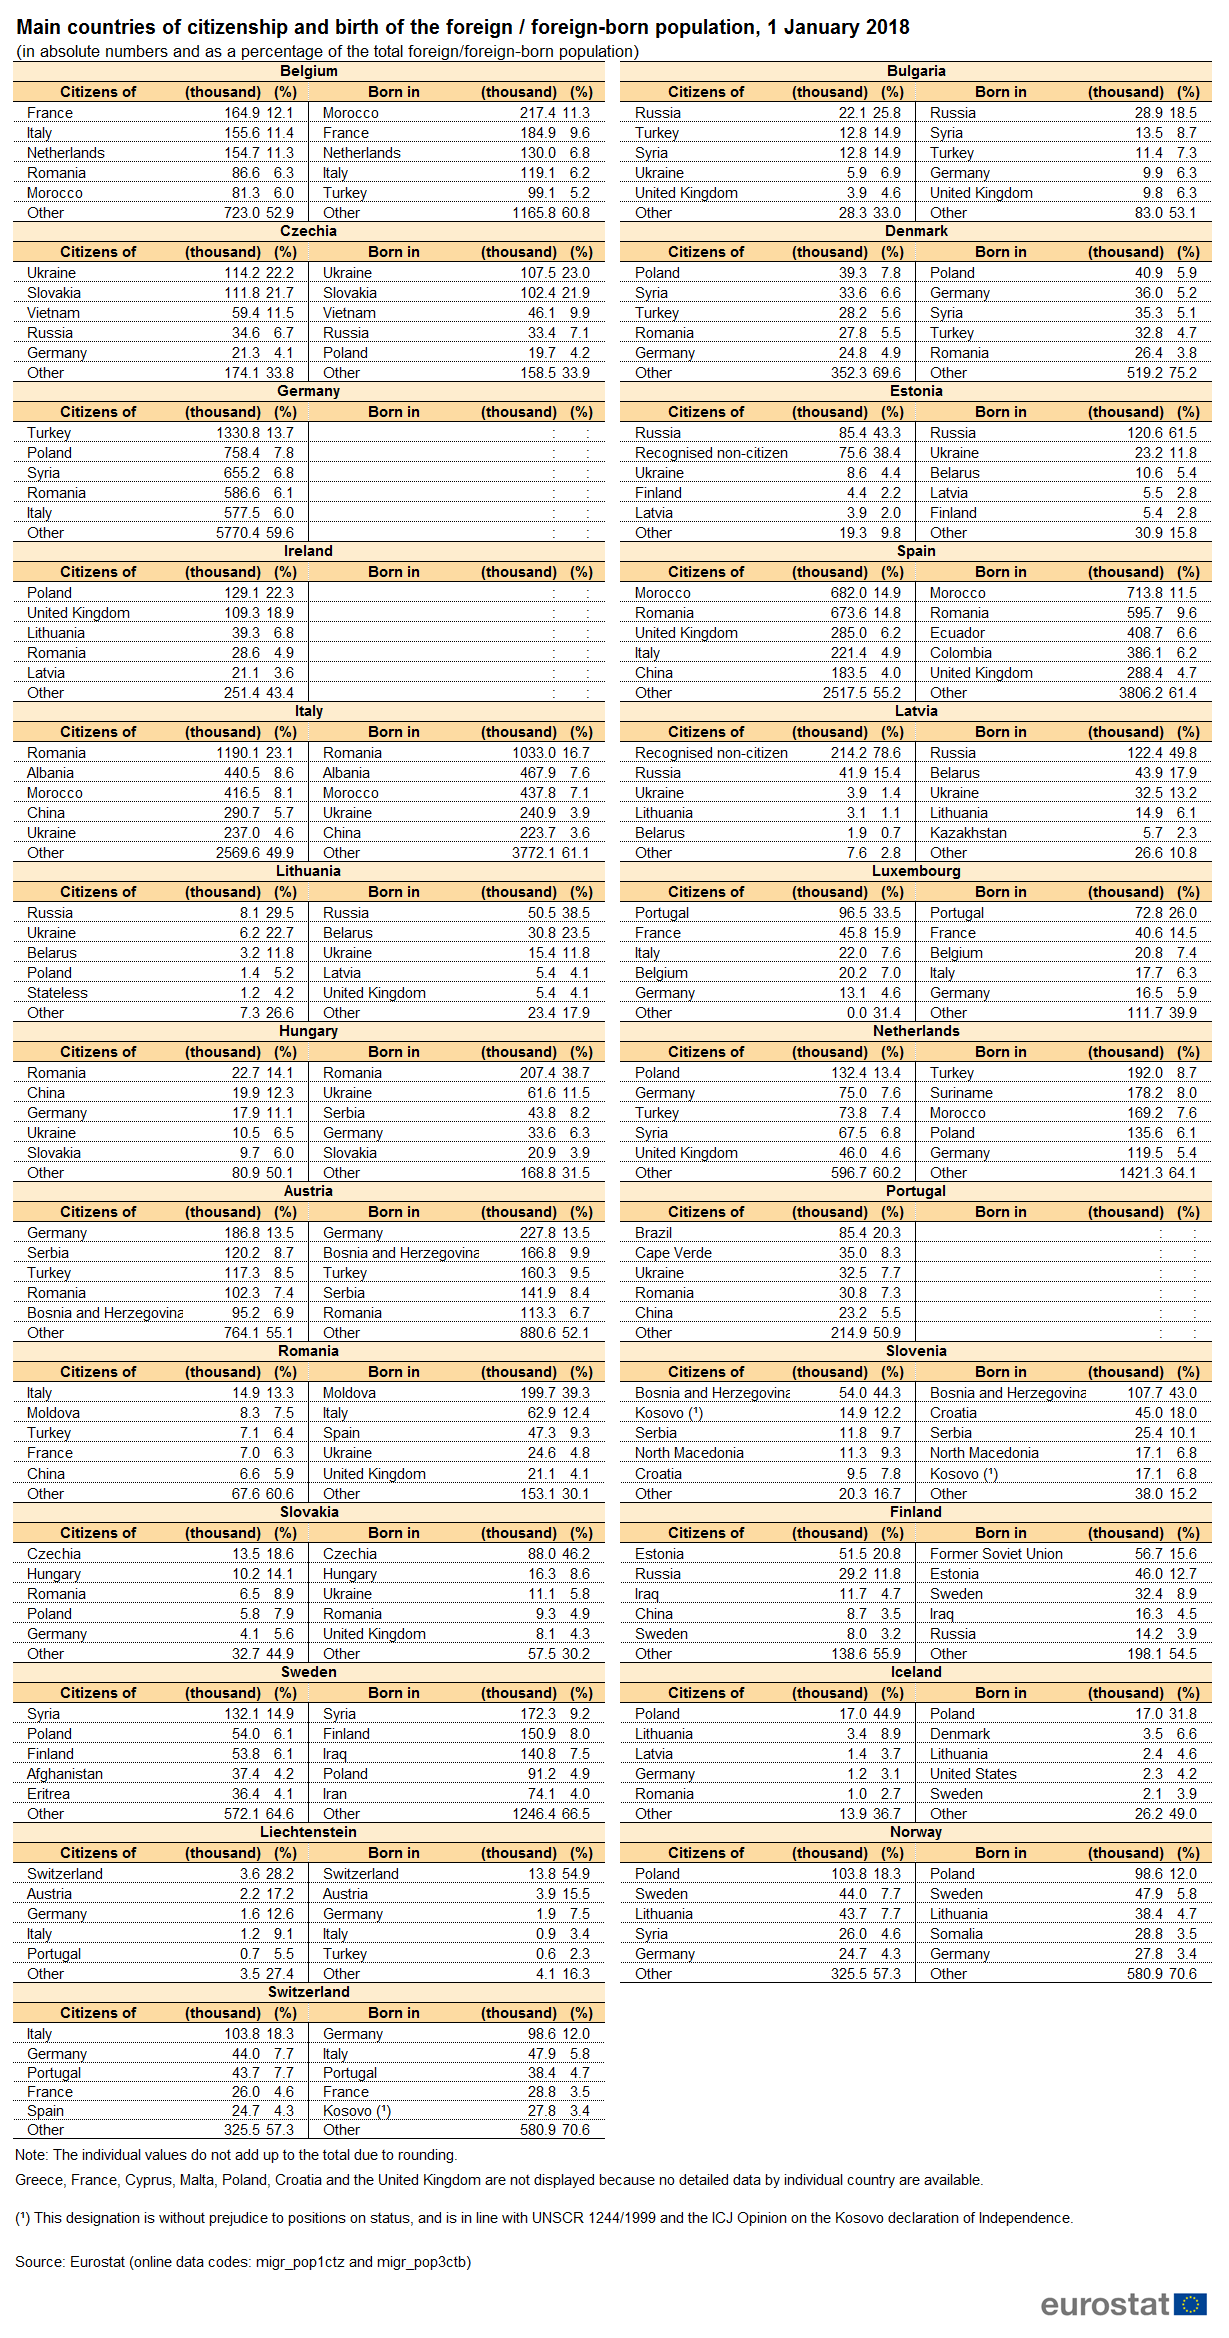
Main countries of citizenship and birth of the foreign foreign-born population, 1 January 2018 (in absolute numbers and as a percentage of the total foreign foreign-born population).png
(
file
)
219 KB
2
18:59, 5 March 2019
Age structure of immigrants by citizenship, EU-28, 2017 (%).png
(
file
)
61 KB
2
18:57, 5 March 2019
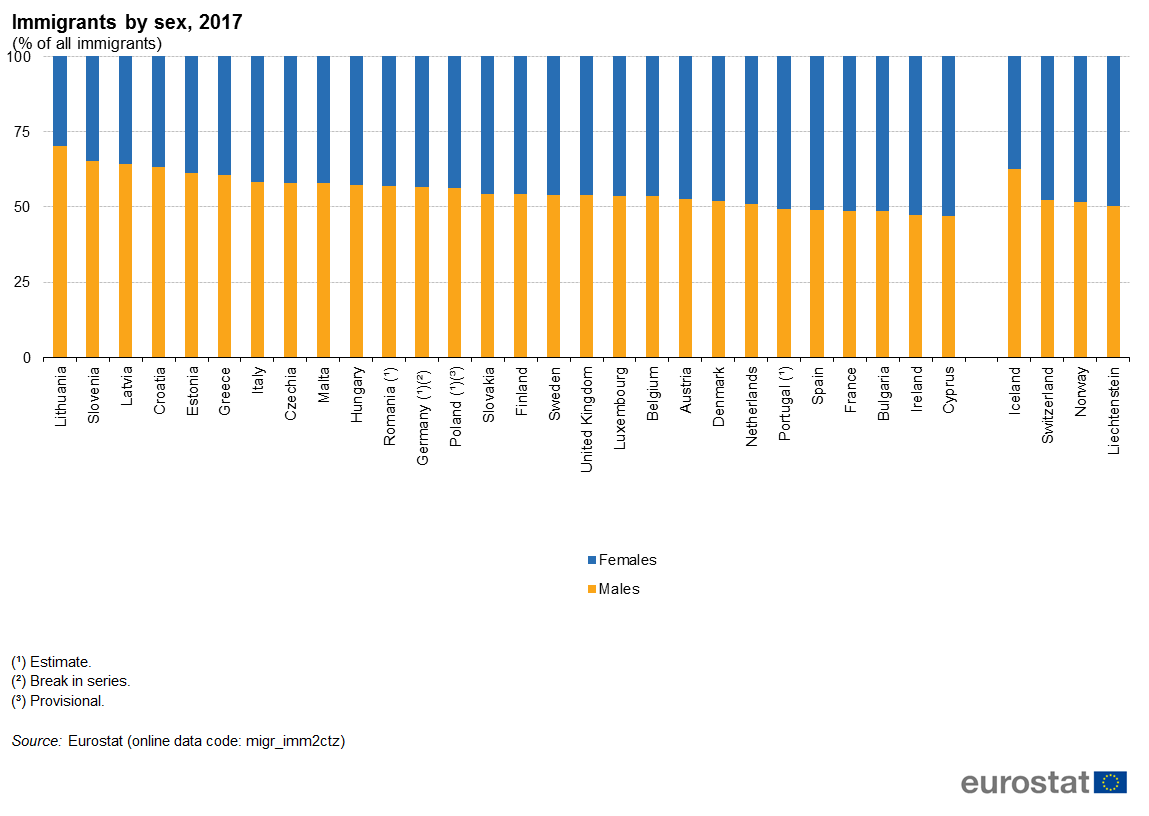
Immigrants by sex, 2017 (% of all immigrants).png
(
file
)
57 KB
3
18:46, 5 March 2019
Immigration by country of birth, 2017 .png
(
file
)
83 KB
2
18:44, 5 March 2019
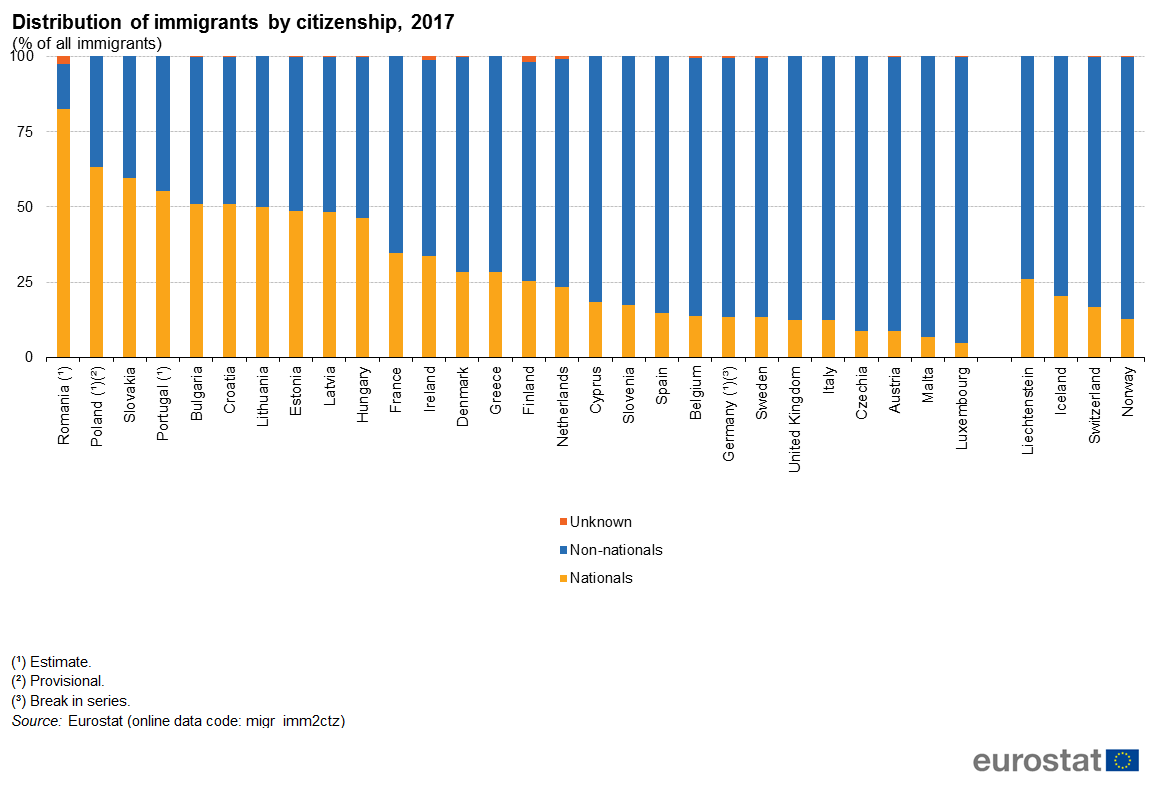
Distribution of immigrants by citizenship, 2017 (% of all immigrants).png
(
file
)
59 KB
2
18:41, 5 March 2019
Immigrants, 2017 (per 1 000 inhabitants).png
(
file
)
34 KB
2
18:18, 5 March 2019
Immigration by citizenship, 2017 .png
(
file
)
84 KB
2
15:09, 5 March 2019
02 Table 3 RY2017.xlsx
(
file
)
30 KB
1
17:07, 4 March 2019
01 Migration and migrant population statistics RY2017.xlsx
(
file
)
219 KB
1
16:41, 4 March 2019
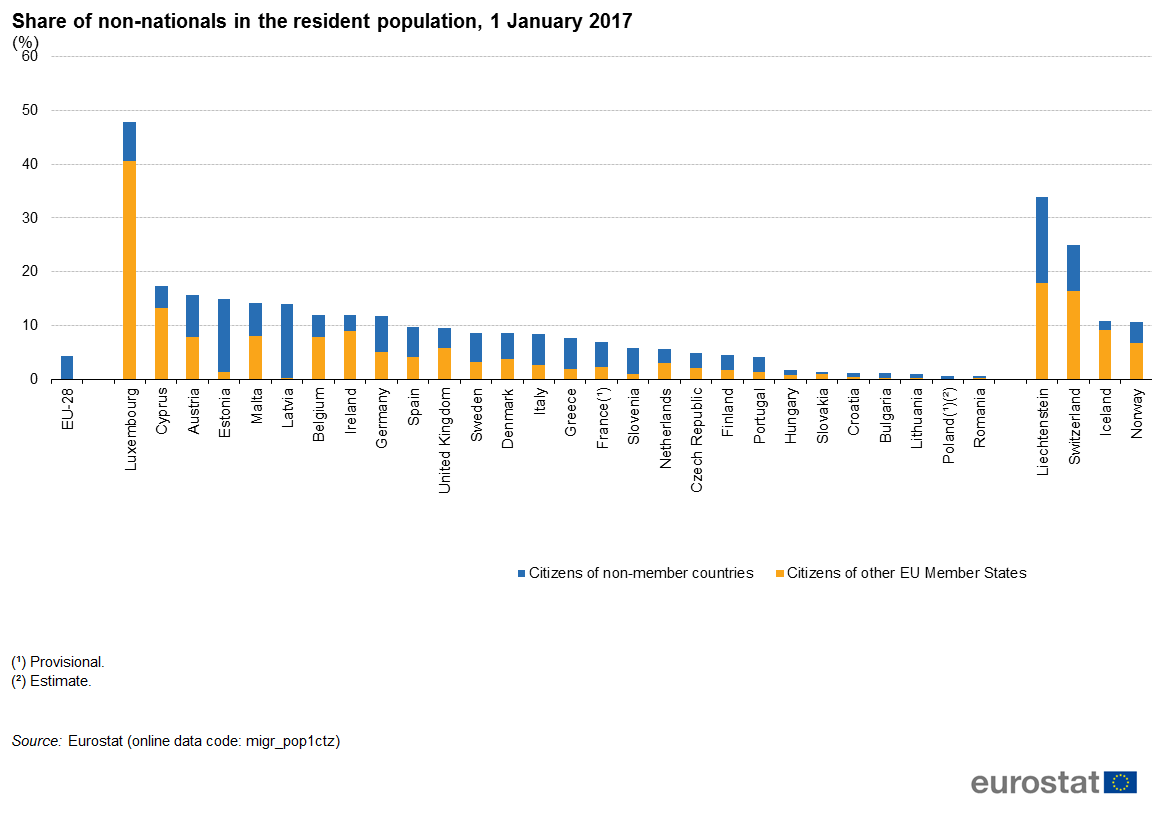
Share of non-nationals in the resident population, 1 January 2017 (%).png
(
file
)
37 KB
3
18:54, 28 February 2019
Thirty main countries of previous citizenship, 2017.png
(
file
)
80 KB
1
14:23, 28 February 2019
Distribution by sex and age of persons acquiring citizenship in the EU-28, 2017.png
(
file
)
50 KB
1
14:14, 28 February 2019
Table 3 RY2017.xlsx
(
file
)
30 KB
1
14:10, 28 February 2019
Distribution by gender and age of persons acquiring citizenship in the EU-28, 2017.png
(
file
)
50 KB
3
13:57, 28 February 2019
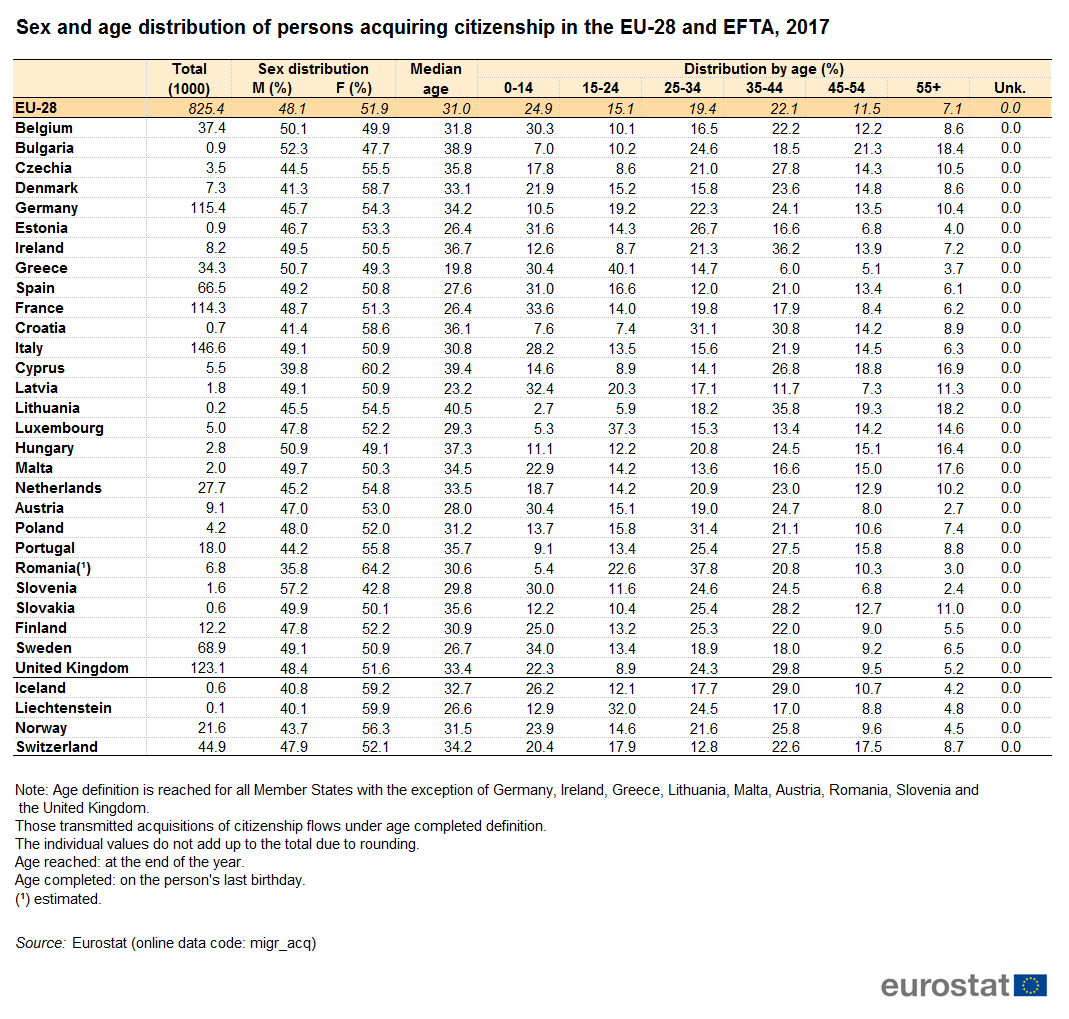
Sex and age distribution of persons acquiring citizenship in the EU-28 and EFTA, 2017.png
(
file
)
87 KB
1
13:53, 28 February 2019
Acquisitions of citizenship by group of previous citizenship in the EU-28 and EFTA, 2017 .png
(
file
)
73 KB
1
13:51, 28 February 2019
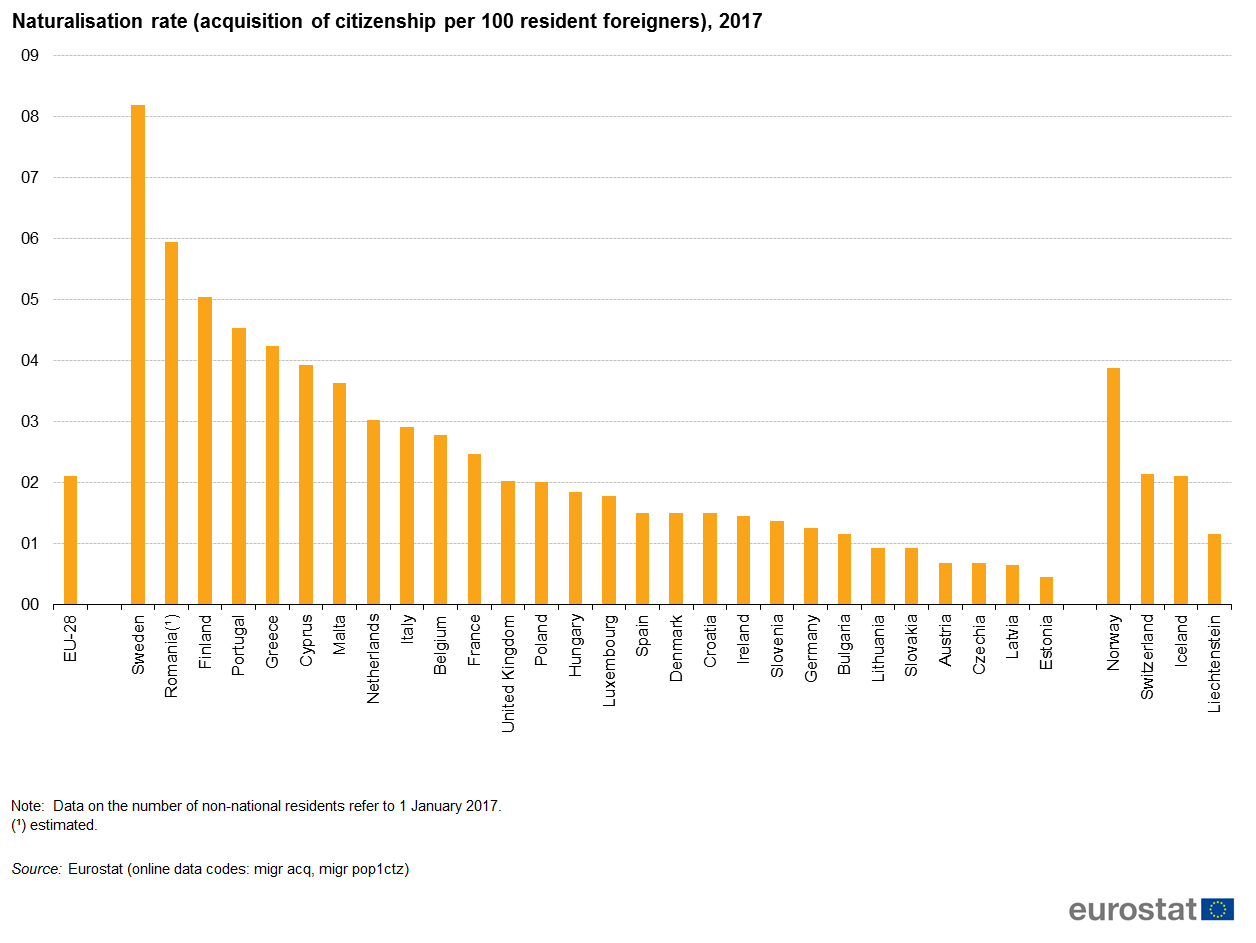
Naturalisation rate (acquisition of citizenship per 100 resident foreigners), 2017.png
(
file
)
51 KB
1
13:45, 28 February 2019
Acquisitions of citizenship per 1000 persons, EU-28 and EFTA, 2017.png
(
file
)
35 KB
1
12:14, 28 February 2019
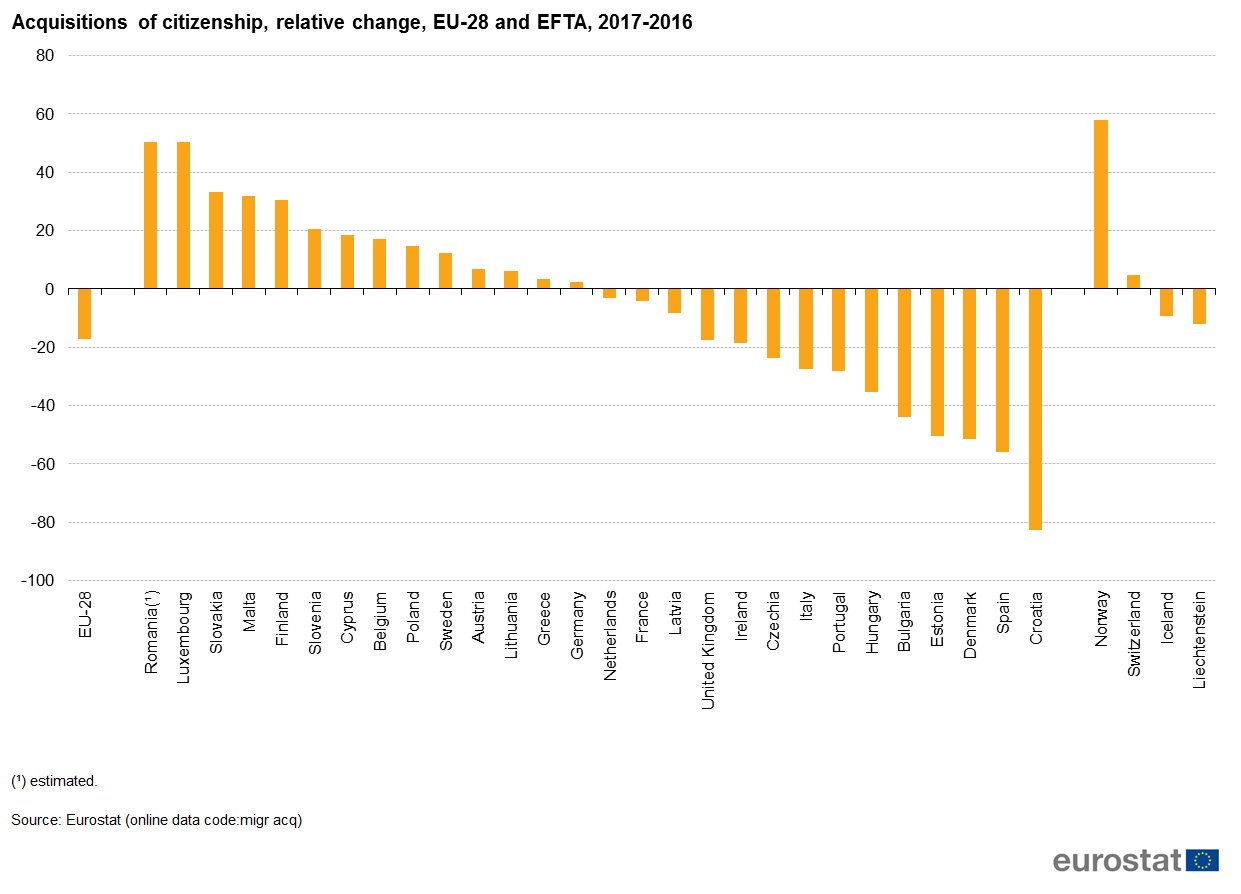
Acquisitions of citizenship, relative change, EU-28 and EFTA, 2017-2016.png
(
file
)
40 KB
1
12:09, 28 February 2019
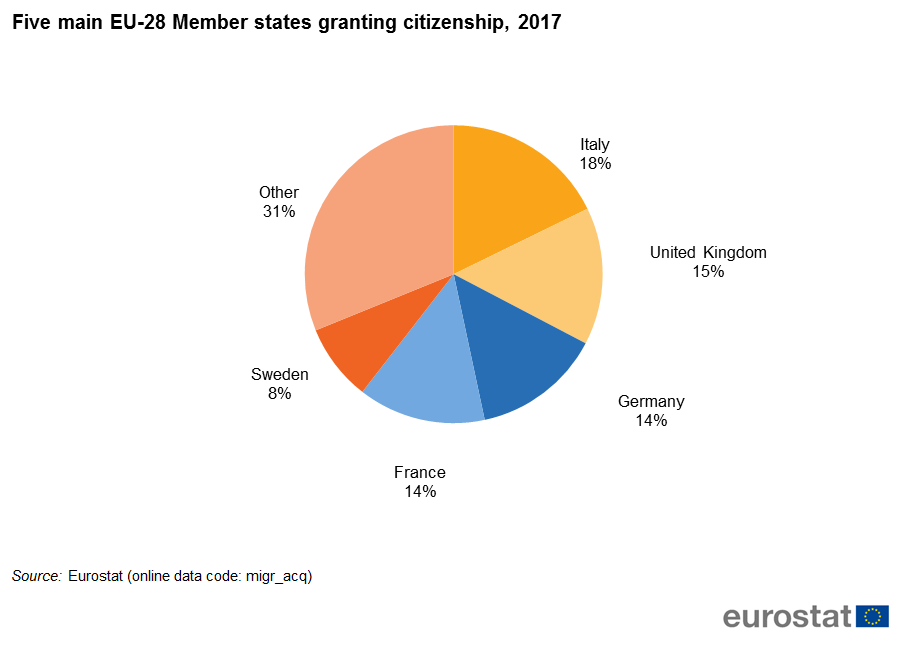
Five main EU-28 Member states granting citizenship, 2017.png
(
file
)
27 KB
1
12:06, 28 February 2019
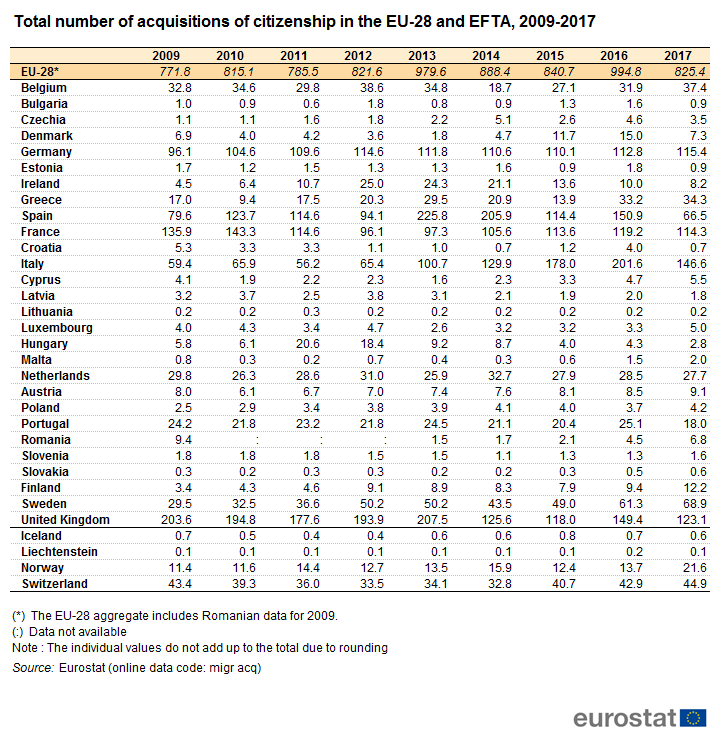
Total number of acquisitions of citizenship in the EU-28 and EFTA, 2009-2017.png
(
file
)
66 KB
1
12:00, 28 February 2019
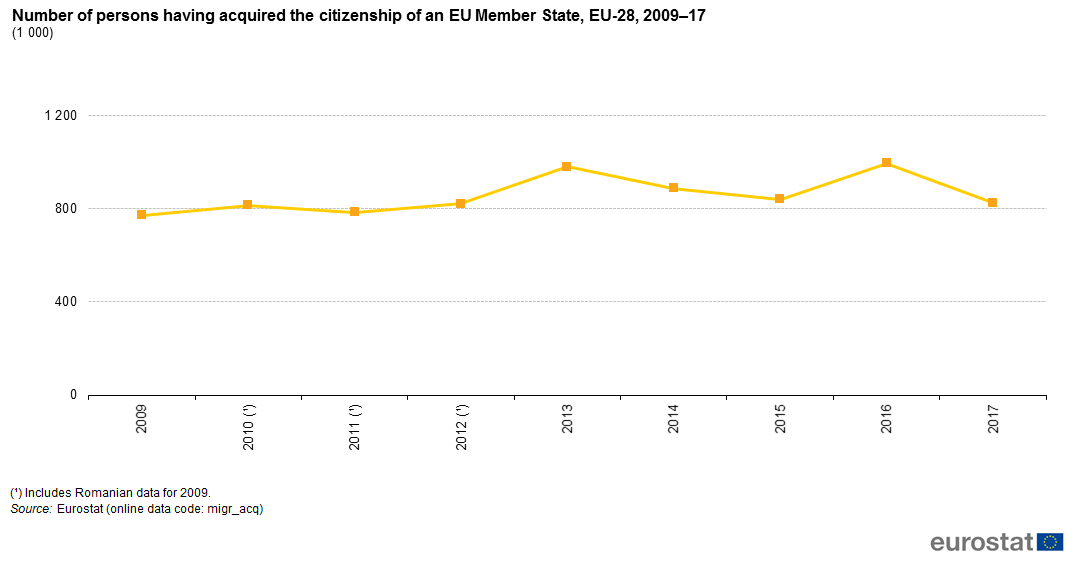
Number of persons having acquired the citizenship of an EU Member State, EU-28, 2009–17 (1 000).png
(
file
)
29 KB
1
10:23, 12 April 2018
Migration and migrant population statistics 11.4.2018.xlsx
(
file
)
212 KB
2
10:22, 12 April 2018
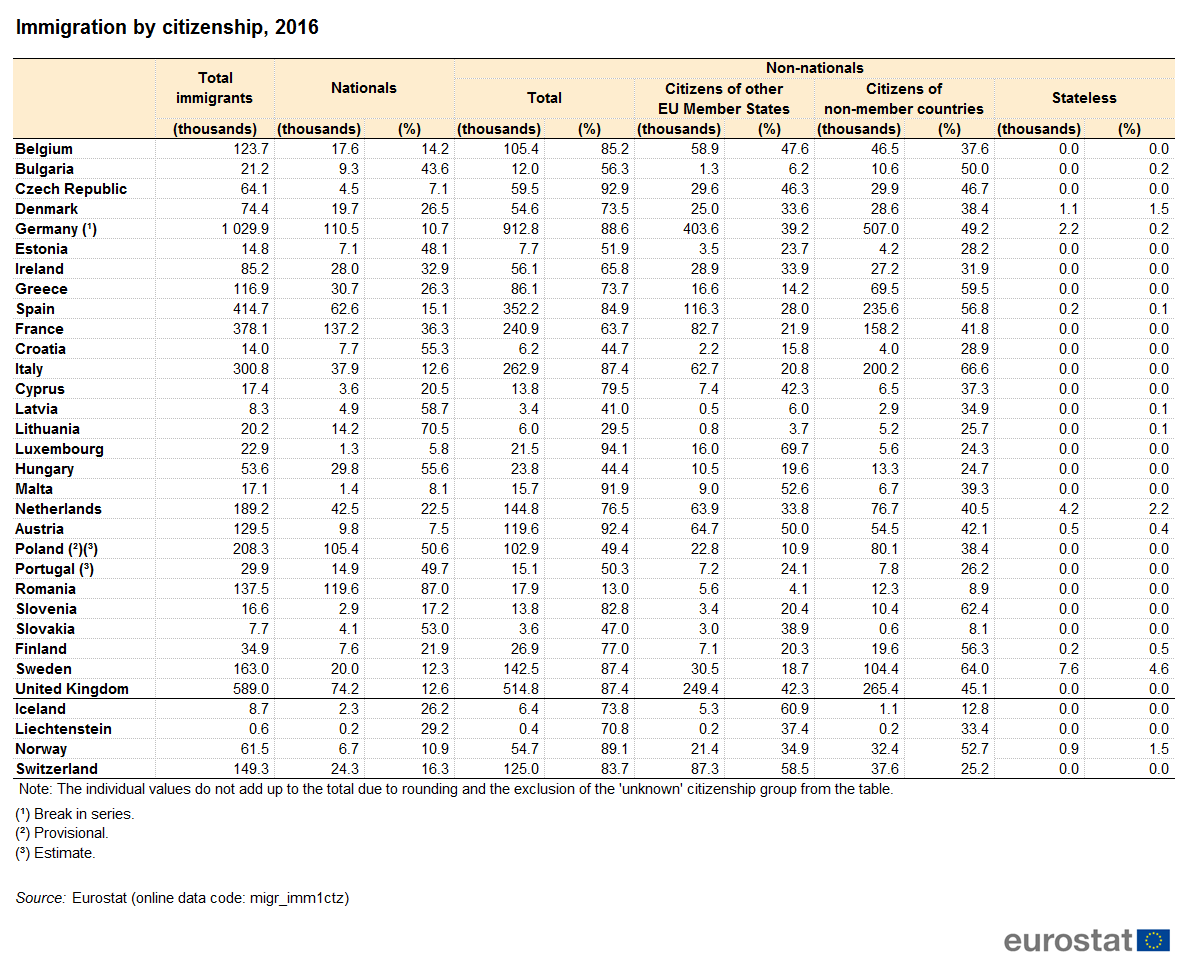
Immigration by citizenship, 2016 .png
(
file
)
84 KB
2
10:21, 12 April 2018
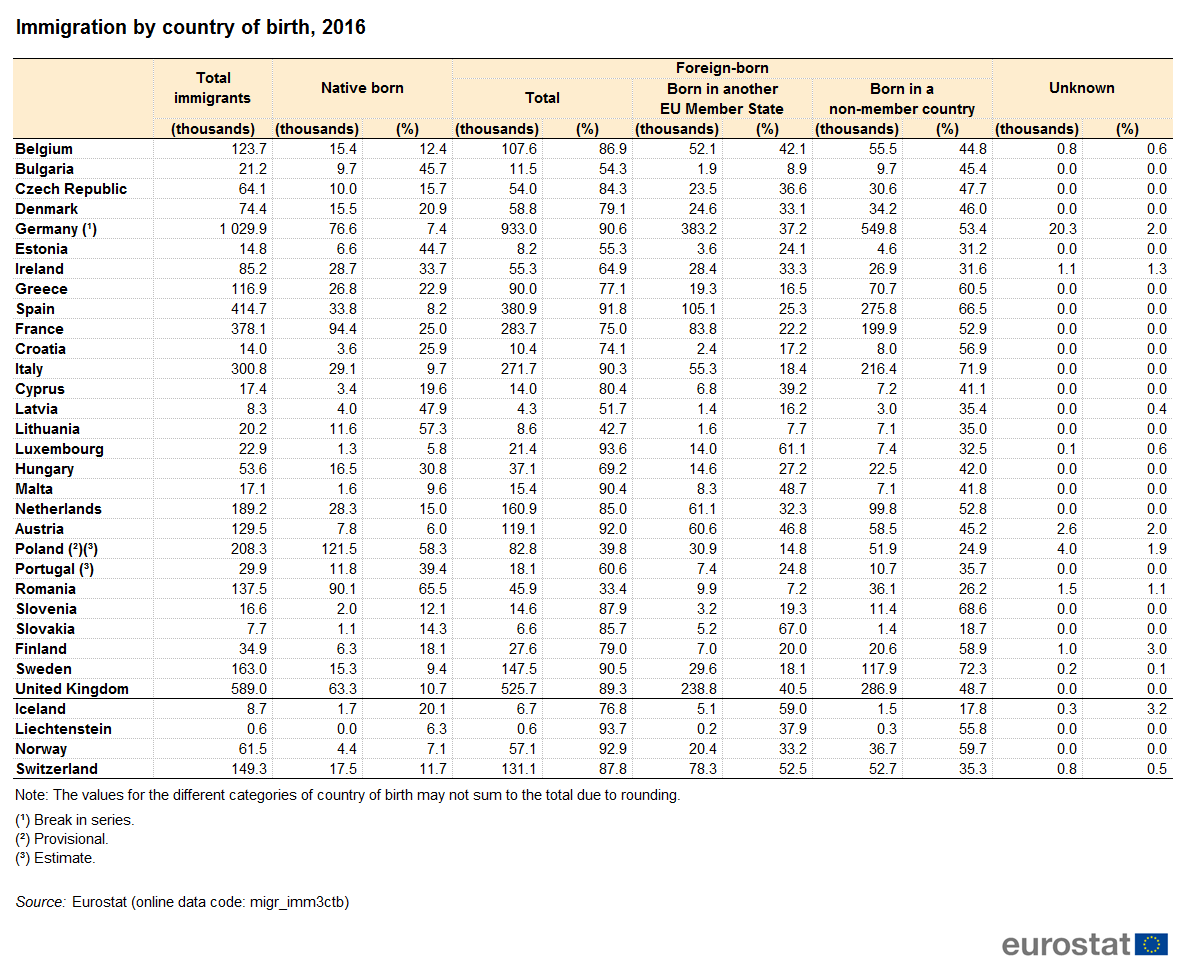
Immigration by country of birth, 2016 .png
(
file
)
84 KB
2
10:20, 12 April 2018
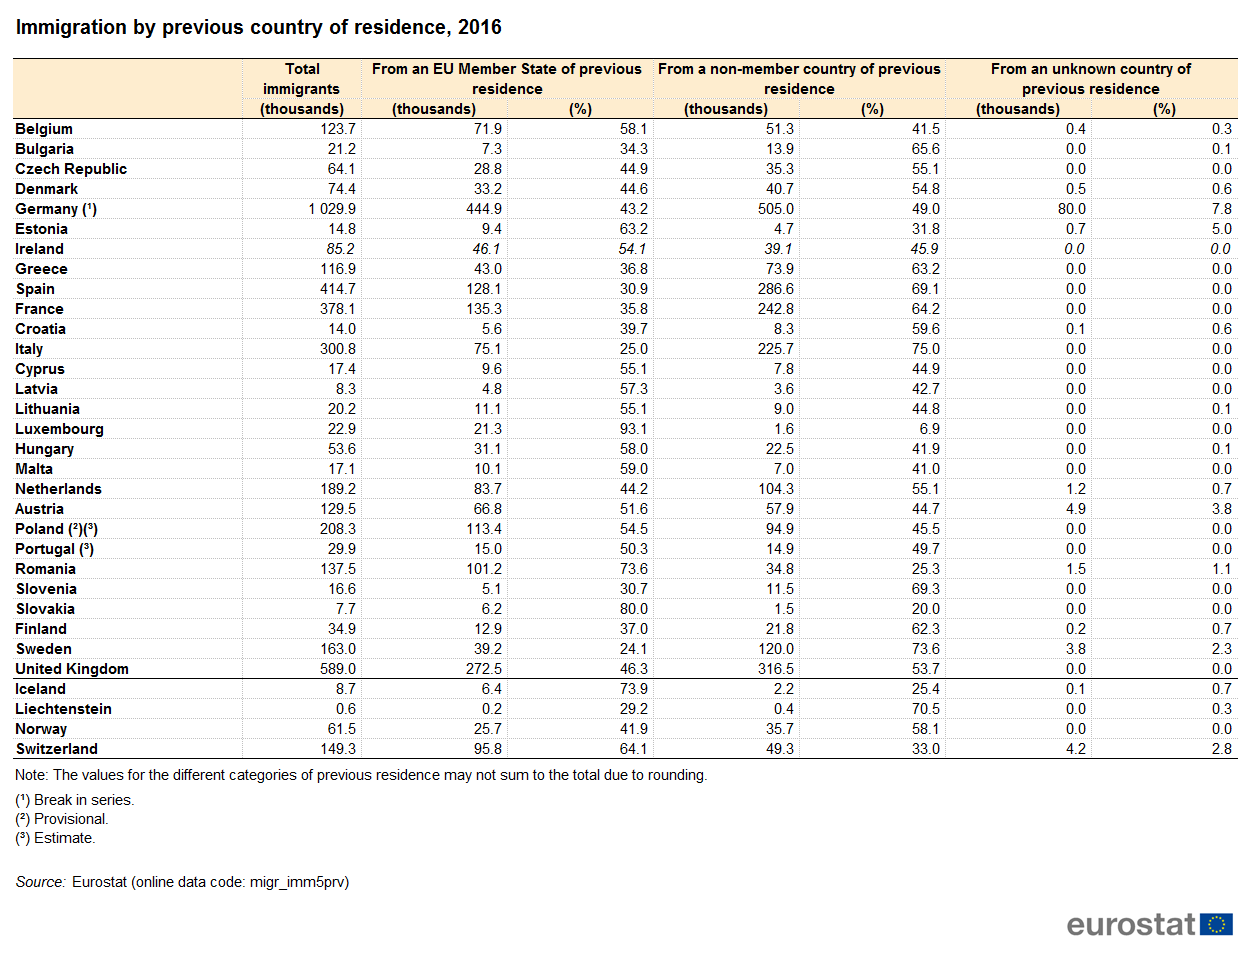
Immigration by previous country of residence, 2016 .png
(
file
)
71 KB
2
10:19, 12 April 2018
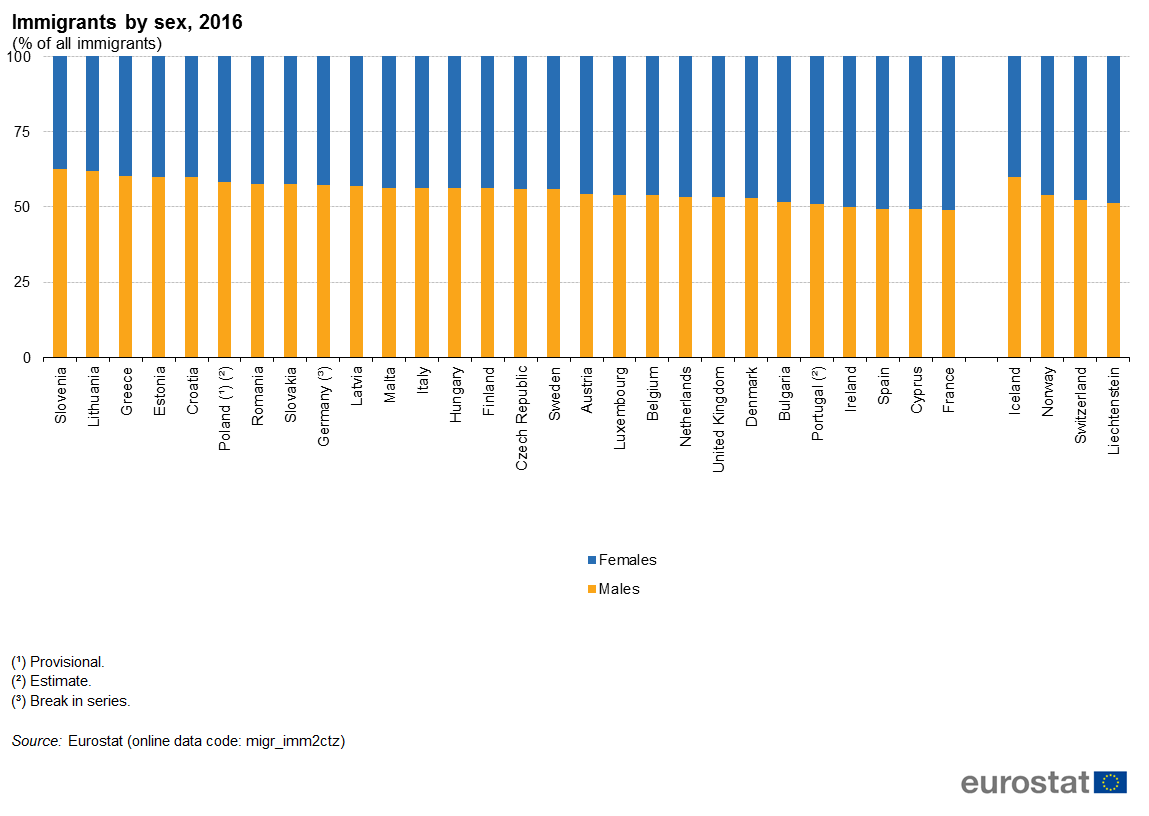
Immigrants by sex, 2016 (% of all immigrants).png
(
file
)
57 KB
2
10:19, 12 April 2018
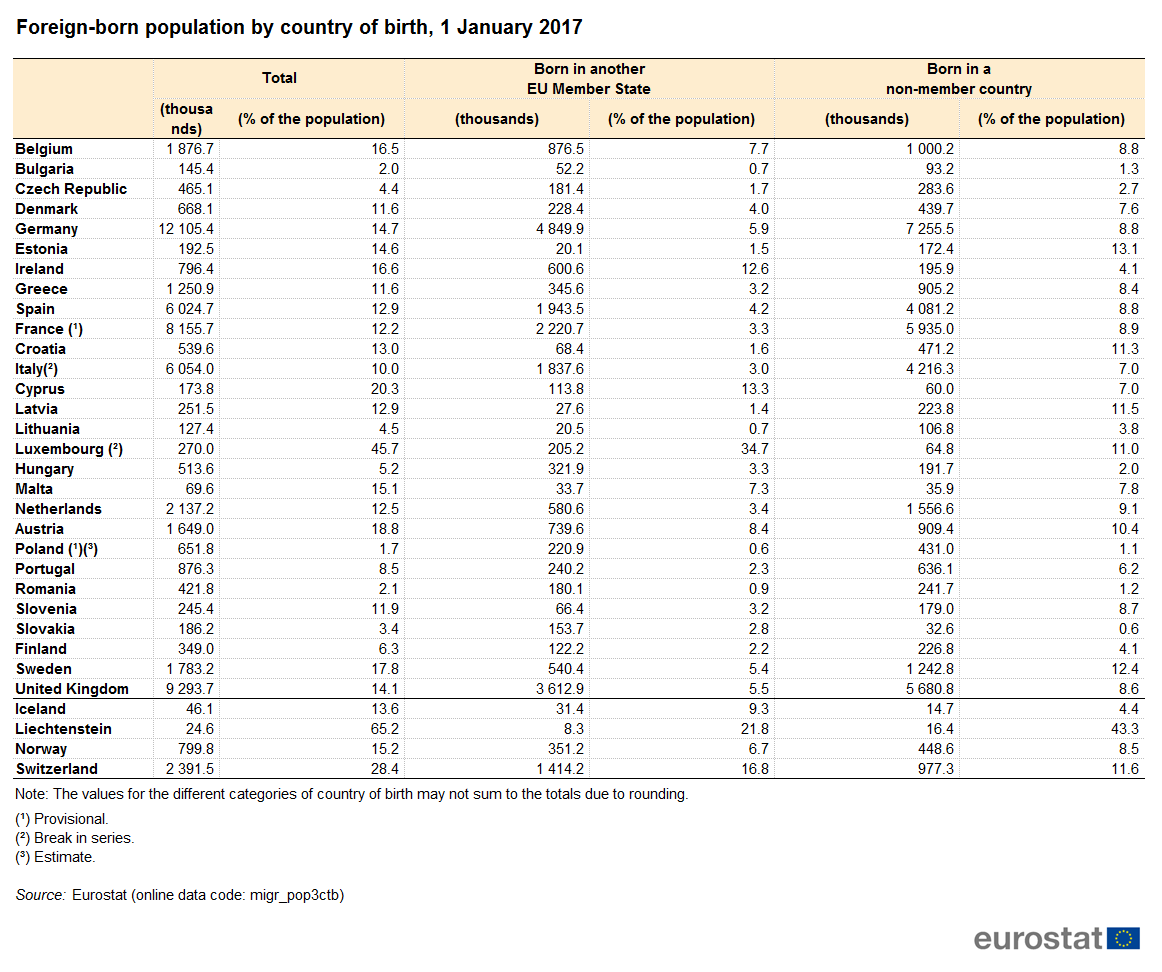
Foreign-born population by country of birth, 1 January 2017 .png
(
file
)
71 KB
2
10:19, 12 April 2018
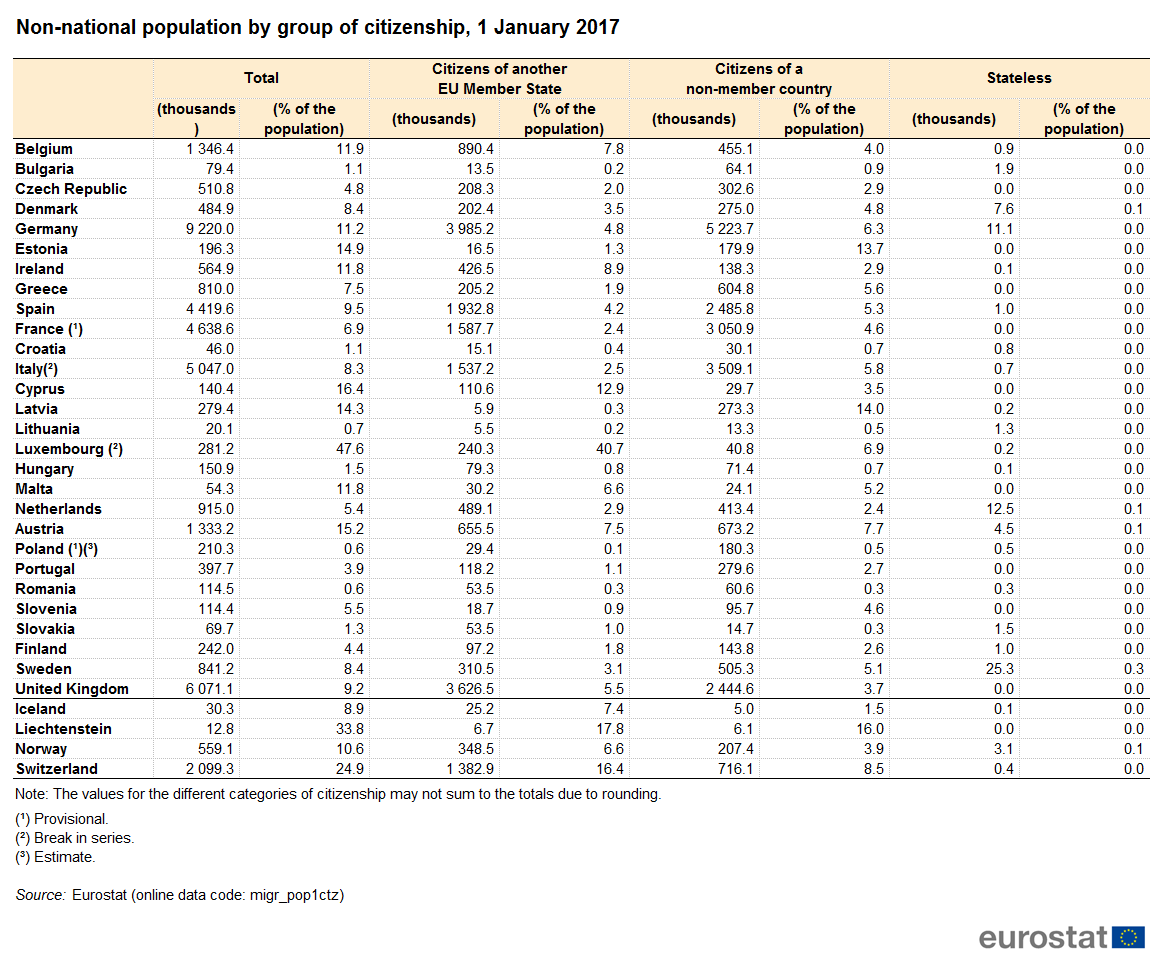
Non-national population by group of citizenship, 1 January 2017 .png
(
file
)
75 KB
2
10:18, 12 April 2018
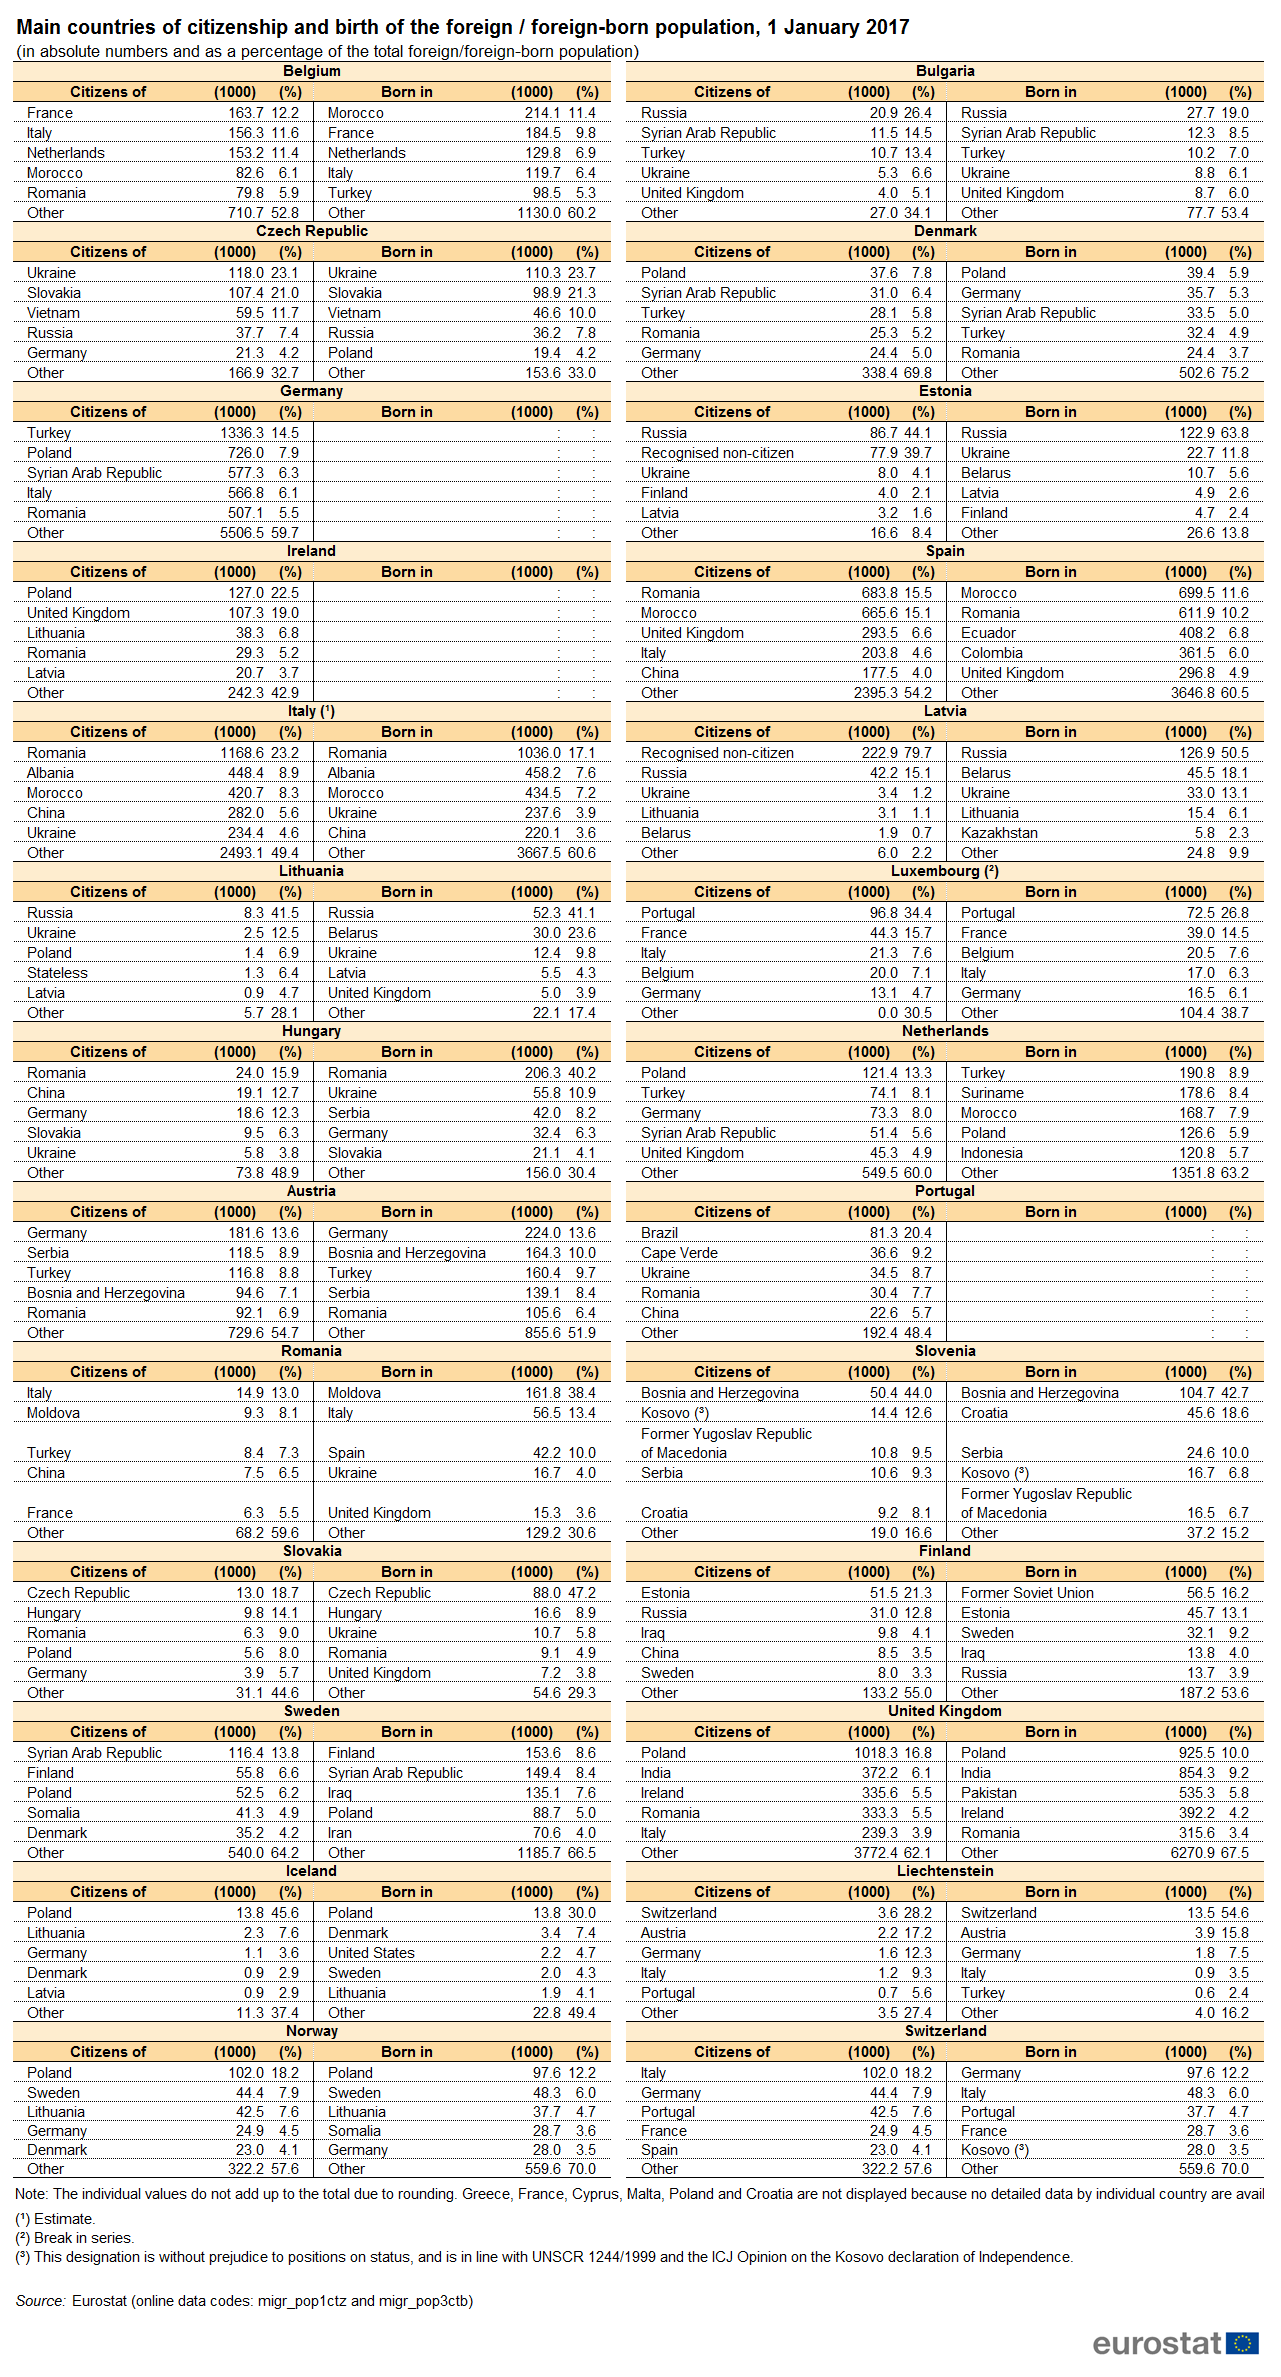
Main countries of citizenship and birth of the foreign foreign-born population, 1 January 2017 (in absolute numbers and as a percentage of the total foreign foreign-born population).png
(
file
)
230 KB
2
10:16, 12 April 2018
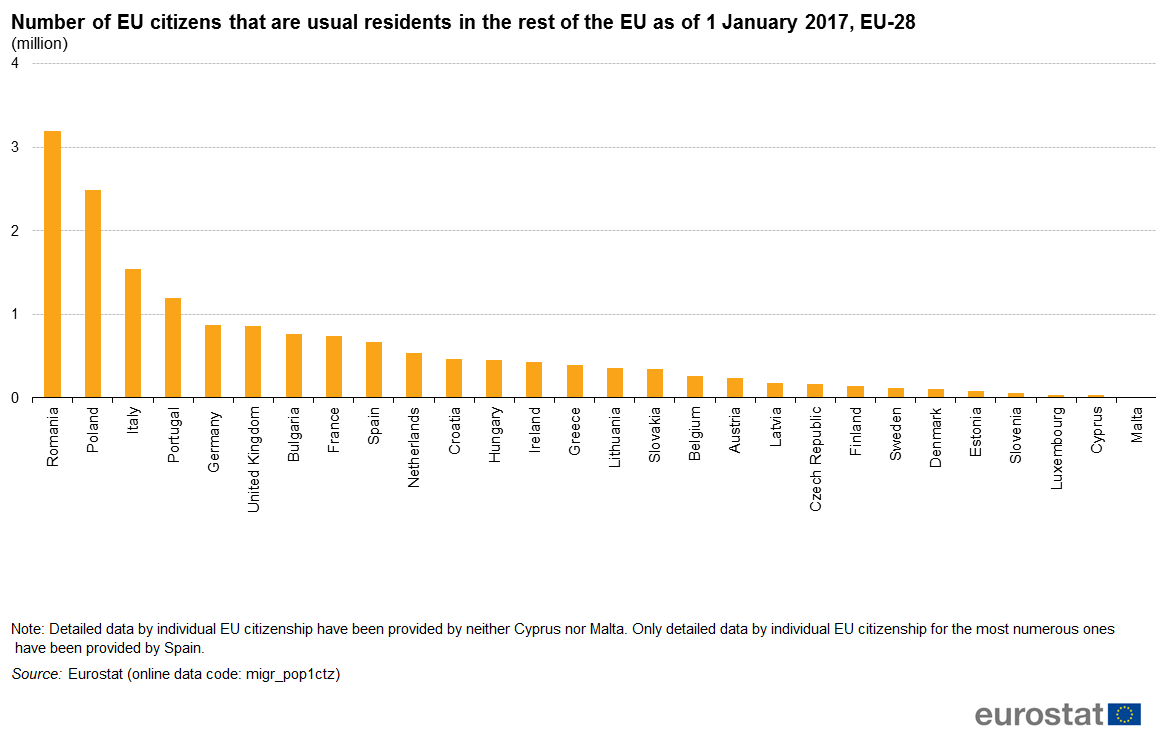
Number of EU citizens that are usual residents in the rest of the EU as of 1 January 2017, EU-28 (million).png
(
file
)
34 KB
2
10:16, 12 April 2018
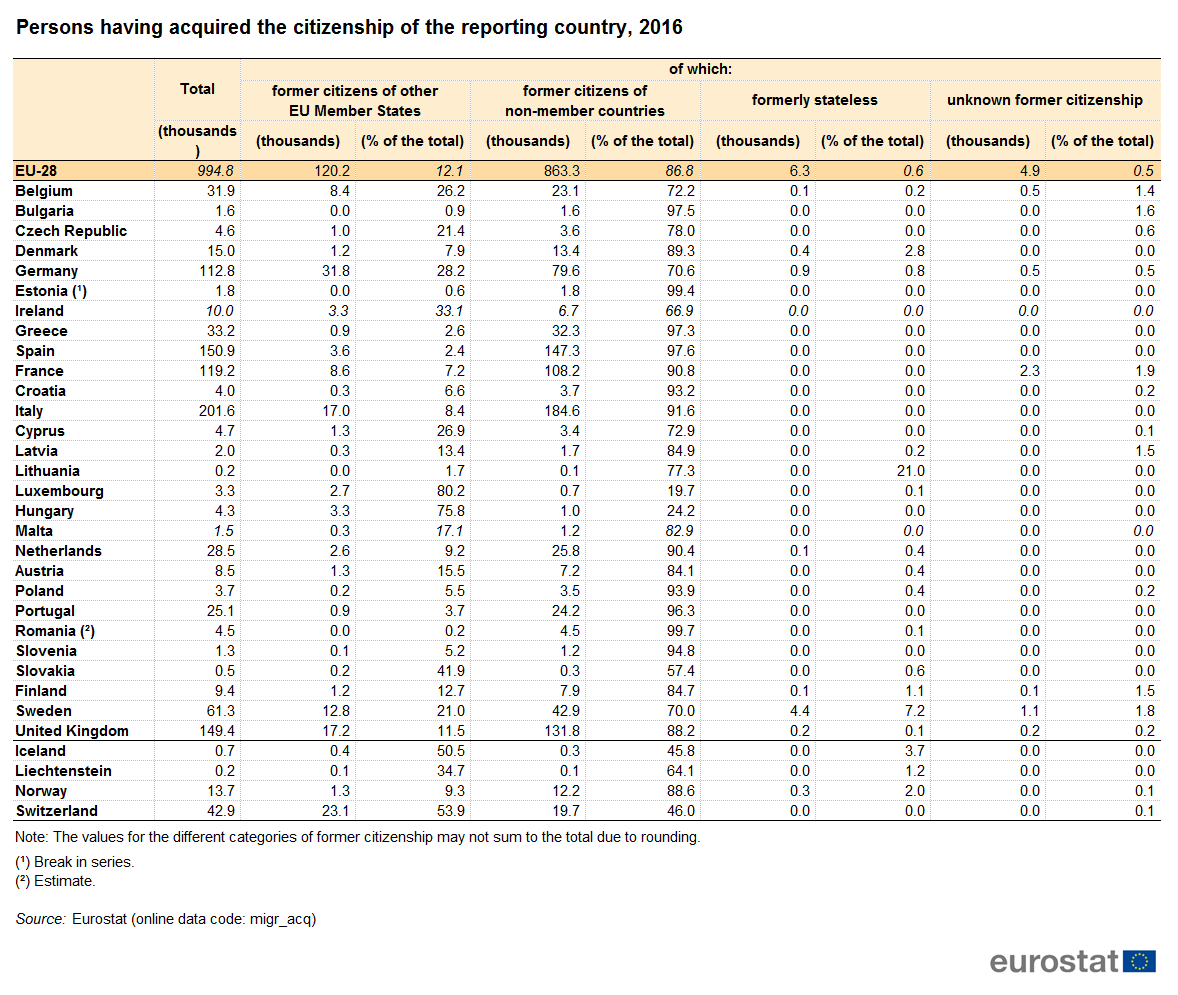
Persons having acquired the citizenship of the reporting country, 2016 .png
(
file
)
77 KB
2
10:15, 12 April 2018
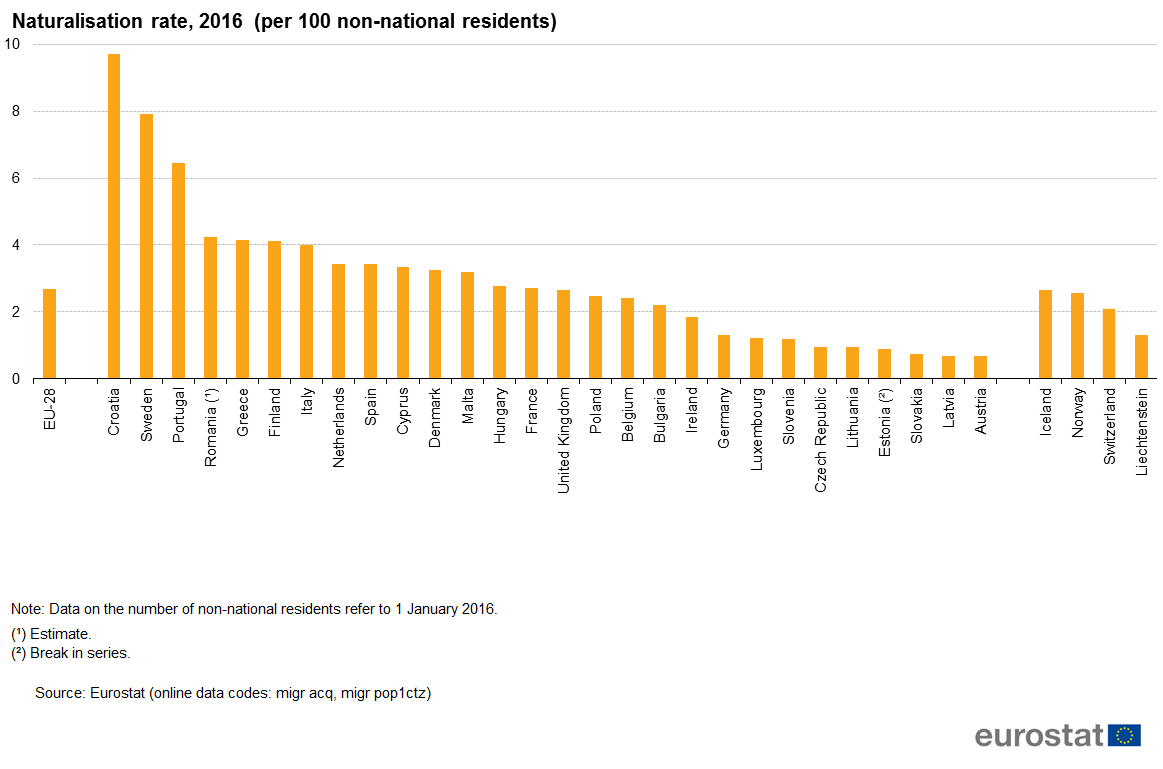
Naturalisation rate, 2016 (per 100 non-national residents).png
(
file
)
40 KB
2
13:29, 11 April 2018
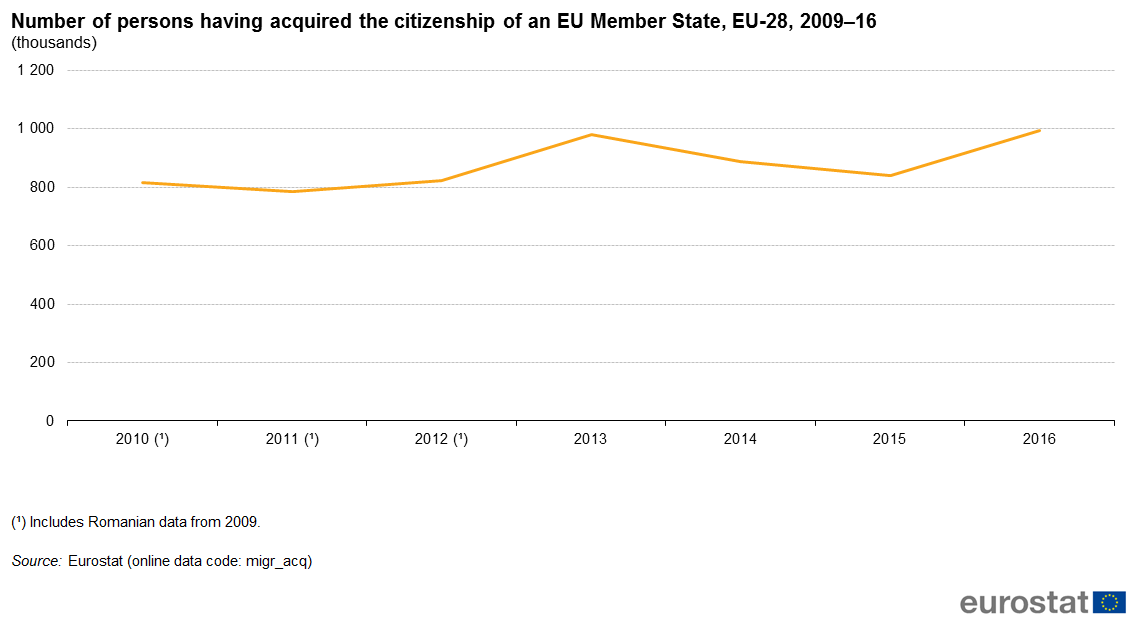
Number of persons having acquired the citizenship of an EU Member State, EU-28, 2009–16 (thousands).png
(
file
)
22 KB
2
First page
Previous page
Next page
Last page
Special page
ISSN 2443-8219


.png)
,_2017_(%25)_.png)

.png)
.png)
.png)
.png)

.png)
.png)

.png)


,_2017.png)


.png)


.png)


.png)
.png)

.png)
.png)