Tutorials
Log in
Statistics Explained
menu
search
search
Navigation
Main page
Statistical themes
Glossary
Categories
Statistics 4 beginners
Tutorials
Help
Eurostat home
Education corner
Online publications
Regional yearbook
Sustainable development
Full list
Tools
User contributions
Logs
View user groups
Special pages
search
Navigation
Main page
Statistical themes
Glossary
Categories
Statistics 4 beginners
Tutorials
Help
Eurostat home
Education corner
Online publications
Regional yearbook
Sustainable development
Full list
Tools
User contributions
Logs
View user groups
Special pages
Navigation
Main page
Statistical themes
Glossary
Categories
Statistics 4 beginners
Tutorials
Help
Eurostat home
Education corner
Online publications
Regional yearbook
Sustainable development
Full list
Tools
User contributions
Logs
View user groups
Special pages
Uploads by Wolffpa
This special page shows all uploaded files.
File list
Items per page:
20
50
100
250
500
Search for media name:
Username:
Include old versions of files
Go
First page
Previous page
Next page
Last page
Date
Name
Thumbnail
Size
Description
Versions
14:17, 10 August 2018
Culture ICT.xlsx
(
file
)
13 KB
1
11:56, 9 August 2018
Sport participation.xlsx
(
file
)
15 KB
1
17:01, 8 June 2018
Waste.xlsx
(
file
)
11 KB
1
15:19, 8 June 2018
Municipal waste.xlsx
(
file
)
11 KB
2
16:20, 31 May 2018
Health expenditure.xlsx
(
file
)
11 KB
1
15:06, 28 May 2018
Hourly labour cost.xlsx
(
file
)
11 KB
1
11:09, 28 May 2018
Asylum quarterly report.xlsx
(
file
)
12 KB
2
16:49, 1 December 2017
Resource productivity June2017 final V2.xlsx
(
file
)
81 KB
1
16:39, 1 December 2017
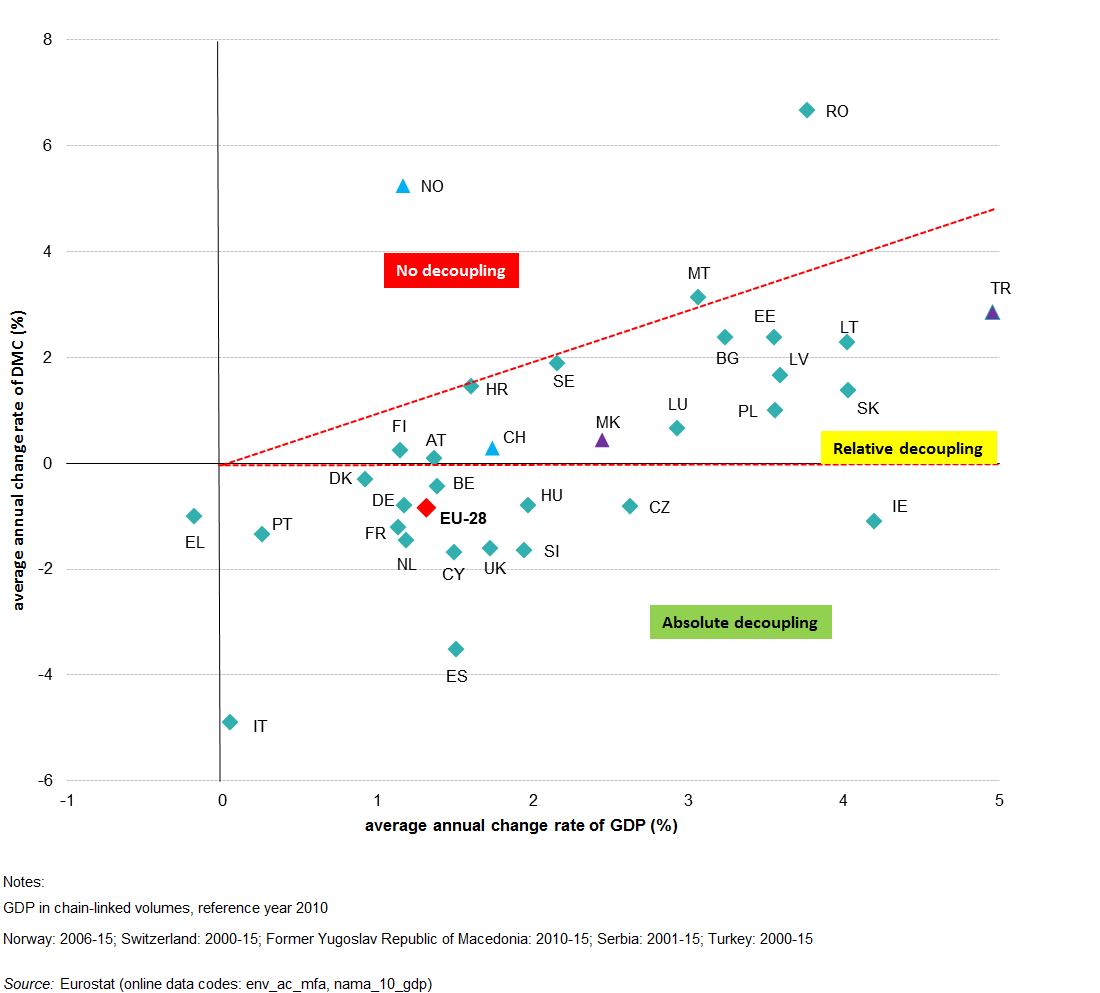
DMC and GDP - average annual change rates in EU-28 and countries between 2000 and 2016 (%)-Figure3.png
(
file
)
35 KB
1
16:34, 1 December 2017
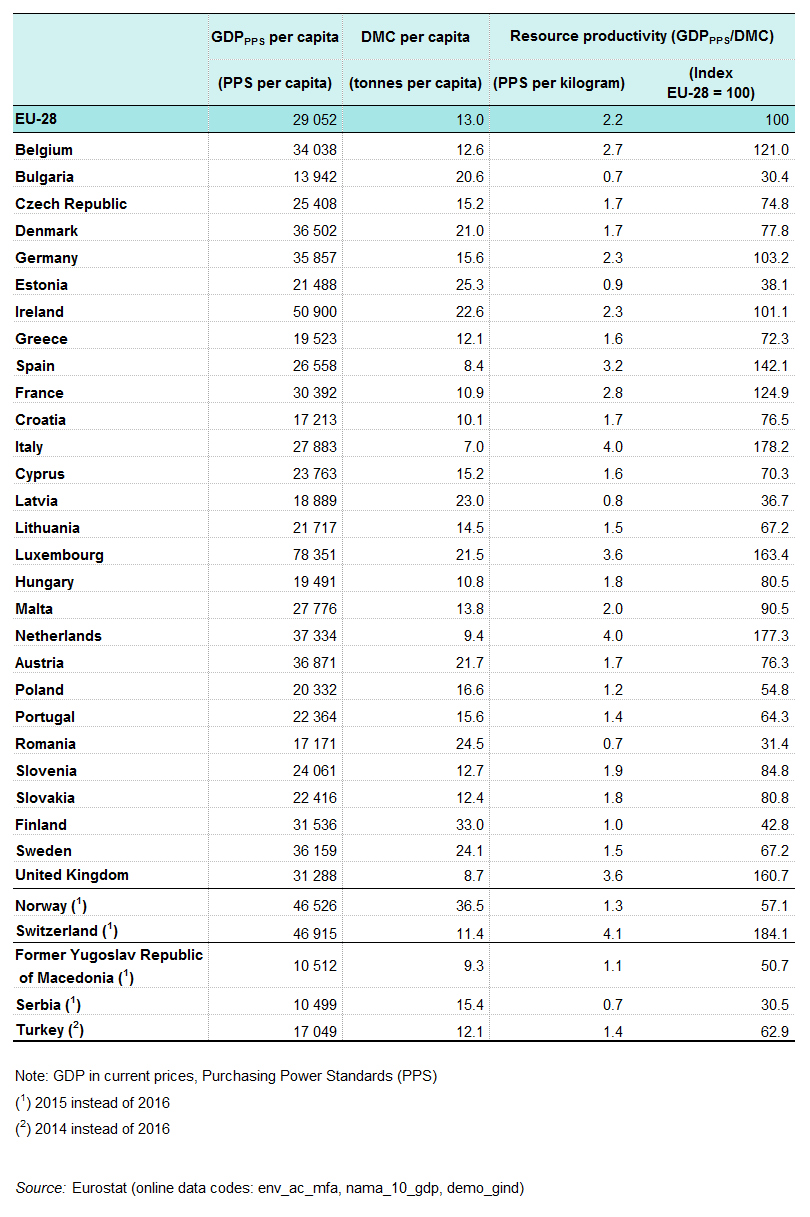
Resource productivity, GDP and DMC, by country, 2016.png
(
file
)
58 KB
1
16:29, 1 December 2017
Resource productivity - GDP DMC by country, 2000-16 (Index 2000 = 100).png
(
file
)
92 KB
1
14:52, 11 September 2017
Water statistics YB2017 V7.xlsx
(
file
)
130 KB
1
14:50, 11 September 2017
Water use in manufacturing by supply category, 2005–15 (million m³) V3.png
(
file
)
47 KB
1
14:49, 11 September 2017
Use of water by the domestic sector (households and services) — all sources, 2005–15 (m³ per inhabitant) V3.png
(
file
)
53 KB
1
14:47, 11 September 2017
Water use by economic sector — public water supply, 2015 (million m³) V3.png
(
file
)
61 KB
1
14:46, 11 September 2017
Water use by households and the manufacturing industry, from public water supply and self and other supply, 2015 (m³ per inhabitant) V3.png
(
file
)
57 KB
1
14:44, 11 September 2017
Total freshwater abstraction for public water supply, 2015 (m³ per inhabitant) V4.png
(
file
)
48 KB
1
14:40, 11 September 2017
Total freshwater abstraction for public water supply, 2015 (m³ per inhabitant) V3.png
(
file
)
51 KB
1
14:39, 11 September 2017
Groundwater and surface water abstraction, 2005–15 (million m³) V3.png
(
file
)
70 KB
1
14:37, 11 September 2017
Freshwater resources — long-term annual average (billion m³) V3.png
(
file
)
51 KB
1
14:56, 18 August 2017
Water statistics YB2017 V4.xlsx
(
file
)
130 KB
1
14:54, 18 August 2017
Water use in manufacturing by supply category, 2005–15 (million m³) V2.png
(
file
)
47 KB
1
14:53, 18 August 2017
Use of water by the domestic sector (households and services) — all sources, 2005–15 (m³ per inhabitant) V2.png
(
file
)
54 KB
1
14:52, 18 August 2017
Water use by economic sector — public water supply, 2015 (million m³) V2.png
(
file
)
57 KB
1
14:50, 18 August 2017
Water use by households and the manufacturing industry, from public water supply and self and other supply, 2015 (m³ per inhabitant) V2.png
(
file
)
53 KB
1
14:43, 18 August 2017
Total freshwater abstraction for public water supply, 2015 (m³ per inhabitant) V2.png
(
file
)
52 KB
1
14:41, 18 August 2017
Groundwater and surface water abstraction, 2005–15 (million m³) V2.png
(
file
)
72 KB
1
14:39, 18 August 2017
Freshwater resources — long-term annual average (billion m³) V2.png
(
file
)
51 KB
2
16:53, 14 August 2017
Water statistics YB2017 V3.xlsx
(
file
)
132 KB
1
16:51, 14 August 2017
Share of the population connected to urban and other wastewater treatment , selected EU Member States, 2003–15 (%) V2.png
(
file
)
41 KB
1
16:45, 14 August 2017
Sewage sludge disposal from urban wastewater treatment, by type of treatment, 2015 (% of total mass) V2.png
(
file
)
68 KB
1
15:29, 14 August 2017
Other corporations ancillary output of environmental protection services, 2014 (million EUR) V2.png
(
file
)
42 KB
1
15:27, 14 August 2017
General government and non-profit institutions serving households output of environmental protection services, 2014 (million EUR) V2.png
(
file
)
47 KB
1
15:23, 14 August 2017
National expenditure on environmental protection, EU-28, 2006–15 (million EUR and % of GDP) V2.png
(
file
)
41 KB
1
10:48, 28 July 2017
Waste statistics YB2017-2.xlsx
(
file
)
106 KB
1
10:45, 28 July 2017
Hazardous waste treatment, 2014 (kg per inhabitant)-1.png
(
file
)
54 KB
1
10:44, 28 July 2017
Hazardous waste generated, 2010 and 2014 (% share of total waste)-1.png
(
file
)
77 KB
1
16:31, 27 July 2017
Hazardous waste treatment, 2014 (thousand tonnes)-1.png
(
file
)
29 KB
1
16:29, 27 July 2017
Waste treatment, 2014-1.png
(
file
)
54 KB
1
16:27, 27 July 2017
Waste generation, excluding major mineral wastes, 2004 and 2014 (kg per inhabitant)-1.png
(
file
)
43 KB
1
16:25, 27 July 2017
Waste generation, 2014 (kg per inhabitant)-1.png
(
file
)
40 KB
1
16:23, 27 July 2017
Waste generation by economic activities and households, 2014-1.png
(
file
)
79 KB
1
14:28, 7 July 2017
Crime and criminal justice tables 2017 v2.xlsx
(
file
)
276 KB
1
14:27, 7 July 2017
Crime and criminal justice figures 2017 v2.xlsx
(
file
)
58 KB
1
14:25, 7 July 2017
Prison population, EU-28, 2008–15 (2008 = 100) V2.png
(
file
)
31 KB
1
14:24, 7 July 2017
Personnel in the criminal justice system by sex, EU-28, 2015 (% of total) V2.png
(
file
)
34 KB
1
14:22, 7 July 2017
Personnel in the criminal justice system, EU-28, 2008–15 (2008 = 100) V2.png
(
file
)
37 KB
1
14:21, 7 July 2017
Police-recorded sexual violence offences by legal status and by sex, EU-28, 2015 (% of total) V2.png
(
file
)
32 KB
1
14:19, 7 July 2017
Police-recorded sexual violence offences, EU-28, 2008–15 (2008 = 100) V2.png
(
file
)
34 KB
1
14:17, 7 July 2017
Police-recorded robbery, burglary, theft and other unlawful acts involving controlled drugs or precursors, EU-28, 2008–15 (2008 = 100) V2.png
(
file
)
32 KB
1
First page
Previous page
Next page
Last page
Special page
ISSN 2443-8219
-Figure3.png)

.png)
_V3.png)
_%E2%80%94_all_sources,_2005%E2%80%9315_(m%C2%B3_per_inhabitant)_V3.png)
_V3.png)
_V3.png)
_V4.png)
_V3.png)
_V3.png)
_V3.png)
_V2.png)
_%E2%80%94_all_sources,_2005%E2%80%9315_(m%C2%B3_per_inhabitant)_V2.png)
_V2.png)
_V2.png)
_V2.png)
_V2.png)
_V2.png)
_V2.png)
_V2.png)
_V2.png)
_V2.png)
_V2.png)
-1.png)
-1.png)
-1.png)

-1.png)
-1.png)

_V2.png)
_V2.png)
_V2.png)
_V2.png)
_V2.png)
_V2.png)