Tutorials
Log in
Statistics Explained
menu
search
search
Navigation
Main page
Statistical themes
Glossary
Categories
Statistics 4 beginners
Tutorials
Help
Eurostat home
Education corner
Online publications
Regional yearbook
Sustainable development
Full list
Tools
User contributions
Logs
View user groups
Special pages
search
Navigation
Main page
Statistical themes
Glossary
Categories
Statistics 4 beginners
Tutorials
Help
Eurostat home
Education corner
Online publications
Regional yearbook
Sustainable development
Full list
Tools
User contributions
Logs
View user groups
Special pages
Navigation
Main page
Statistical themes
Glossary
Categories
Statistics 4 beginners
Tutorials
Help
Eurostat home
Education corner
Online publications
Regional yearbook
Sustainable development
Full list
Tools
User contributions
Logs
View user groups
Special pages
Uploads by Whelminger
This special page shows all uploaded files.
File list
Items per page:
20
50
100
250
500
Search for media name:
Username:
Include old versions of files
Go
First page
Previous page
Next page
Last page
Date
Name
Thumbnail
Size
Description
Versions
17:00, 27 January 2017
Children AROPE 2016.xlsx
(
file
)
633 KB
2
16:59, 27 January 2017
Children at risk of poverty rate, by country of birth of their parents, 2015.png
(
file
)
24 KB
2
13:02, 27 January 2017
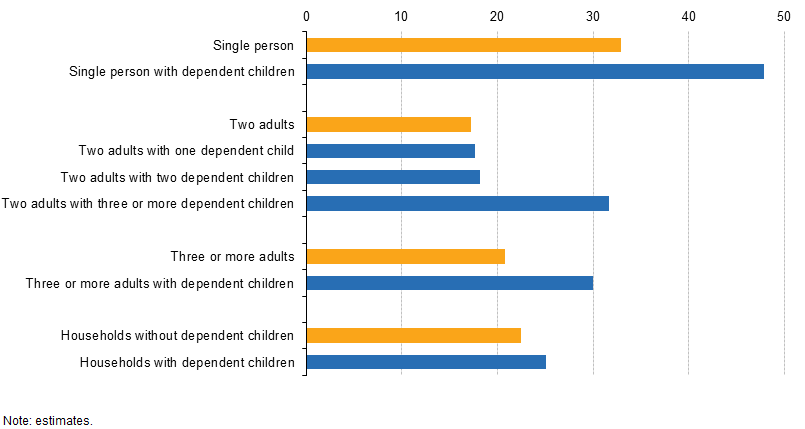
Severe material deprivation rate, by household type, EU-28, 2015.png
(
file
)
16 KB
1
12:58, 27 January 2017
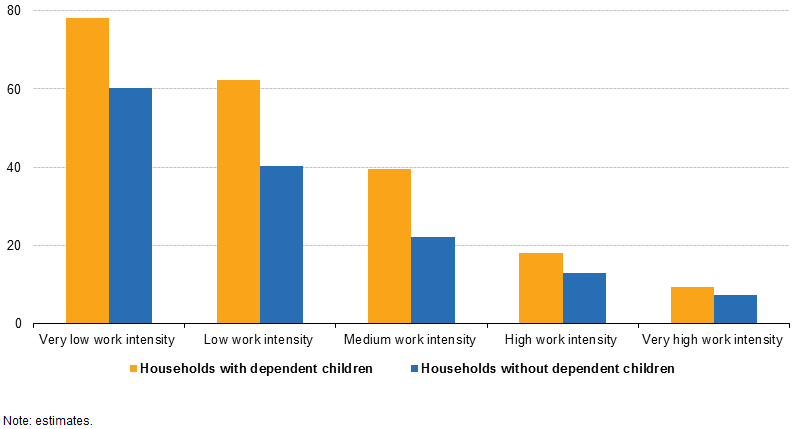
Population aged 0–59 at risk of poverty or social exclusion, by work intensity of the household, EU-28, 2015.png
(
file
)
12 KB
1
12:58, 27 January 2017
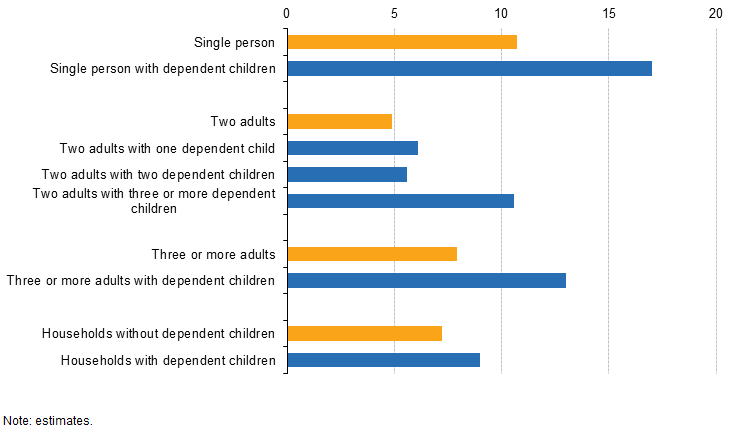
Population at risk of poverty or social exclusion, by household type, EU-28, 2015.png
(
file
)
16 KB
1
16:06, 16 December 2016
Forests forestry and logging statistics 2016-3.xlsx
(
file
)
88 KB
1
12:23, 13 December 2016
Accounts and prices 2016.xlsx
(
file
)
223 KB
2
12:21, 13 December 2016
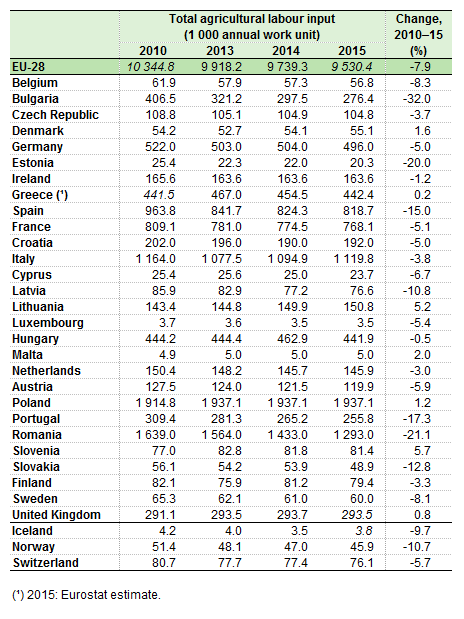
Agricultural labour input, 2010 and 2013–15.png
(
file
)
34 KB
2
11:42, 13 December 2016
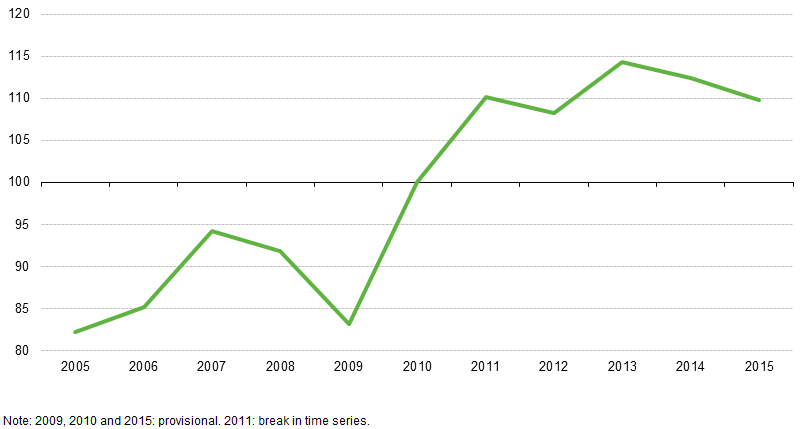
Agricultural income per AWU (Indicator A), EU-28, 2005–15.png
(
file
)
13 KB
1
11:14, 13 December 2016
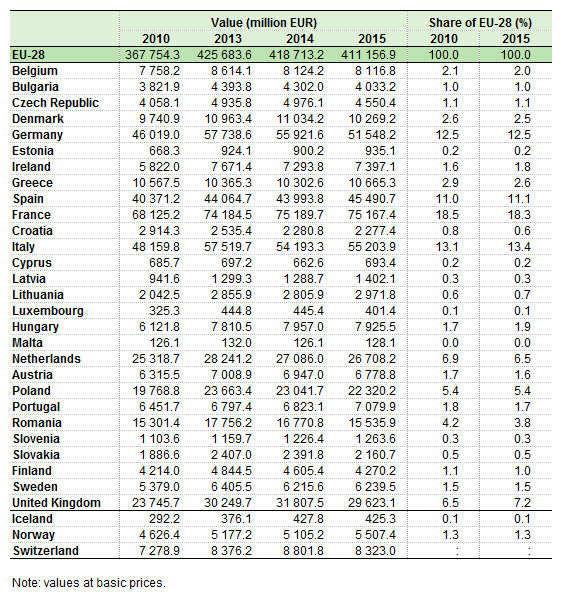
Output value of the agricultural industry, 2010 and 2013–15.png
(
file
)
41 KB
2
11:12, 13 December 2016
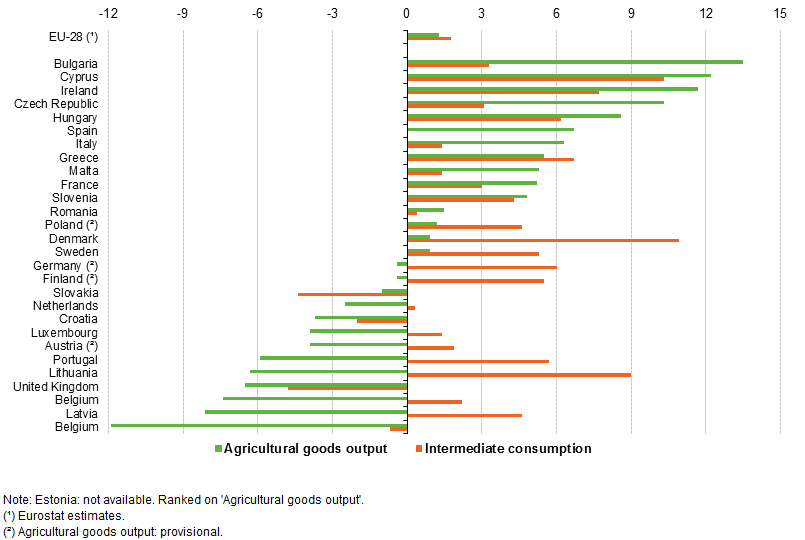
Change in deflated price indices for the agricultural industry, 2010–15.png
(
file
)
27 KB
1
11:09, 13 December 2016
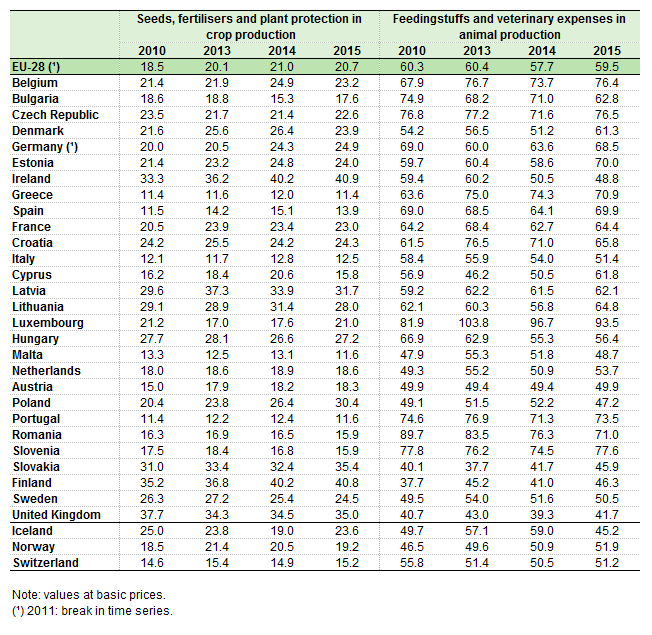
Share of main intermediate inputs in crop and animal production, 2010 and 2013–15.png
(
file
)
43 KB
1
15:56, 5 December 2016
Pollution risks 2016 SE.xls
(
file
)
319 KB
1
15:55, 5 December 2016
Share of the different phosphorus outputs in total phosphorus outputs, average 2009–14.png
(
file
)
43 KB
1
15:54, 5 December 2016
Share of the different nitrogen outputs in total nitrogen outputs, average 2009–14.png
(
file
)
43 KB
1
15:54, 5 December 2016
Share of different livestock in manure phosphorus production, average 2009–14.png
(
file
)
42 KB
1
15:53, 5 December 2016
Share of different livestock in manure nitrogen production, average 2009–14.png
(
file
)
42 KB
1
15:52, 5 December 2016
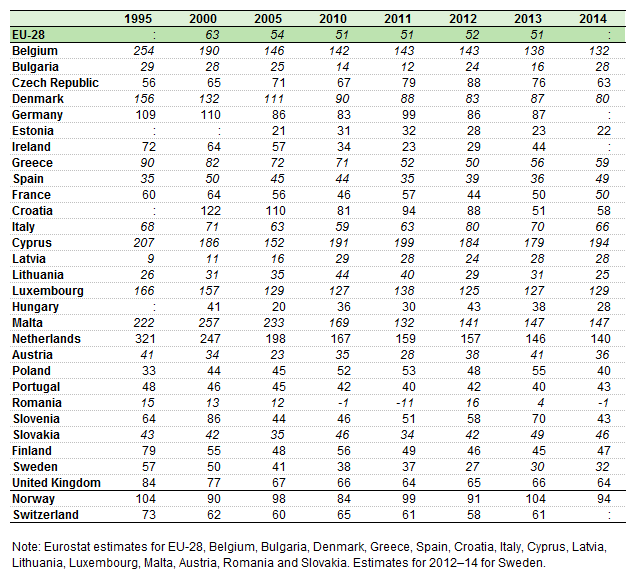
Gross phosphorus balance, 1995, 2000, 2005 and 2010–14.png
(
file
)
28 KB
1
15:51, 5 December 2016
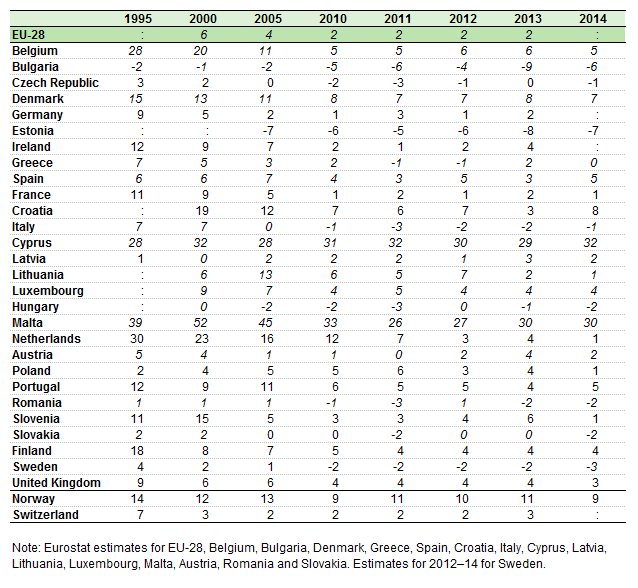
Gross nitrogen balance, 1995, 2000, 2005 and 2010–14.png
(
file
)
34 KB
1
15:30, 16 November 2016
Biodiversity 2016.xlsx
(
file
)
95 KB
1
15:29, 16 November 2016
Compound annual rate of change of the common farmland bird index.png
(
file
)
44 KB
1
15:28, 16 November 2016
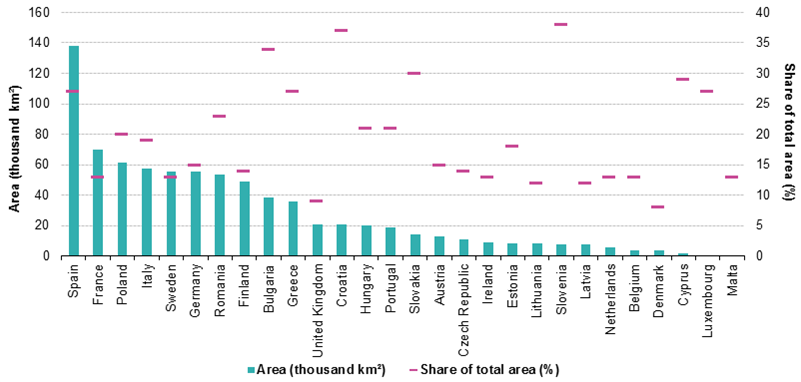
Natura 2000 protected terrestrial area, 2015.png
(
file
)
50 KB
1
13:06, 9 November 2016
Forestry statistics 2016.xlsx
(
file
)
203 KB
5
13:05, 9 November 2016
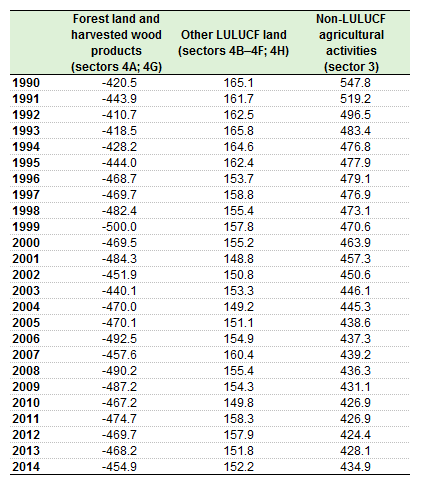
Greenhouse gas emissions and removals by LULUCF and agricultural source sectors (table), EU-28, 1990–2014.png
(
file
)
21 KB
1
13:00, 9 November 2016
FLEGT countries' share in total wood imports to the EU-28, 2000–14.png
(
file
)
17 KB
1
13:00, 9 November 2016
FLEGT countries' share in tropical wood imports to the EU-28, 2000–14.png
(
file
)
16 KB
1
13:00, 9 November 2016
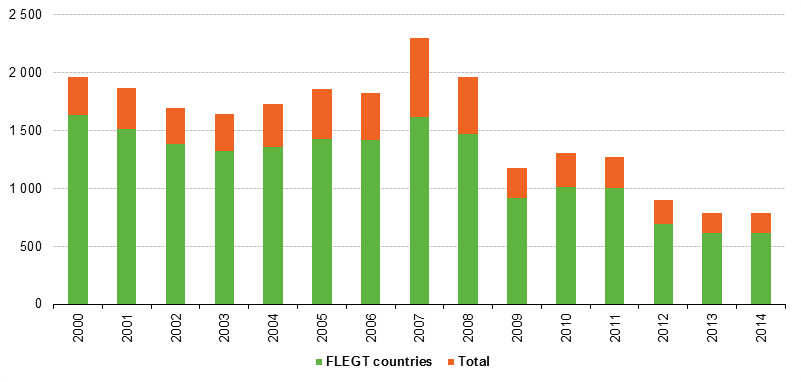
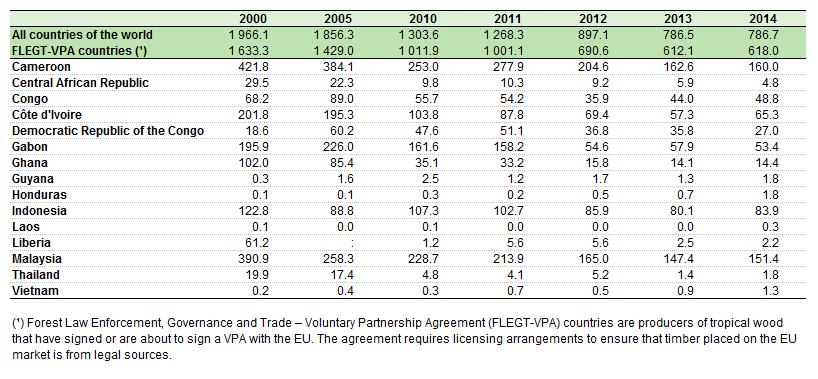
Tropical wood imports, EU-28, 2000–14.png
(
file
)
28 KB
1
12:59, 9 November 2016
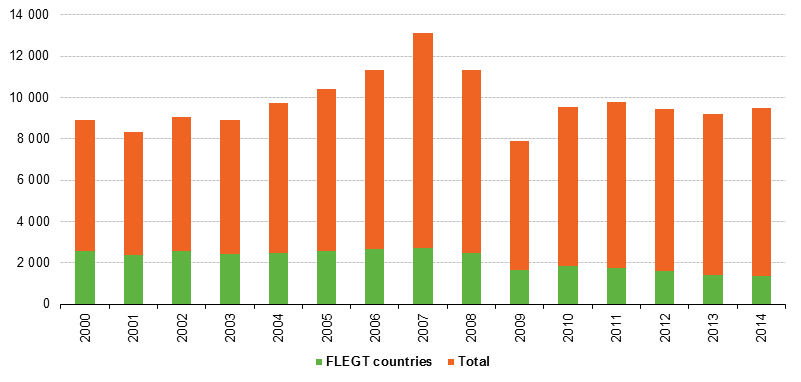
Total wood imports to the EU and the share of FLEGT countries, EU-28, 2000–14.png
(
file
)
29 KB
1
12:58, 9 November 2016
Main indicators for wood-based industries, EU-28, 2005 and 2013.png
(
file
)
20 KB
1
12:58, 9 November 2016
Employment in forestry and logging, 2005 and 2013.png
(
file
)
47 KB
3
12:57, 9 November 2016
Forestry and logging value added per forest area available for wood supply, 2005 and 2013.png
(
file
)
23 KB
1
12:56, 9 November 2016
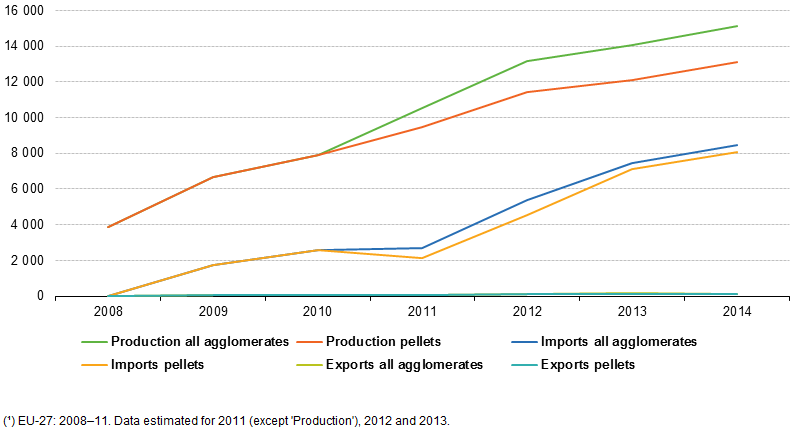
Production and trade in wood pellets and other agglomerates, EU-28, 2008–14.png
(
file
)
19 KB
1
12:55, 9 November 2016
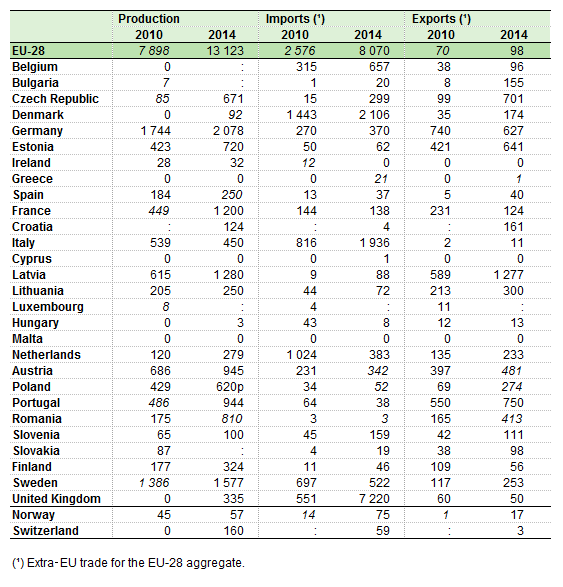
Production and trade in wood pellets, 2010 and 2014.png
(
file
)
32 KB
1
12:55, 9 November 2016
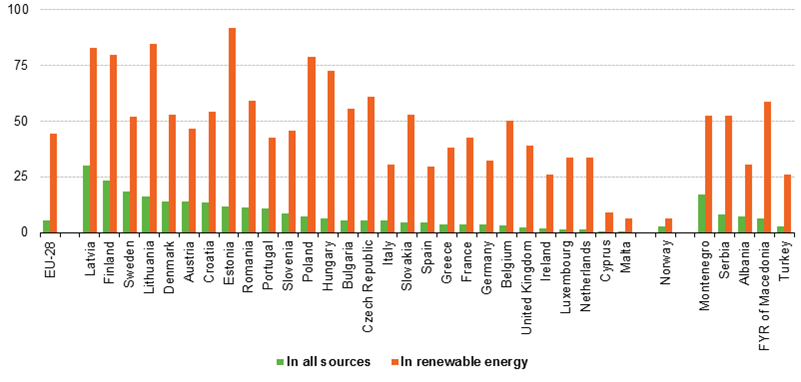
Wood as a source of energy, 2014.png
(
file
)
49 KB
1
12:54, 9 November 2016
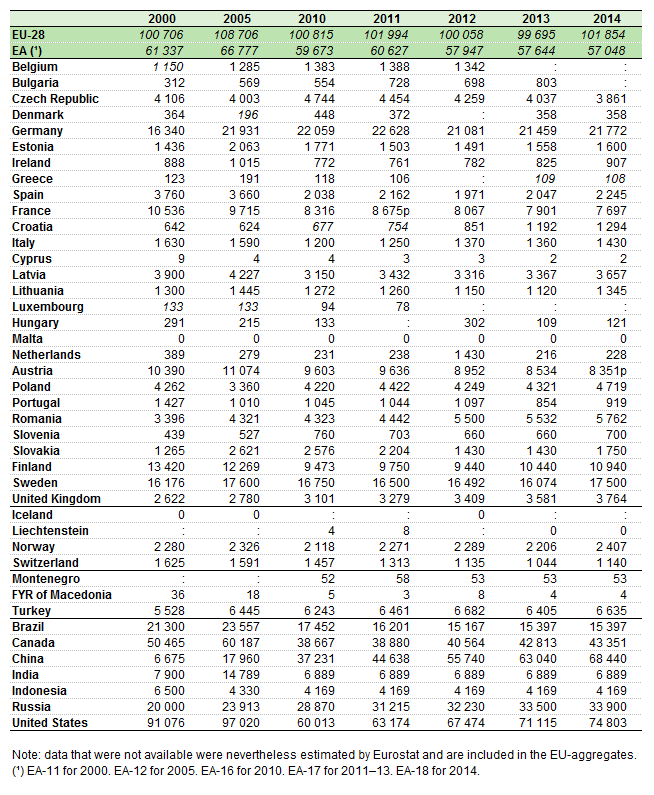
Sawnwood production, 2000–14.png
(
file
)
52 KB
1
12:53, 9 November 2016
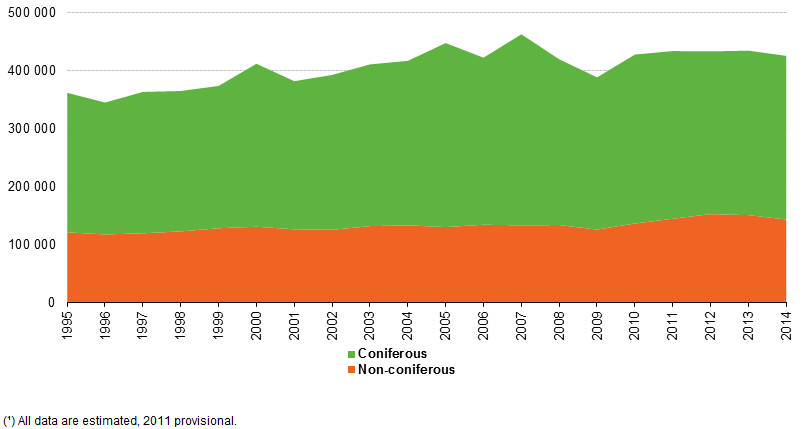
Annual production of roundwood, EU-28, 1995–2014.png
(
file
)
11 KB
1
12:53, 9 November 2016
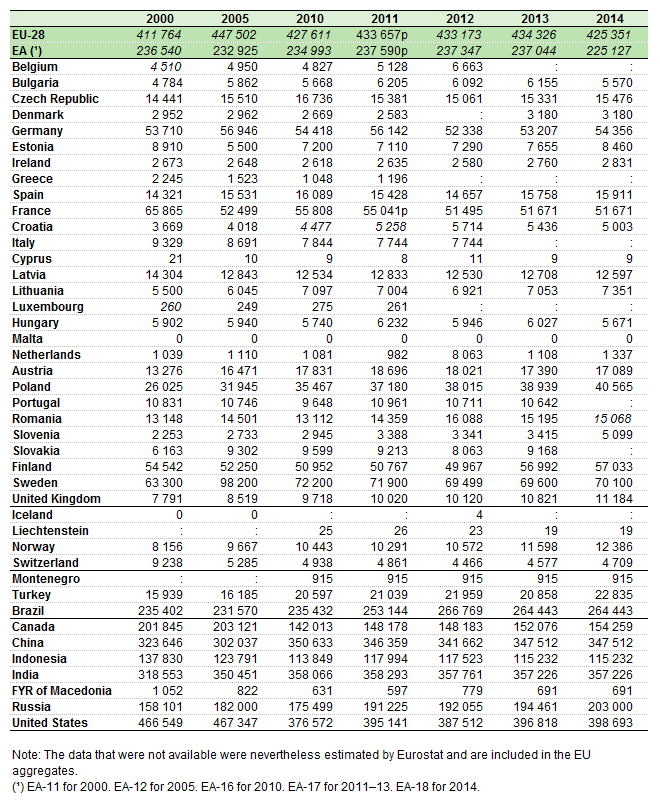
Roundwood production, 2000–14.png
(
file
)
57 KB
1
15:24, 28 October 2016
Statistics on employment conditions 2016.xlsx
(
file
)
159 KB
1
15:04, 28 October 2016
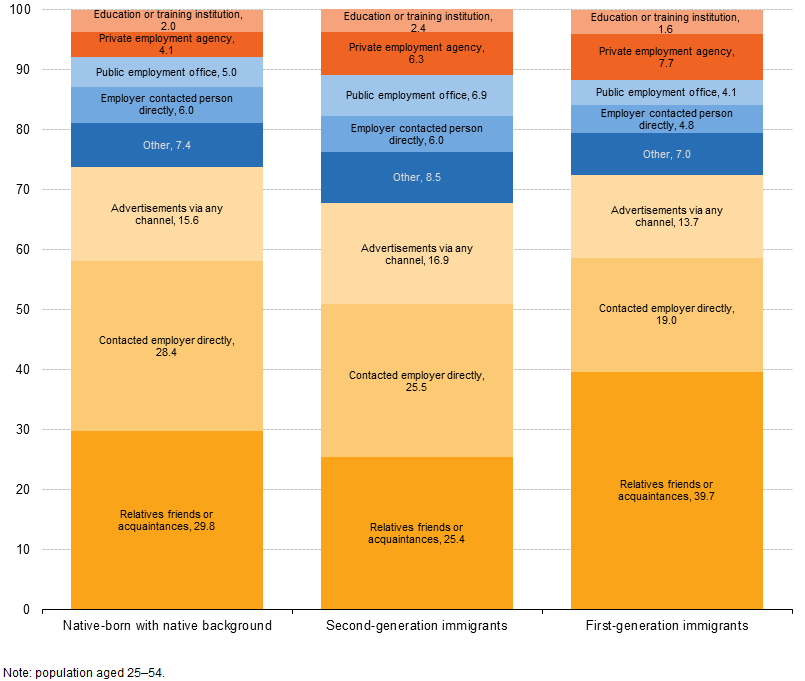
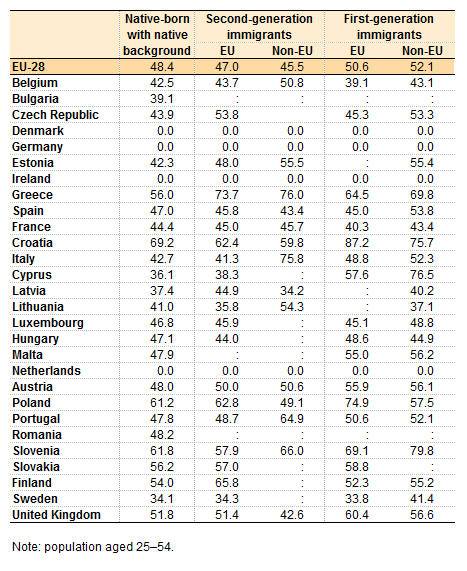
Method to find a job by migration status, 2014.png
(
file
)
35 KB
1
15:04, 28 October 2016
Atypical working time by migration status and origin, 2014.png
(
file
)
28 KB
1
15:03, 28 October 2016
Atypical working time by migration status, sex and origin, EU, 2008 and 2014.png
(
file
)
18 KB
1
15:03, 28 October 2016
Part-time employment, by origin, 2014.png
(
file
)
24 KB
1
15:03, 28 October 2016
Part-time employment by migration status, sex and origin, EU, 2008 and 2014.png
(
file
)
16 KB
1
15:02, 28 October 2016
Employees with temporary contracts, by origin, 2014.png
(
file
)
24 KB
1
15:02, 28 October 2016
Temporary contract by migration status and origin, 2008 and 2014.png
(
file
)
12 KB
1
15:02, 28 October 2016
Self-employment, by origin, 2014.png
(
file
)
25 KB
1
15:02, 28 October 2016
Self-employment by migration status and origin, EU, 2008 and 2014.png
(
file
)
14 KB
1
15:01, 28 October 2016
Top three activities of first-generation immigrant employees, 2014.png
(
file
)
46 KB
1
15:01, 28 October 2016
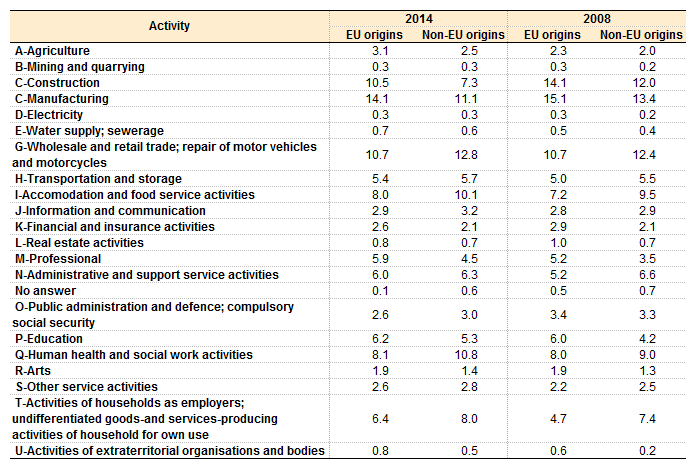
Main activity sectors of first-generation immigrant employees by origin, EU, 2014 and 2008.png
(
file
)
30 KB
1
14:55, 28 October 2016
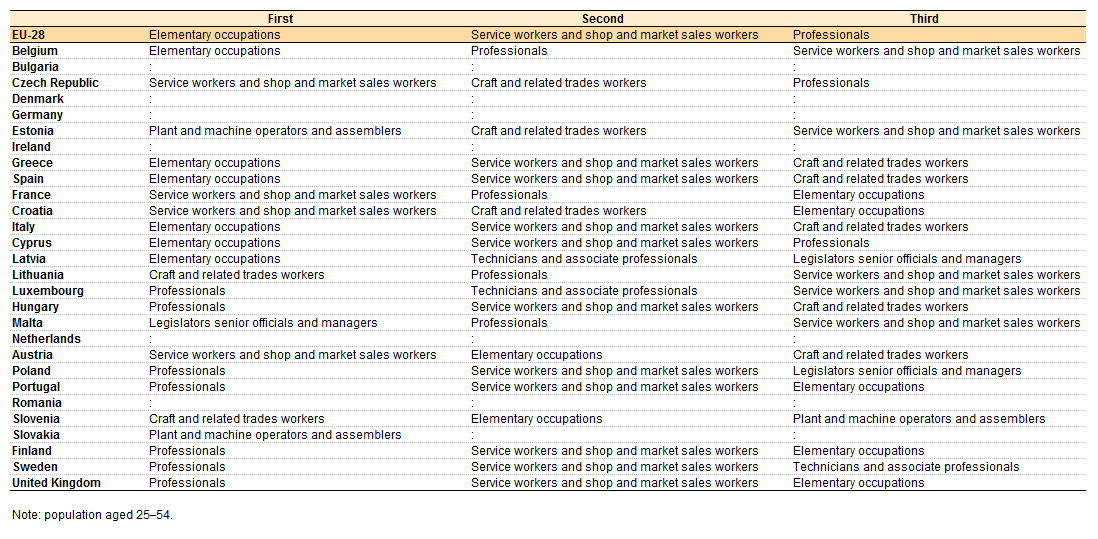
Top three occupational groups of first-generation immigrant employees, 2014.png
(
file
)
55 KB
1
First page
Previous page
Next page
Last page
Special page
ISSN 2443-8219


,_EU-28,_2005%E2%80%9315.png)


,_EU-28,_1990%E2%80%932014.png)


