Tutorials
Log in
Statistics Explained
menu
search
search
Navigation
Main page
Statistical themes
Glossary
Categories
Statistics 4 beginners
Tutorials
Help
Eurostat home
Education corner
Online publications
Regional yearbook
Sustainable development
Full list
Tools
User contributions
Logs
View user groups
Special pages
search
Navigation
Main page
Statistical themes
Glossary
Categories
Statistics 4 beginners
Tutorials
Help
Eurostat home
Education corner
Online publications
Regional yearbook
Sustainable development
Full list
Tools
User contributions
Logs
View user groups
Special pages
Navigation
Main page
Statistical themes
Glossary
Categories
Statistics 4 beginners
Tutorials
Help
Eurostat home
Education corner
Online publications
Regional yearbook
Sustainable development
Full list
Tools
User contributions
Logs
View user groups
Special pages
Uploads by Xiangho
This special page shows all uploaded files.
File list
Items per page:
20
50
100
250
500
Search for media name:
Username:
Include old versions of files
Go
Date
Name
Thumbnail
Size
Description
Versions
15:08, 18 December 2017
Figures for statistics explained on globalisation indicators for industry and wholesale and retail trade update Dec. 2017.xlsx
(
file
)
336 KB
1
12:28, 18 December 2017
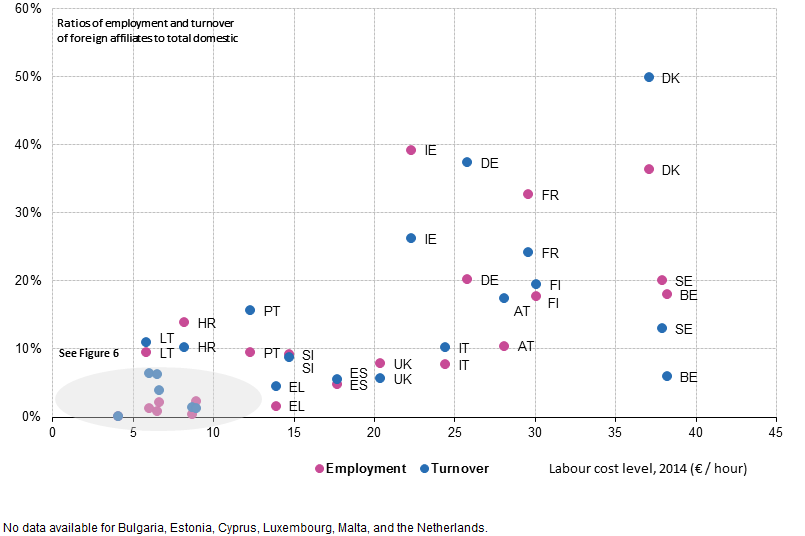
Labour cost levels compared with the ratio of employment and turnover of foreign affiliates to total employment and turnover in wholesale and retail trade in 2014.png
(
file
)
31 KB
3
12:19, 18 December 2017
Labour cost levels compared with the ratio of employment and turnover of foreign affiliates to total employment and turnover in wholesale and retail trade in 2014 detailed.png
(
file
)
22 KB
1
12:18, 18 December 2017
Labour cost levels compared with the ratio of employment and turnover of foreign affiliates to total employment and turnover in industry in 2014 detailed.png
(
file
)
24 KB
1
12:18, 18 December 2017
Labour cost levels compared with the ratio of employment and turnover of foreign affiliates to total employment and turnover in industry in 2014.png
(
file
)
34 KB
1
12:11, 18 December 2017
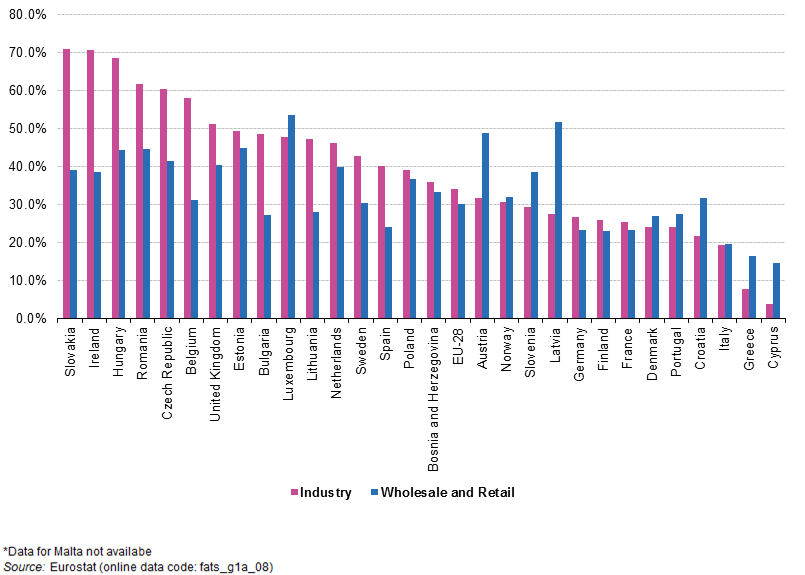
Proportion of turnover of foreign controlled enterprises in total turnover in industry, and wholesale and retail trade, in 2014.png
(
file
)
45 KB
1
12:10, 18 December 2017
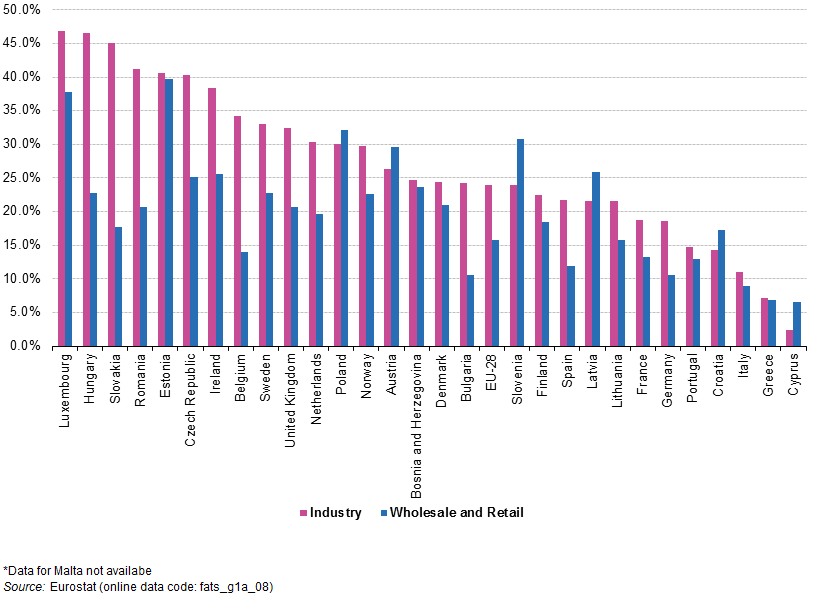
Proportion of employment of foreign controlled enterprises in total employment in industry, and wholesale and retail trade, in 2014.png
(
file
)
43 KB
1
12:04, 18 December 2017
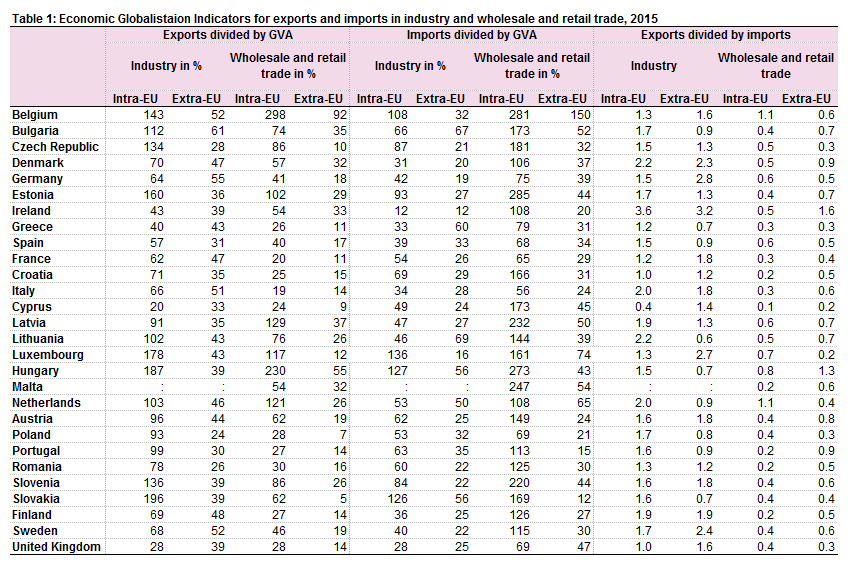
Economic Globalistaion Indicators for exports and imports in industry and wholesale and retail trade, 2015.png
(
file
)
43 KB
1
12:45, 8 November 2017
Employment shares of foreign controlled enterprises (world except reporting country) in total domestic employment by country, 2014.png
(
file
)
25 KB
2
12:38, 8 November 2017
Figures update 2017 - international trade investment update 08 11 2017.xlsx
(
file
)
149 KB
1
12:32, 8 November 2017
Inward and outward foreign direct investment stocks relative to the rest of the world as a percentage of GDP, EU-28, 2008-2015.png
(
file
)
33 KB
2
12:31, 8 November 2017
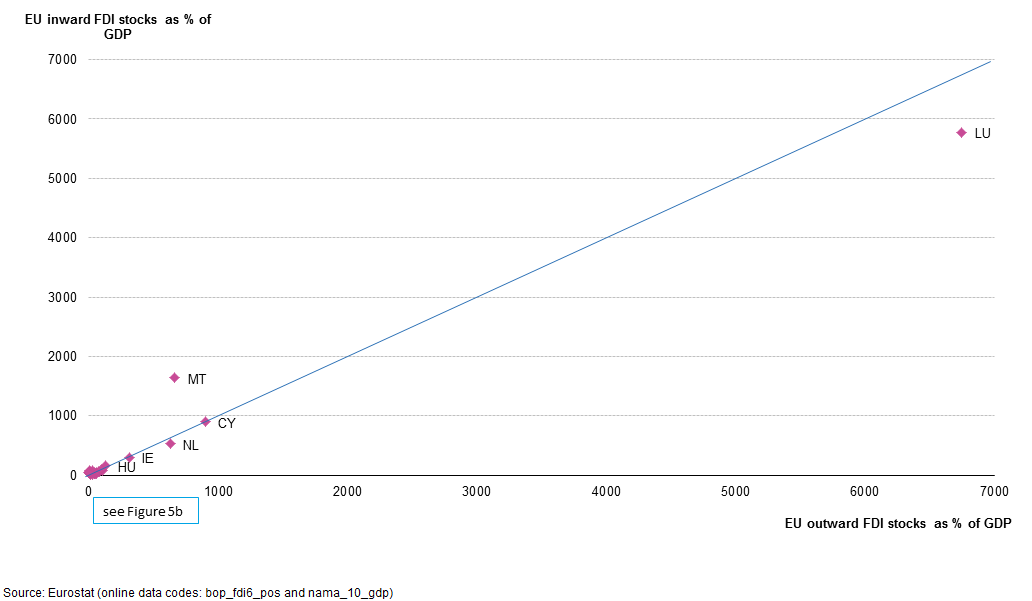
Inward and outward foreign direct investment by Member State, in percentage of GDP, 2015b.png
(
file
)
19 KB
1
12:29, 8 November 2017
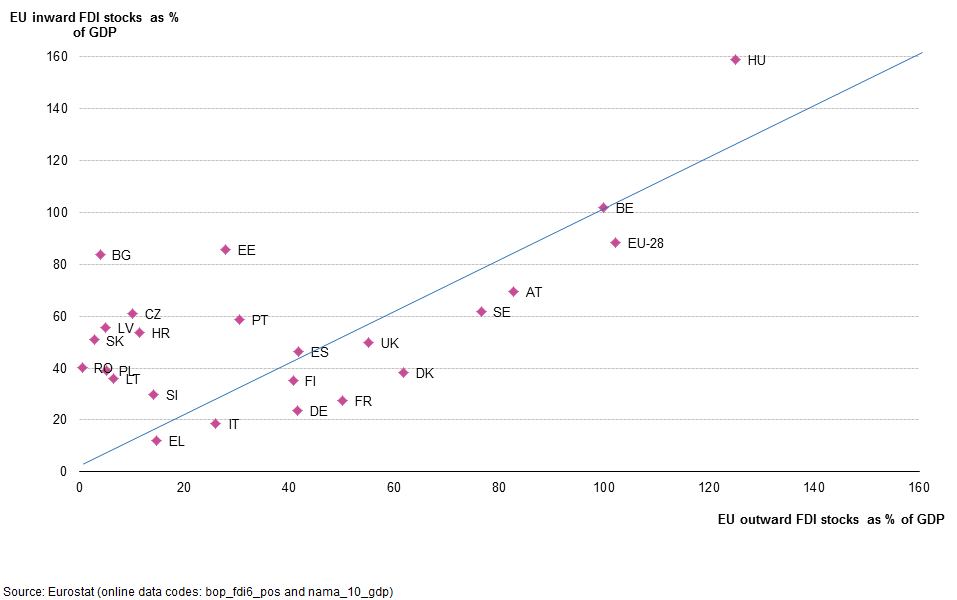
Inward and outward foreign direct investment by Member State, in percentage of GDP, 2015.png
(
file
)
19 KB
1
12:28, 8 November 2017
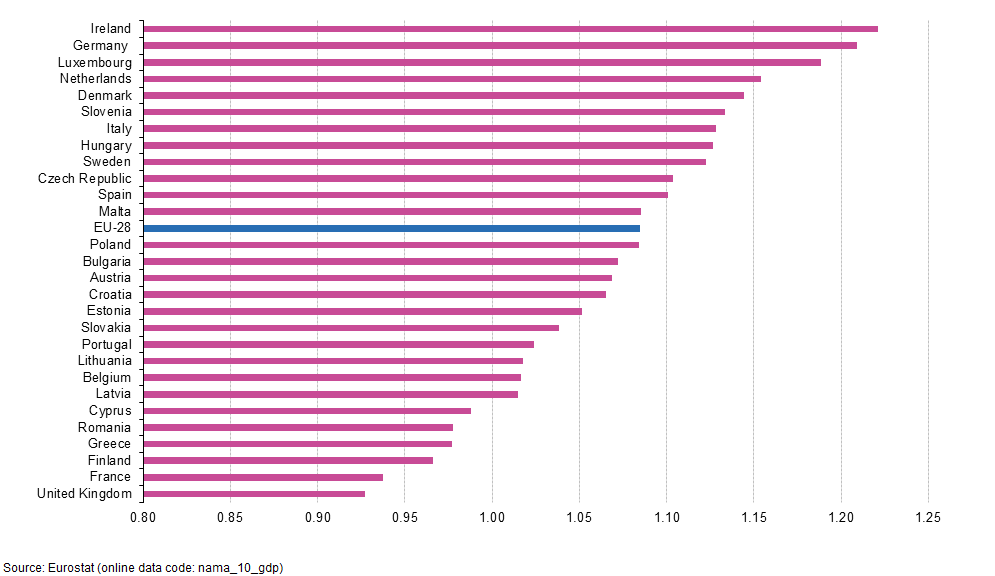
Export to import ratio by country, 2016.png
(
file
)
26 KB
1
12:26, 8 November 2017
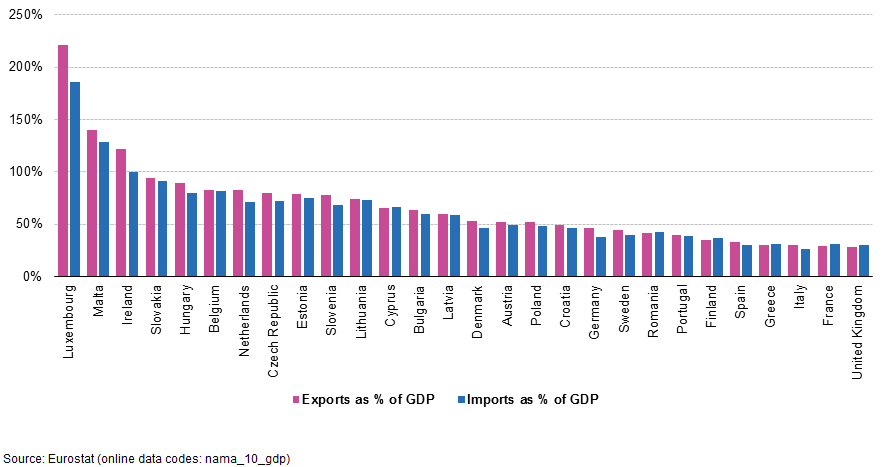
Imports and exports in percentage of GDP by country, 2016.png
(
file
)
25 KB
2
16:17, 7 November 2017
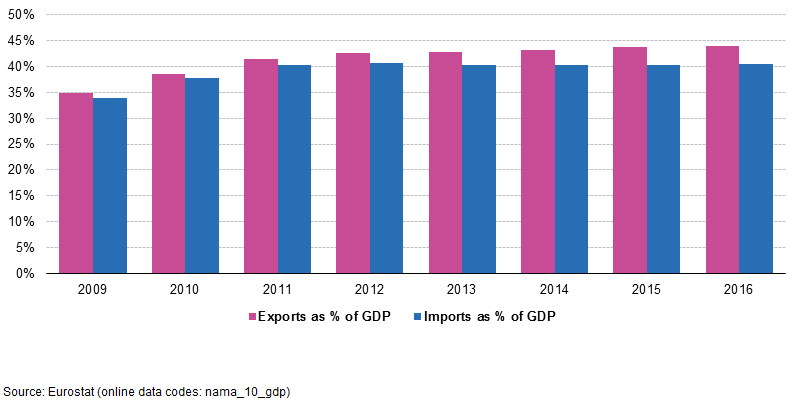
EU-28 imports and exports in percentage of GDP by year, 2009-2016 new.png
(
file
)
20 KB
1
16:09, 7 November 2017
EU-28 imports and exports in percentage of GDP by year, 2009-2016.png
(
file
)
20 KB
2
Special page
ISSN 2443-8219


_in_total_domestic_employment_by_country,_2014.png)


