Tutorials
Log in
Statistics Explained
menu
search
search
Navigation
Main page
Statistical themes
Glossary
Categories
Statistics 4 beginners
Tutorials
Help
Eurostat home
Education corner
Online publications
Regional yearbook
Sustainable development
Full list
Tools
User contributions
Logs
View user groups
Special pages
search
Navigation
Main page
Statistical themes
Glossary
Categories
Statistics 4 beginners
Tutorials
Help
Eurostat home
Education corner
Online publications
Regional yearbook
Sustainable development
Full list
Tools
User contributions
Logs
View user groups
Special pages
Navigation
Main page
Statistical themes
Glossary
Categories
Statistics 4 beginners
Tutorials
Help
Eurostat home
Education corner
Online publications
Regional yearbook
Sustainable development
Full list
Tools
User contributions
Logs
View user groups
Special pages
Uploads by Sunjkni
This special page shows all uploaded files.
File list
Items per page:
20
50
100
250
500
Search for media name:
Username:
Include old versions of files
Go
First page
Previous page
Next page
Last page
Date
Name
Thumbnail
Size
Description
Versions
15:21, 17 April 2024
Figures and tables - EGI article v1.4.xlsx
(
file
)
240 KB
1
15:20, 17 April 2024
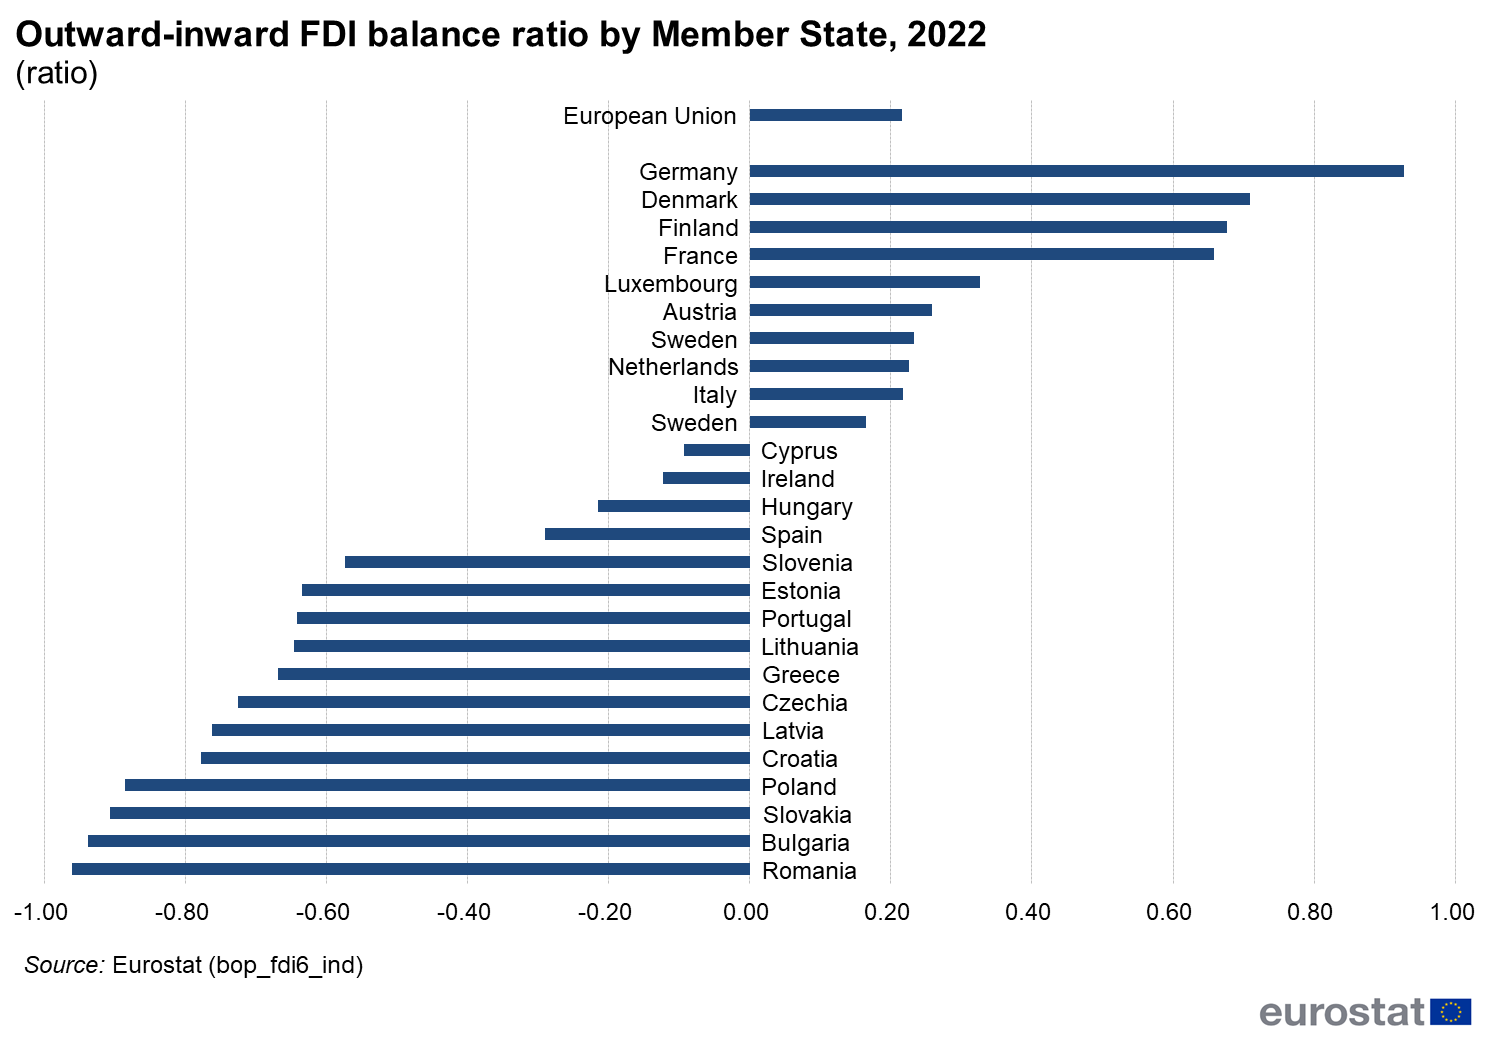
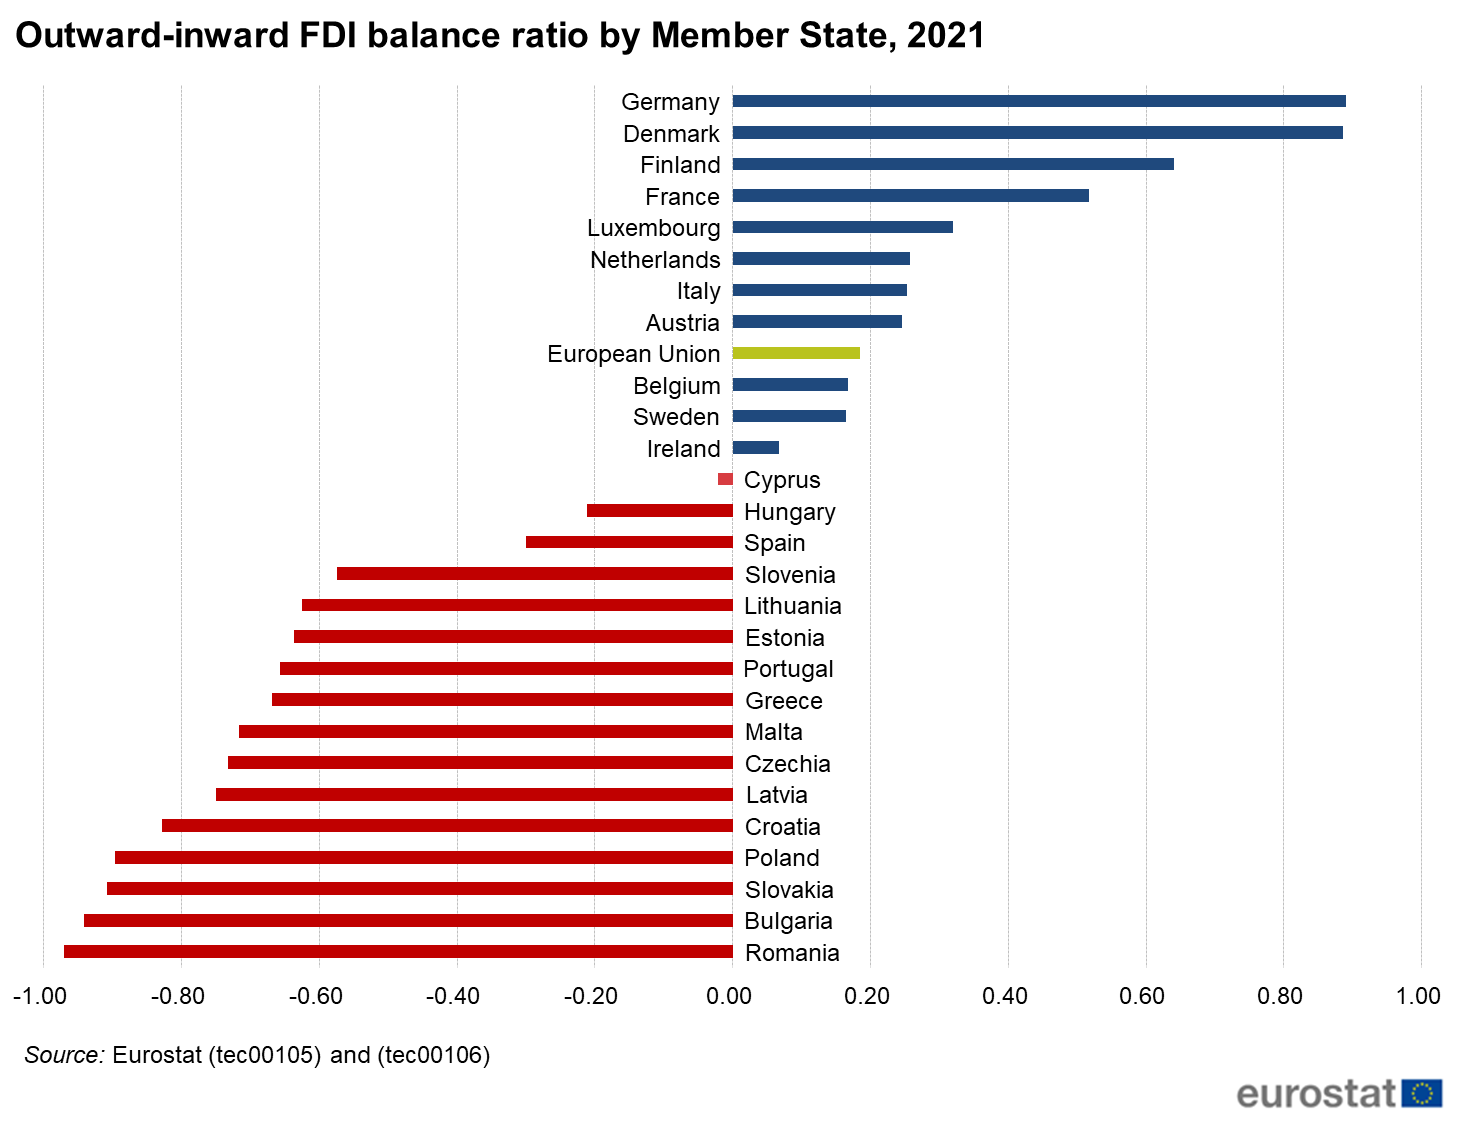
12 - Outward-inward FDI balance ratio by Member State.png
(
file
)
75 KB
3
16:22, 16 April 2024
Figures and tables - EGI article v1.2.xlsx
(
file
)
240 KB
1
16:22, 16 April 2024
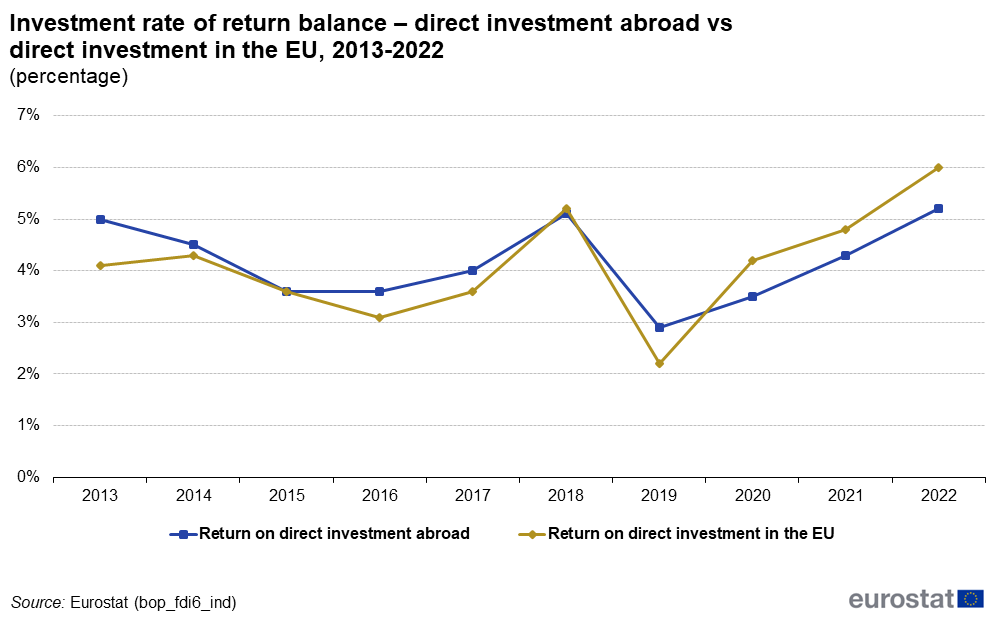
13 - Investment rate of return balance - direct investment abroad vs direct investment in the EU.png
(
file
)
32 KB
2
16:21, 16 April 2024
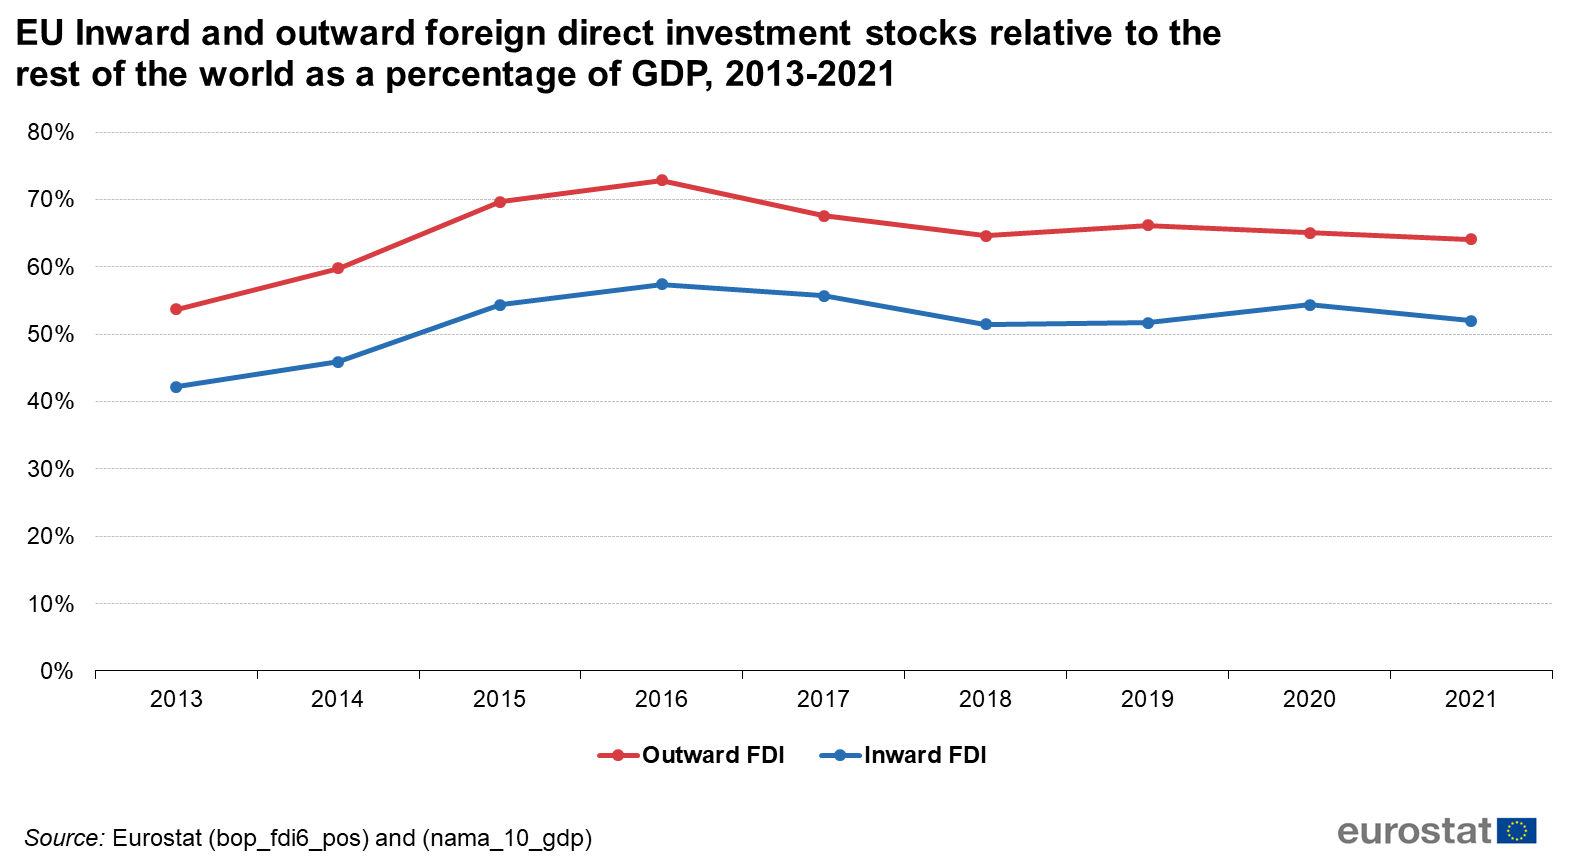
11 - EU Inward and outward foreign direct investment stocks relative to the rest of the world as a percentage of GDP.png
(
file
)
30 KB
2
16:21, 16 April 2024
10 - Export vs imports of goods in euro by country.png
(
file
)
66 KB
2
16:21, 16 April 2024
9 - Trade with top 5 partners in goods vs in services.png
(
file
)
25 KB
2
16:21, 16 April 2024
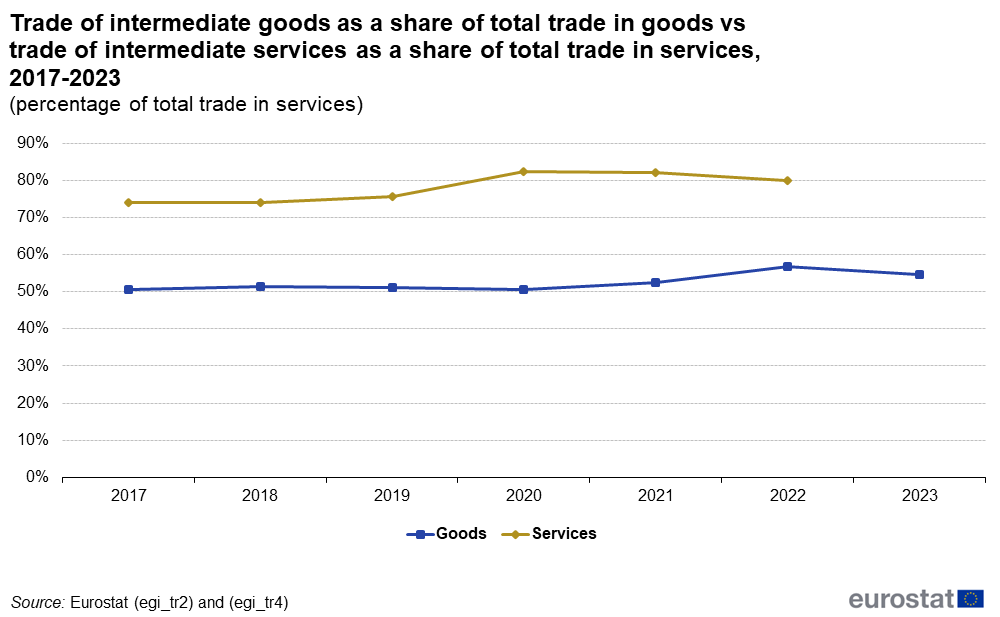
8 - Trade of intermediate goods as a share of total trade in goods vs trade of intermediate services as a share of total trade in services.png
(
file
)
27 KB
2
16:20, 16 April 2024
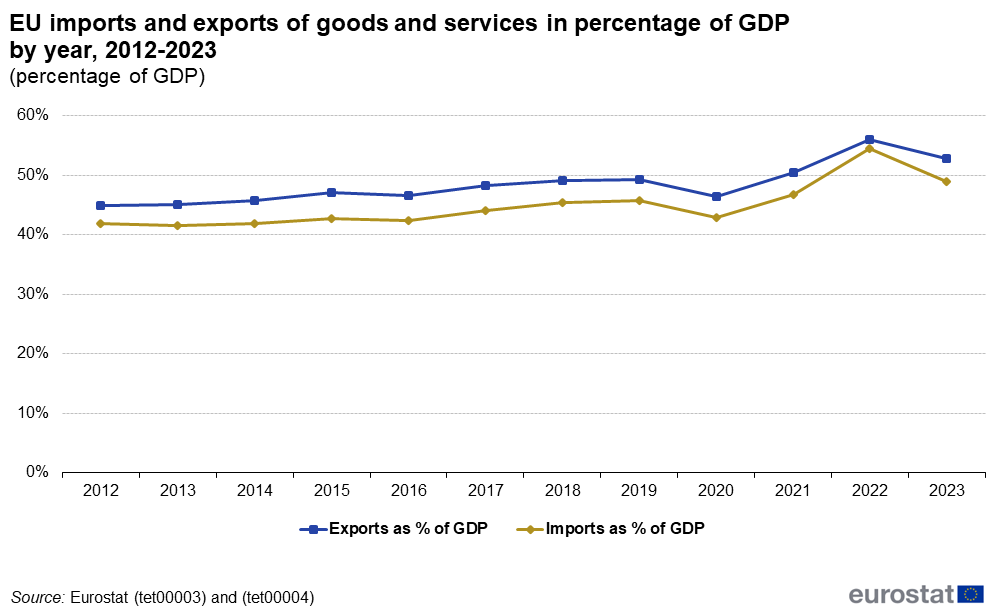
7 - EU imports and exports of goods and services in percentage of GDP by year.png
(
file
)
28 KB
2
16:20, 16 April 2024
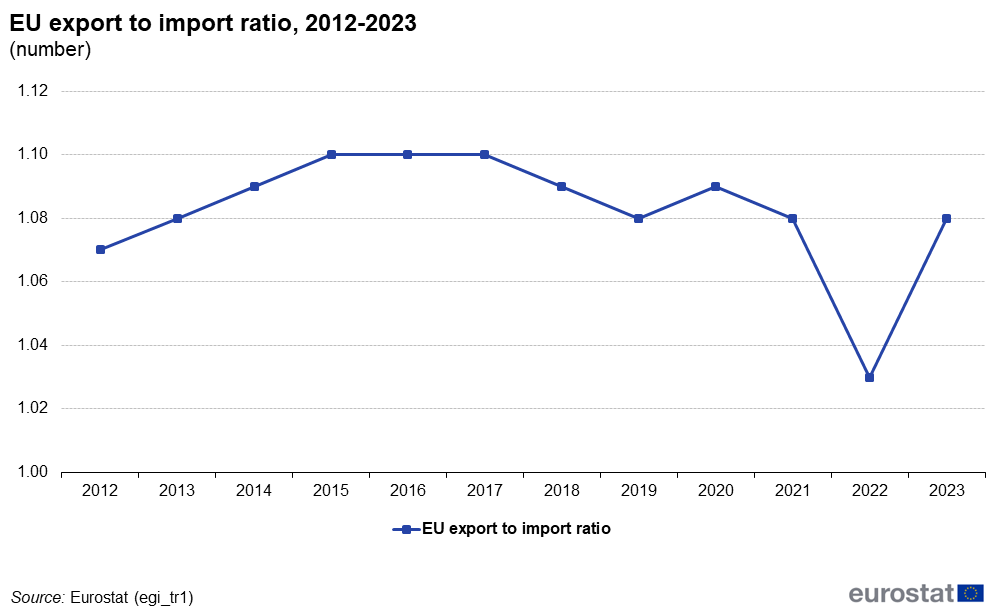
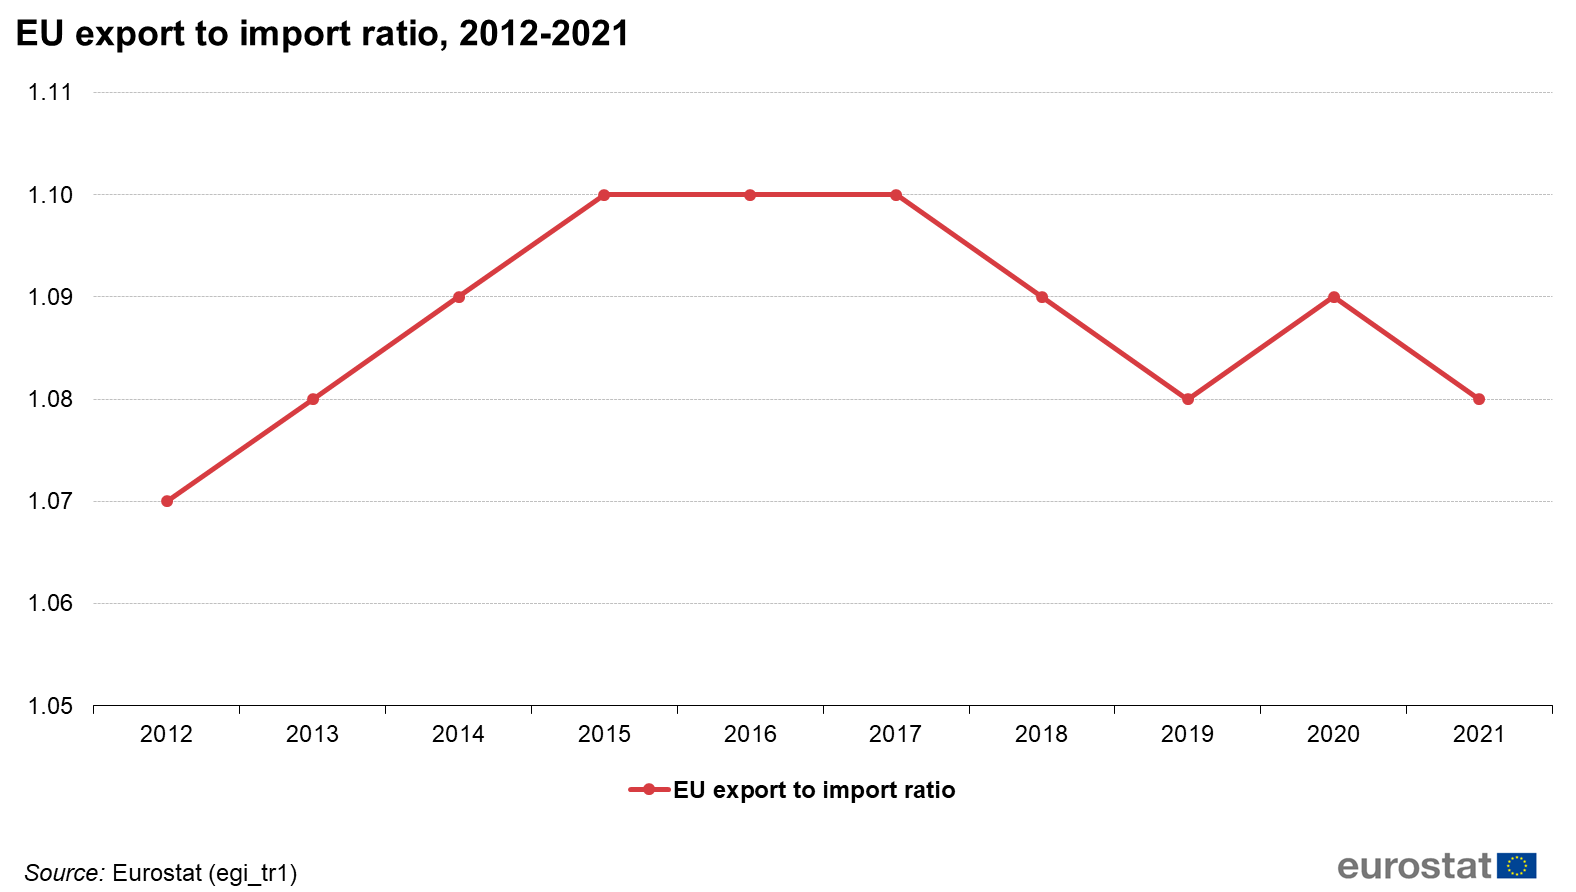
6 - EU export to import ratio.png
(
file
)
21 KB
2
16:20, 16 April 2024
5 - EU CO2 emissions from the production and consumption (footprint) perspectives in thousand tonnes.png
(
file
)
31 KB
2
16:20, 16 April 2024
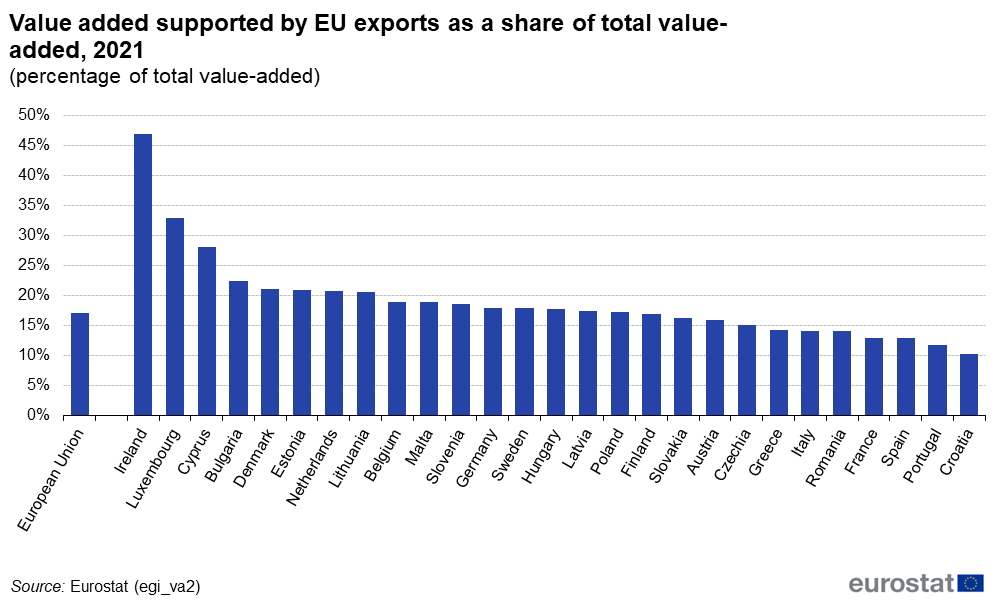
4 - Value added supported by EU exports as a share of total value added.png
(
file
)
53 KB
2
16:19, 16 April 2024
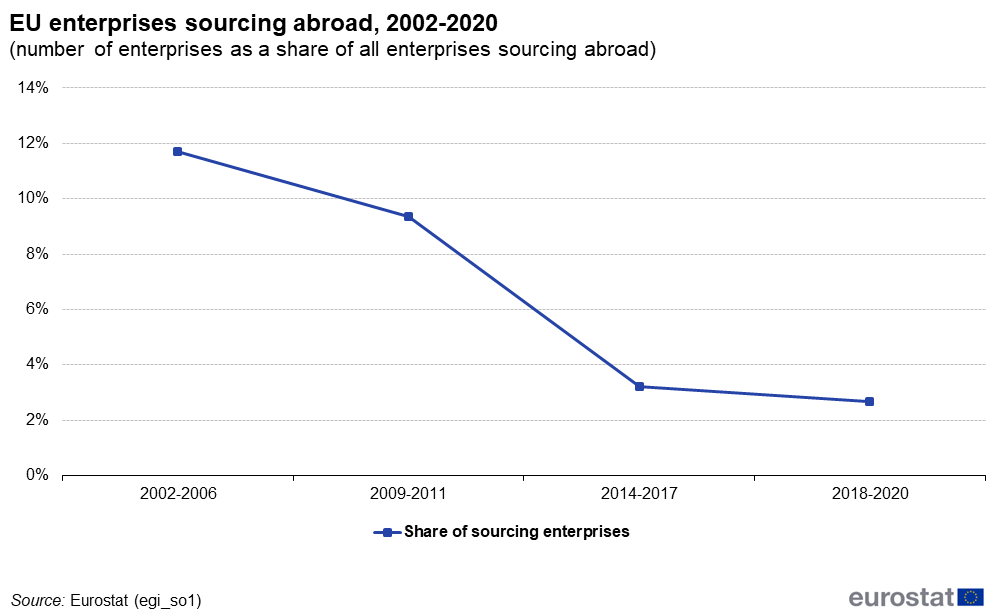
3 - Enterprises sourcing abroad.png
(
file
)
25 KB
2
16:19, 16 April 2024
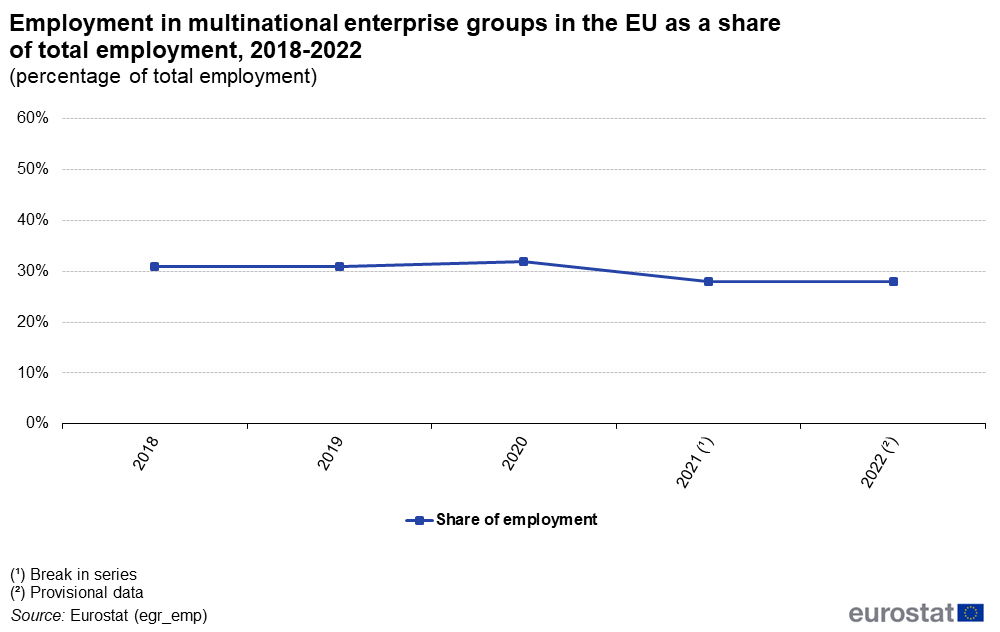
2 - Employment in multinational enterprise groups in the EU as a share of total employment.png
(
file
)
26 KB
2
16:19, 16 April 2024
1 - Employment shares of foreign controlled enterprises in total employment in business economy.png
(
file
)
42 KB
3
12:02, 15 April 2024
Figures and tables - EGI article v1.1.xlsx
(
file
)
241 KB
2
07:35, 9 June 2023
Figures and tables - EGI article - v0.1int.xlsx
(
file
)
189 KB
1
07:10, 9 June 2023
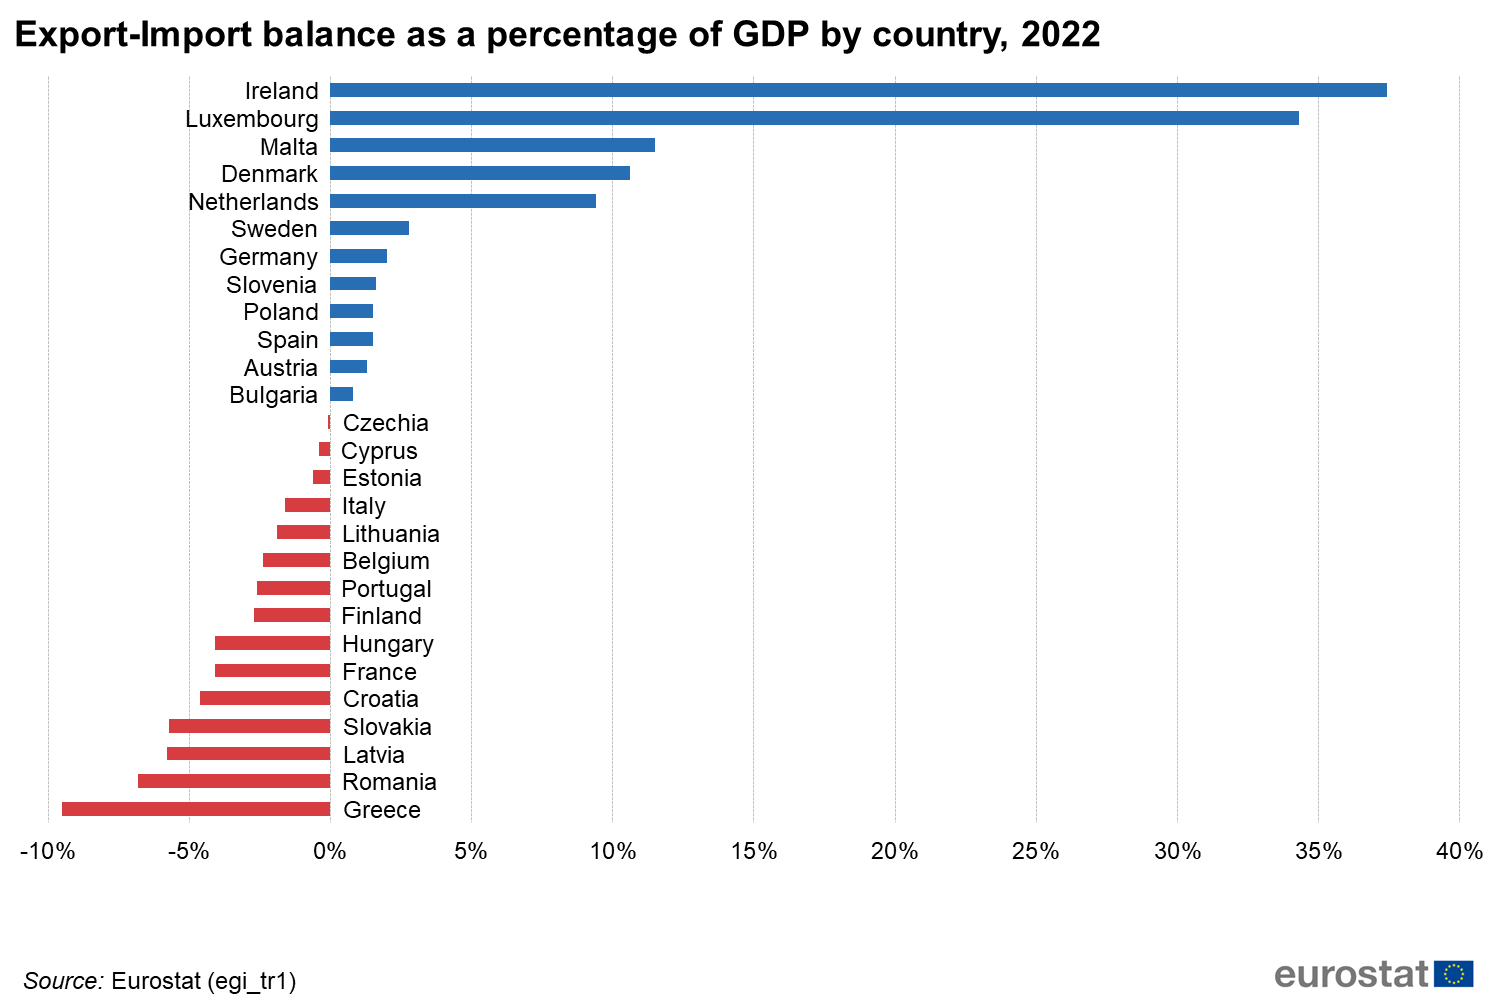
Figure 4 Export-Import balance as a percentage of GDP by country, 2022.png
(
file
)
84 KB
null
1
07:10, 9 June 2023
Figure 3 Imports and exports as percentage of GDP by country, 2022.png
(
file
)
106 KB
null
1
07:10, 9 June 2023
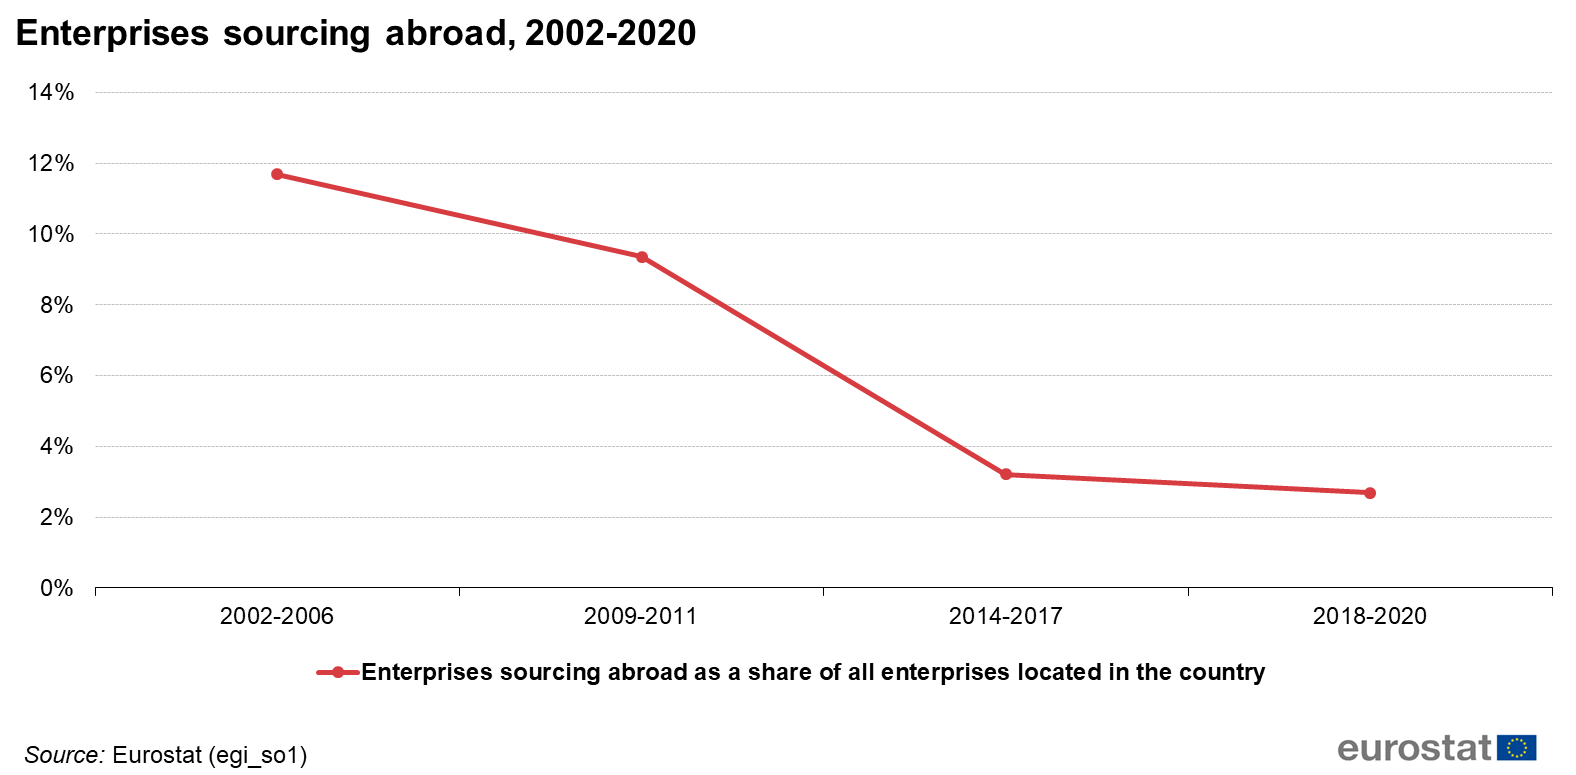
Figure 8 Enterprises sourcing abroad, 2002-2020.png
(
file
)
51 KB
null
1
07:10, 9 June 2023
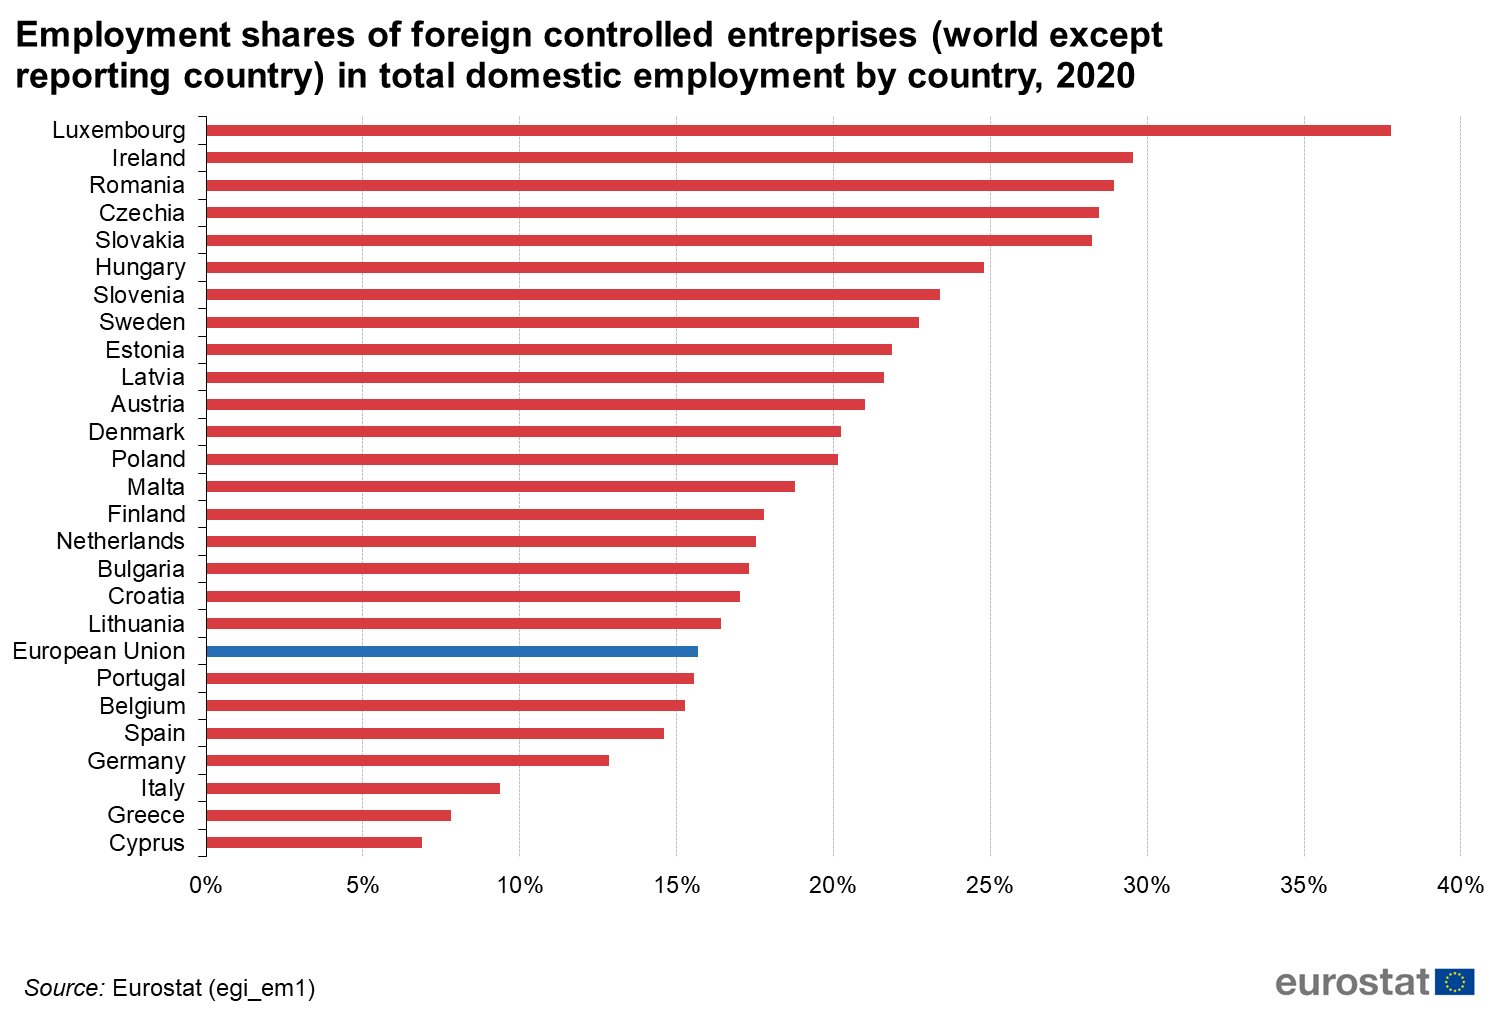
Figure 7 Employment shares of foreign controlled entreprises in total domestic employment by country, 2020.png
(
file
)
92 KB
null
1
07:10, 9 June 2023
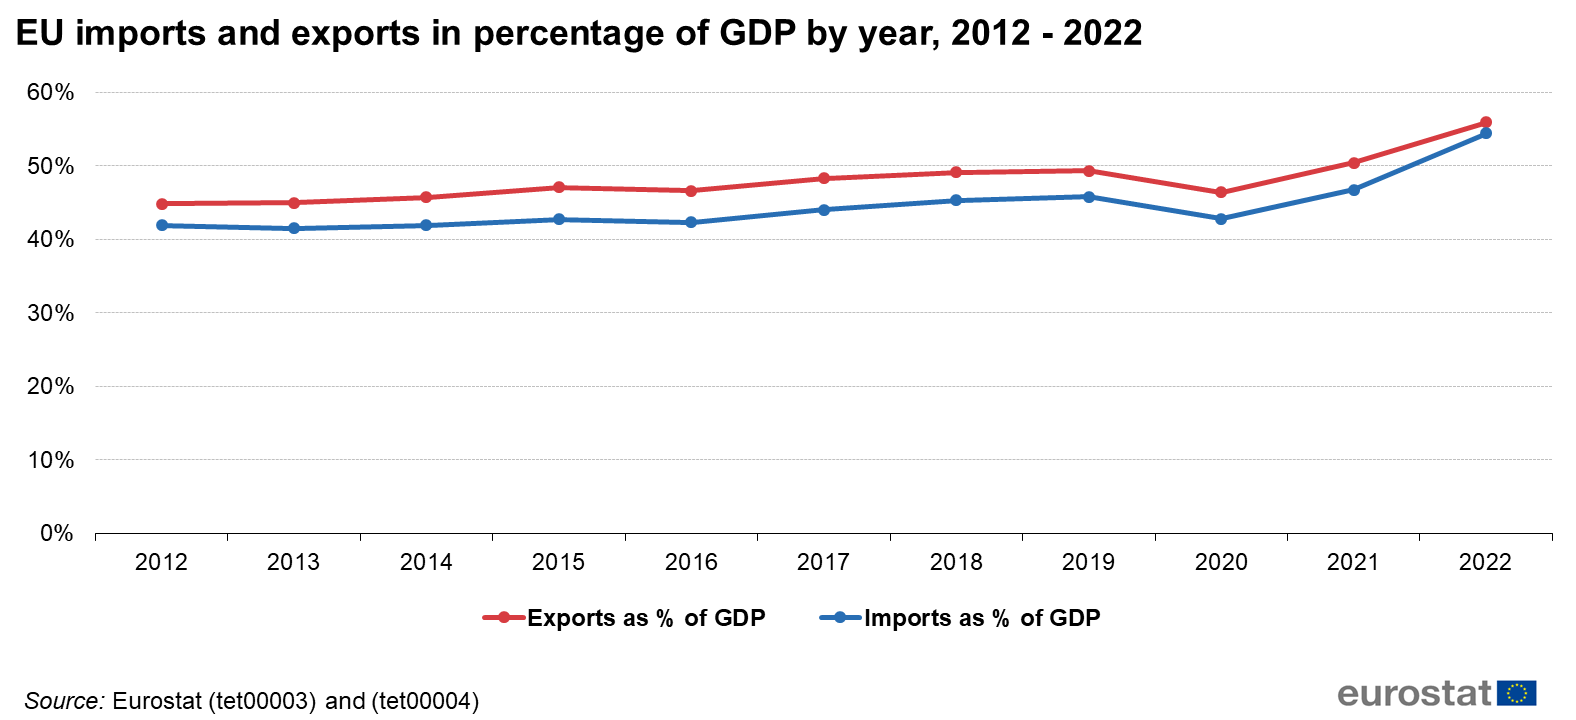
Figure 2 EU imports and exports in percentage of GDP by year, 2012 - 2022.png
(
file
)
57 KB
null
1
07:10, 9 June 2023
Figure 1 EU export to import ratio, 2012-2021.png
(
file
)
50 KB
null
1
07:10, 9 June 2023
Figure 6 Outward-inward FDI balance ratio by Member State, 2021.png
(
file
)
98 KB
null
1
07:10, 9 June 2023
Figure 5 EU Inward and outward FDI stocks relative to the rest of the world as a percentage of GDP, 2013-2021.png
(
file
)
71 KB
null
1
11:34, 22 November 2022
SE article-ready table v1.6.xlsx
(
file
)
141 KB
1
09:16, 22 November 2022
Figure 4 Number of enterprises sourcing abroad by country and foreign control status in 2018.png
(
file
)
102 KB
null
2
09:16, 22 November 2022
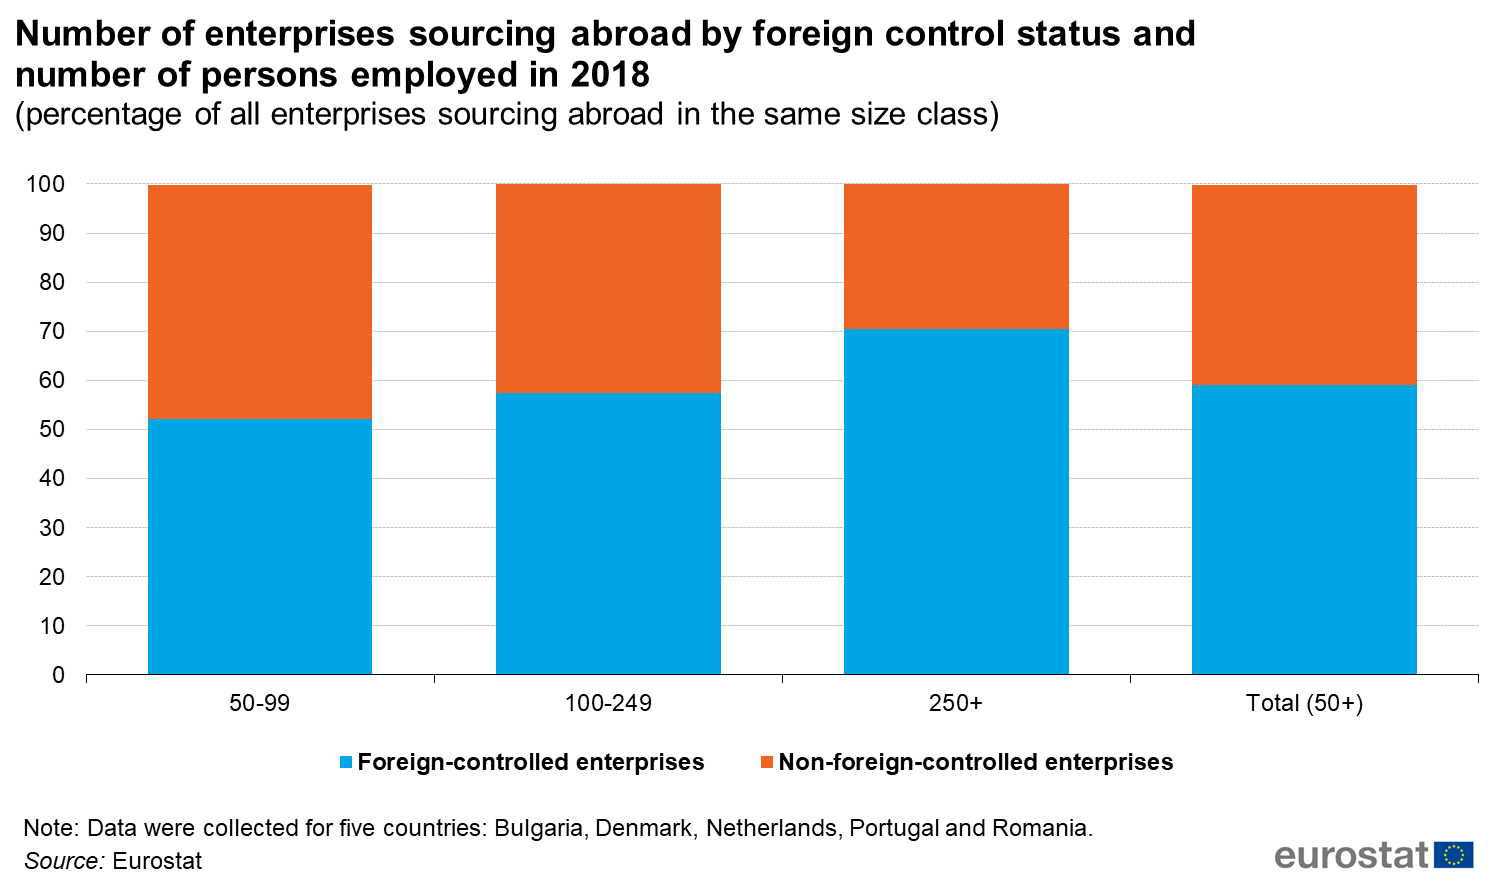
Figure 3 Number of enterprises sourcing abroad by foreign control status and number of persons employed in 2018.png
(
file
)
87 KB
null
2
09:16, 22 November 2022
Figure 2 Number of enterprises sourcing abroad by country and size class in 2018.png
(
file
)
106 KB
null
2
09:16, 22 November 2022
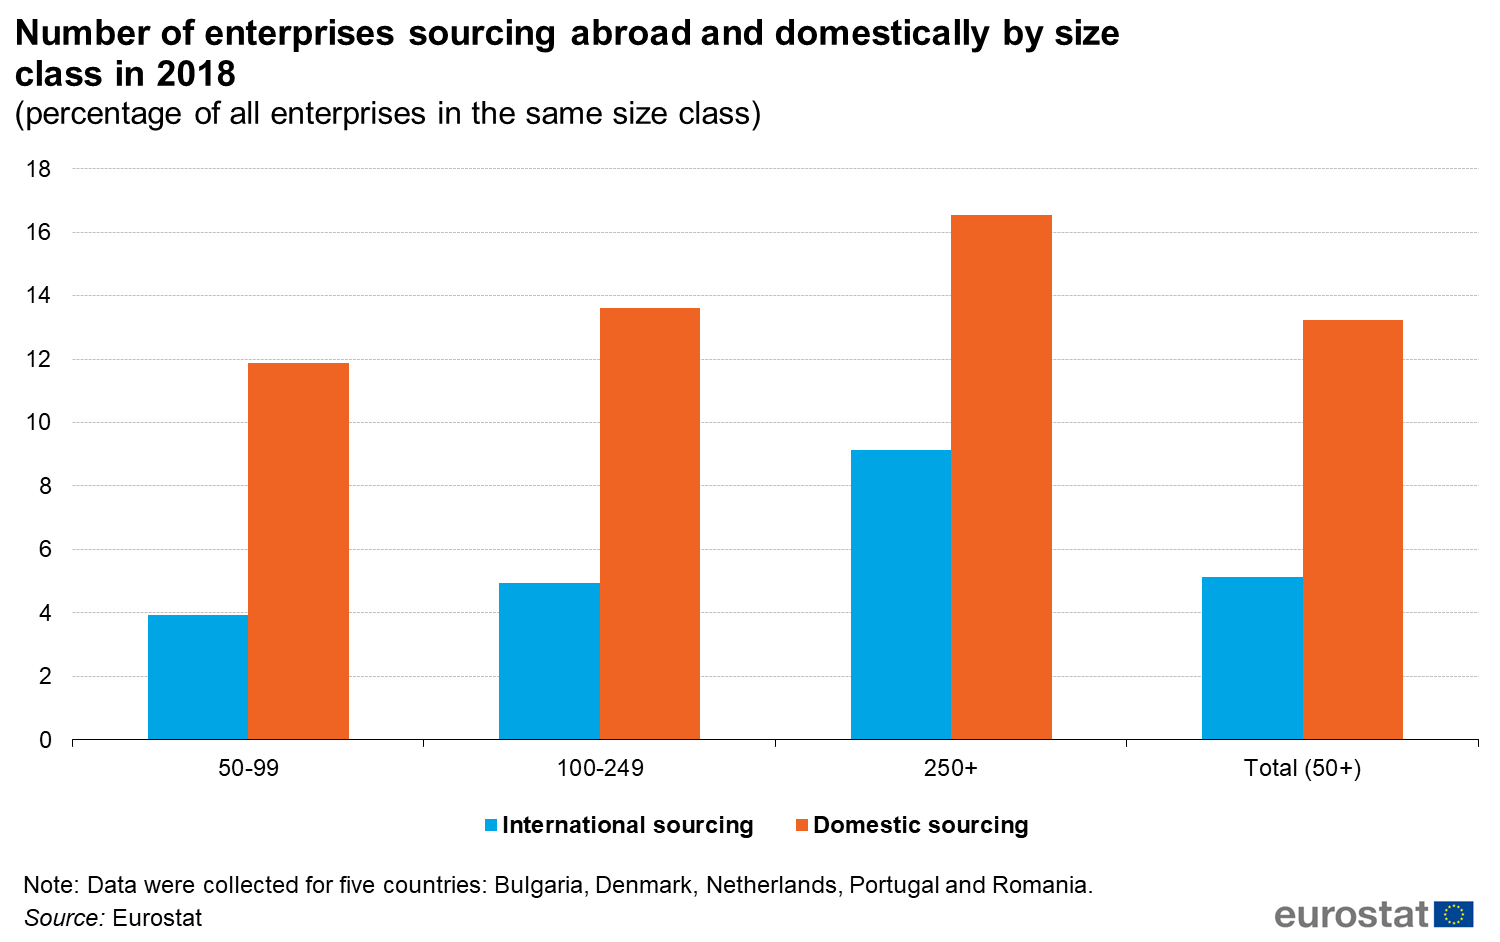
Figure 1 Number of enterprises sourcing abroad and domestically by size class in 2018.png
(
file
)
82 KB
null
2
09:16, 22 November 2022
Figure 11 Enterprises sourcing abroad by number of sourcing destinations and NACE rev 2 activity aggregate in 2018.png
(
file
)
91 KB
null
2
09:16, 22 November 2022
Figure 10 Enterprises sourcing abroad by the intensity of jobs lost and NACE rev 2 activity aggregate in 2018.png
(
file
)
74 KB
null
2
09:16, 22 November 2022
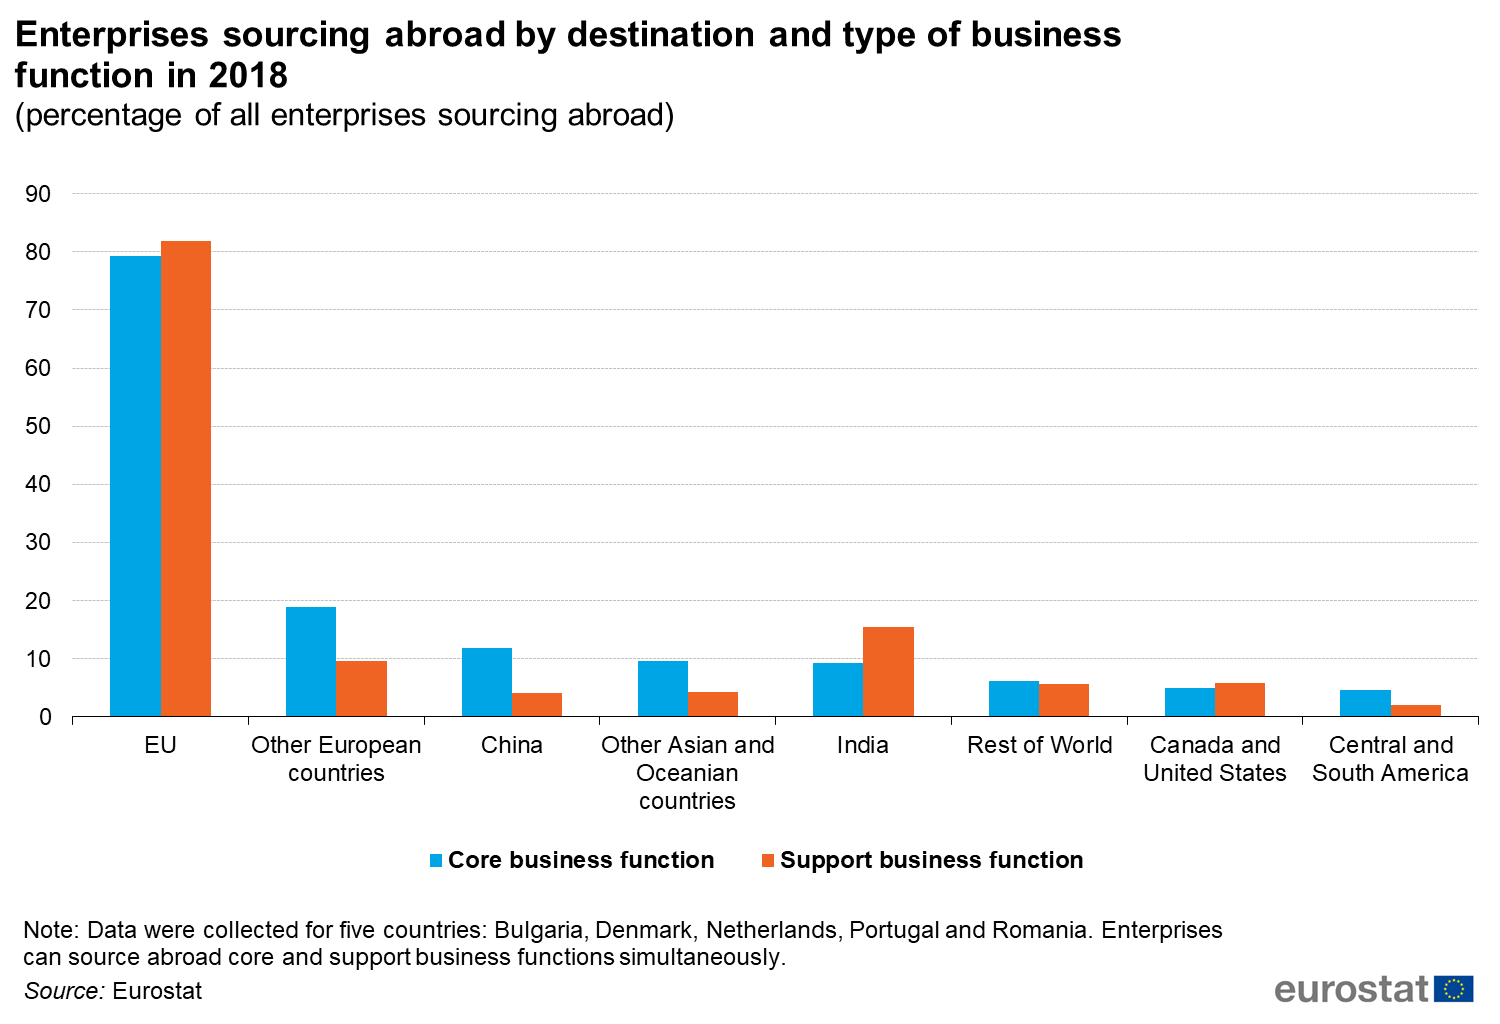
Figure 9 Enterprises sourcing abroad by destination and type of business function in 2018.png
(
file
)
90 KB
null
1
09:16, 22 November 2022
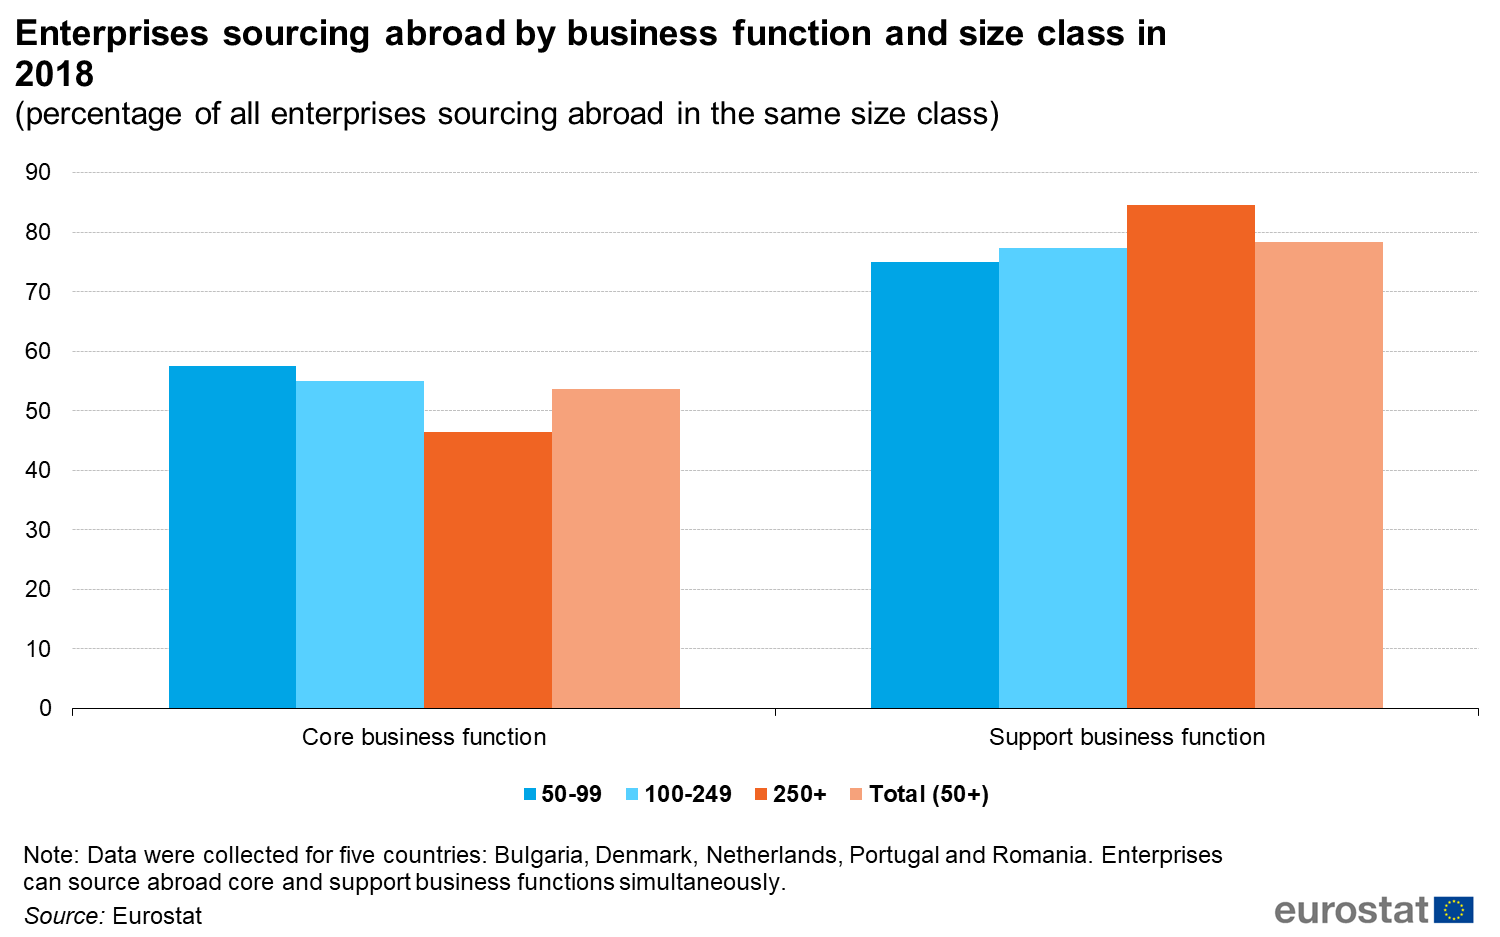
Figure 8 Enterprises sourcing abroad by business function and size class in 2018.png
(
file
)
92 KB
null
2
09:16, 22 November 2022
Figure 5 Enterprises sourcing abroad by trader type and size in 2018.png
(
file
)
63 KB
null
2
14:24, 18 November 2022
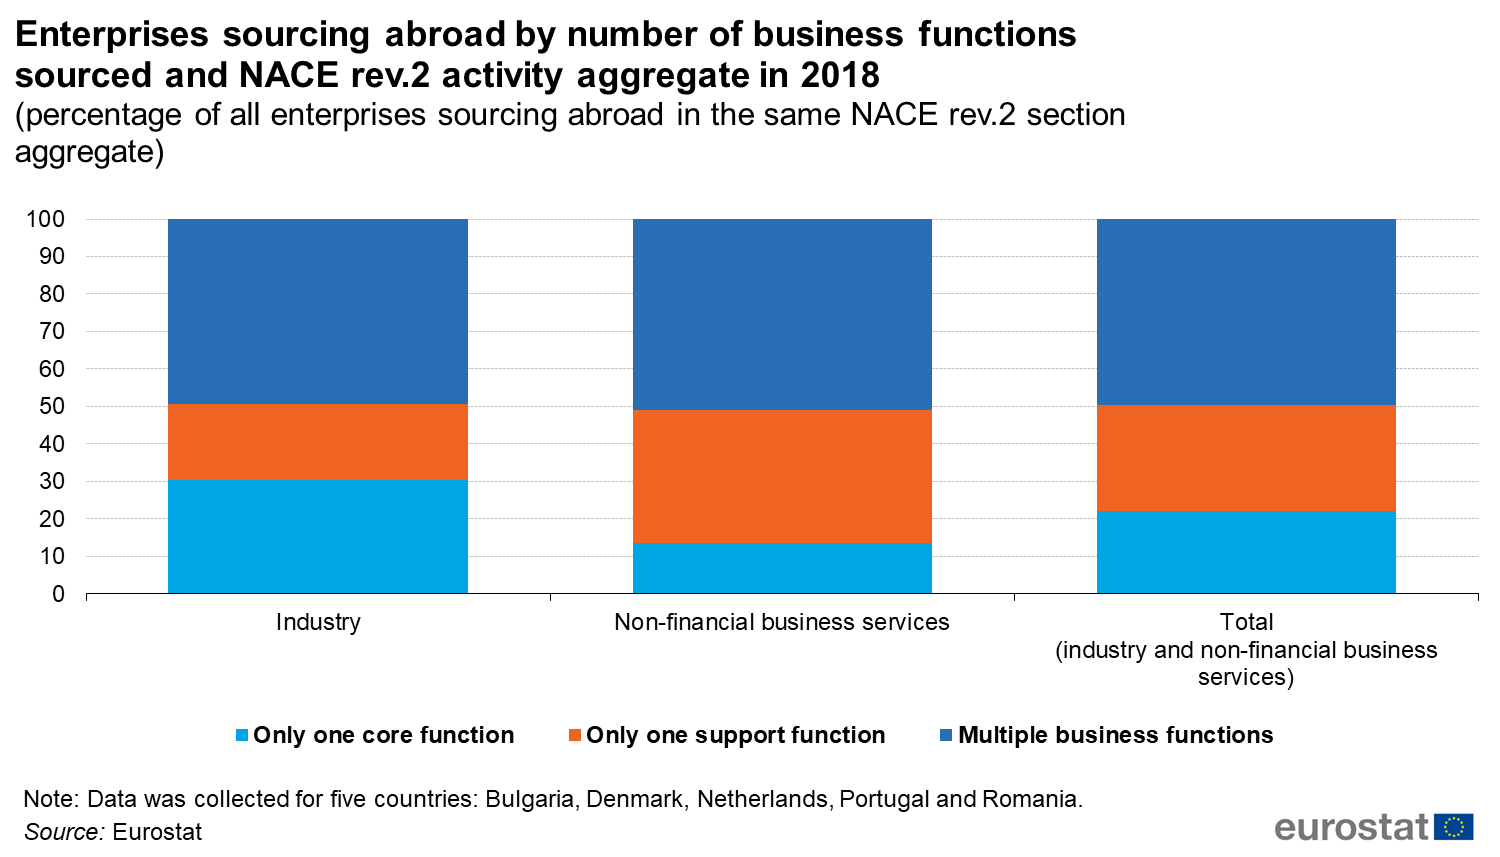
Figure 12 Enterprises sourcing abroad by number of business functions sourced and NACE rev 2 activity aggregate in 2018.png
(
file
)
91 KB
null
1
10:16, 18 November 2022
Figures and tables - EGI article.xlsx
(
file
)
192 KB
2
10:14, 18 November 2022
Figure 6. Inward - Outward FDI balance ratio by Member State, 2020.png
(
file
)
104 KB
3
10:13, 18 November 2022
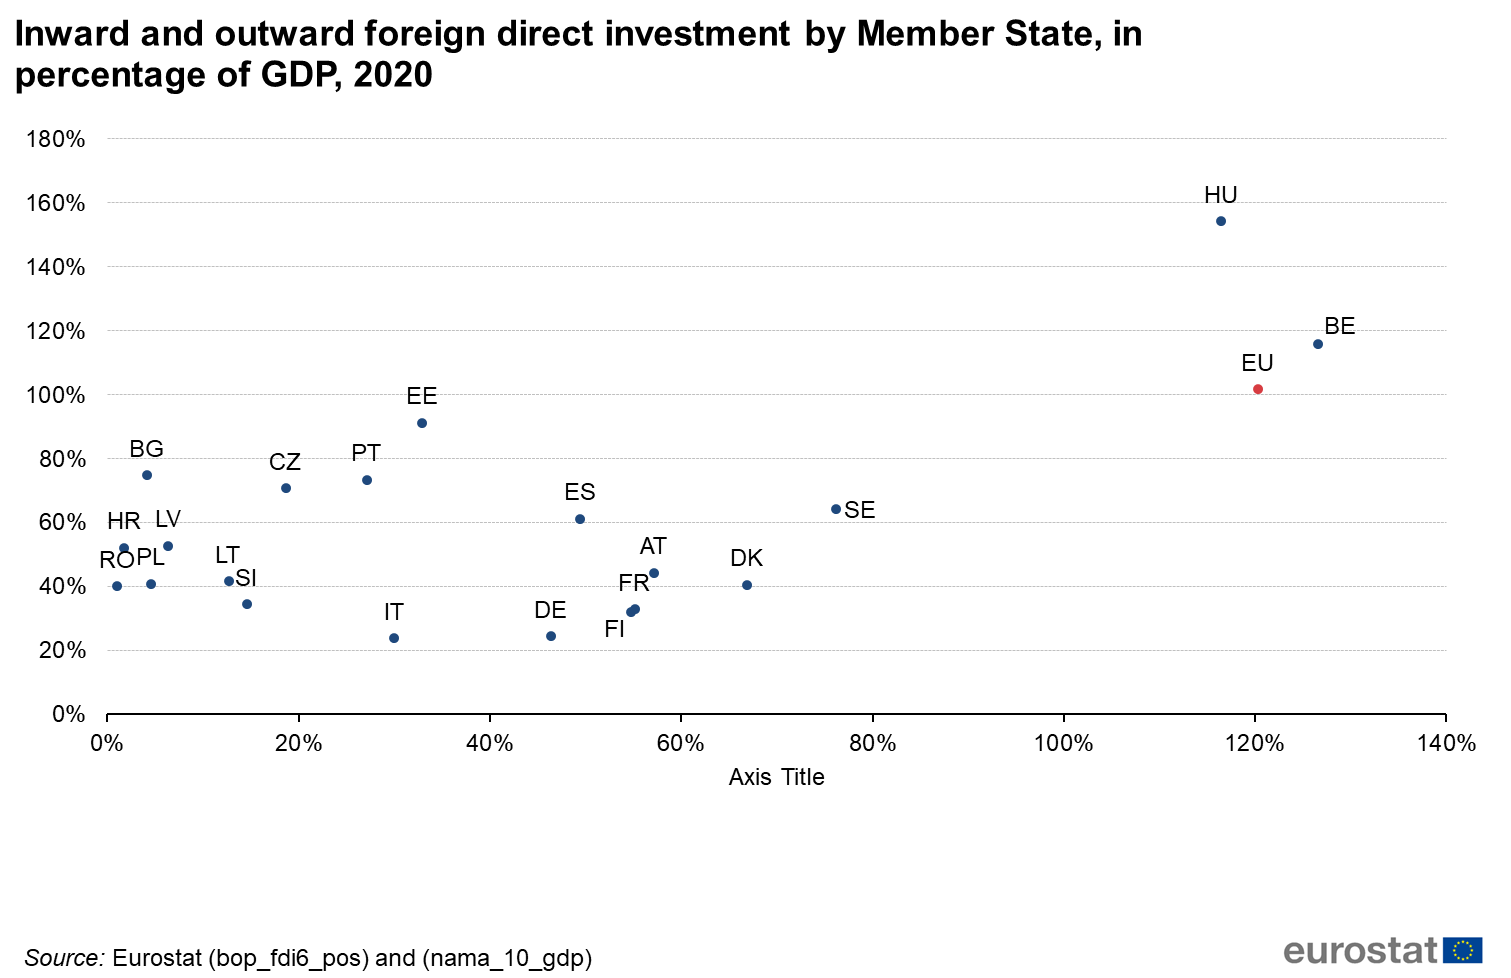
Figure 5. Inward and outward foreign direct investment by Member State, in percentage of GDP, 2020.png
(
file
)
64 KB
3
10:13, 18 November 2022
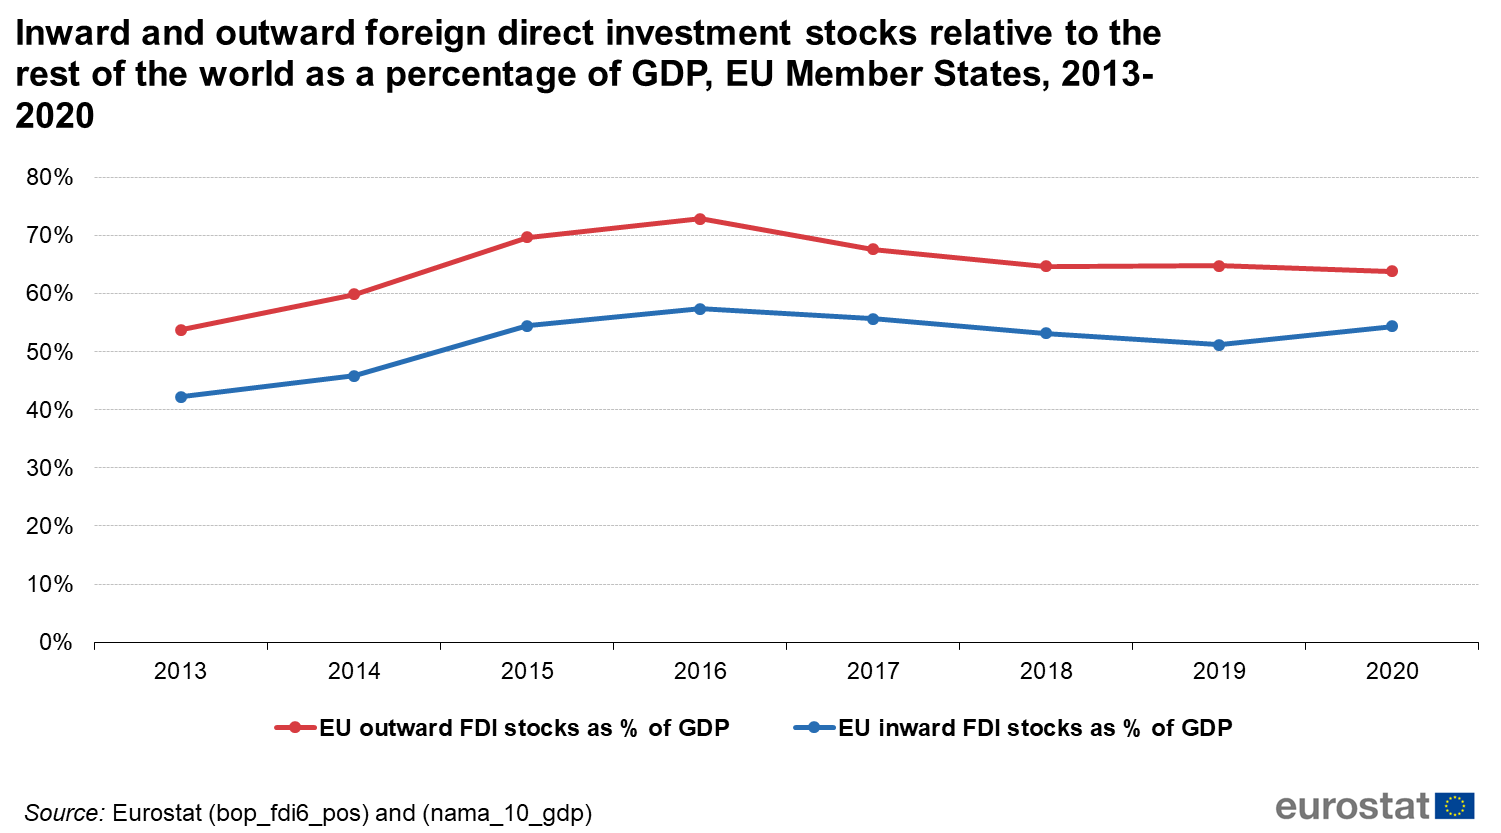
Figure 4. Inward and outward foreign direct investment stocks relative to the rest of the world as a percentage of GDP, EU-27, 2013-2020.png
(
file
)
77 KB
3
10:12, 18 November 2022
Figure 1. EU-27 imports and exports in percentage of GDP by year, 2010 - 2021.png
(
file
)
59 KB
2
11:47, 15 November 2022
Table 1. Outliers in Inward and outward FDI, 2020.png
(
file
)
16 KB
1
11:45, 15 November 2022
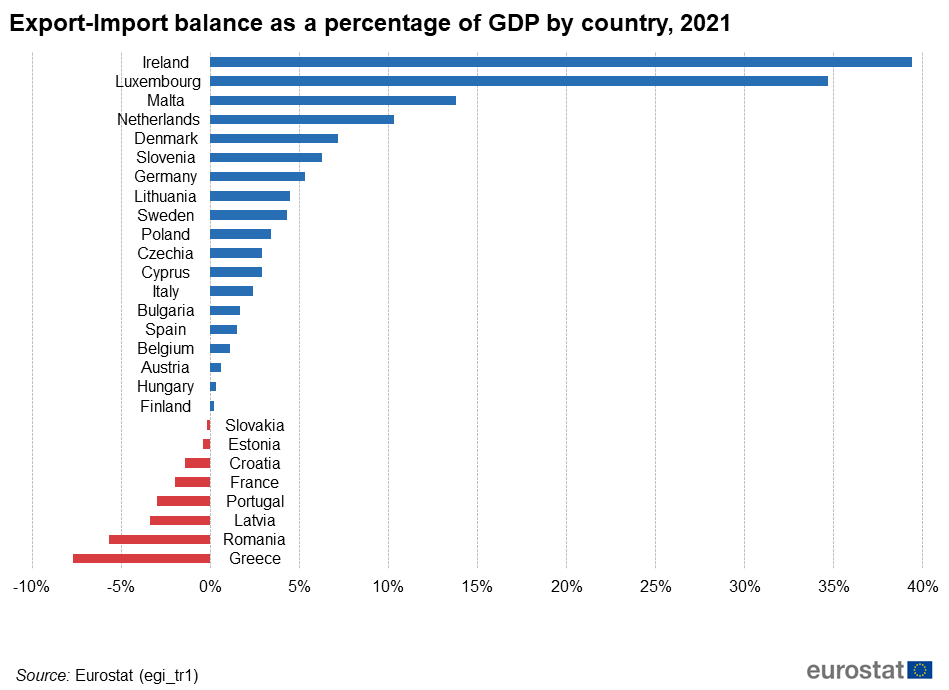
Figure 3. Export-Import balance as a percentage of GDP by country, 2021.png
(
file
)
45 KB
null
1
11:45, 15 November 2022
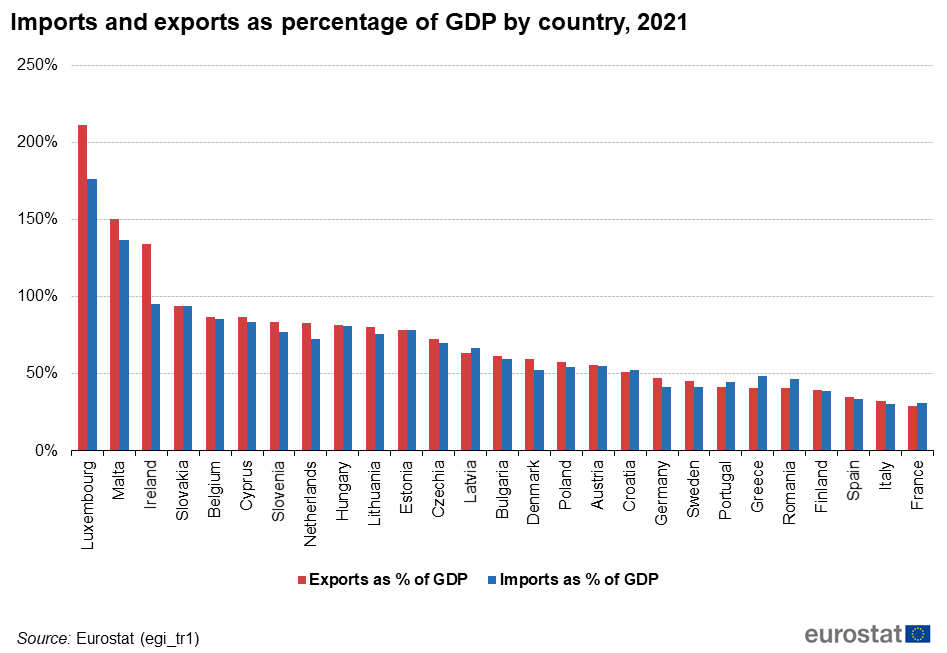
Figure 2. Imports and exports as percentage of GDP by country, 2021.png
(
file
)
51 KB
null
1
11:45, 15 November 2022
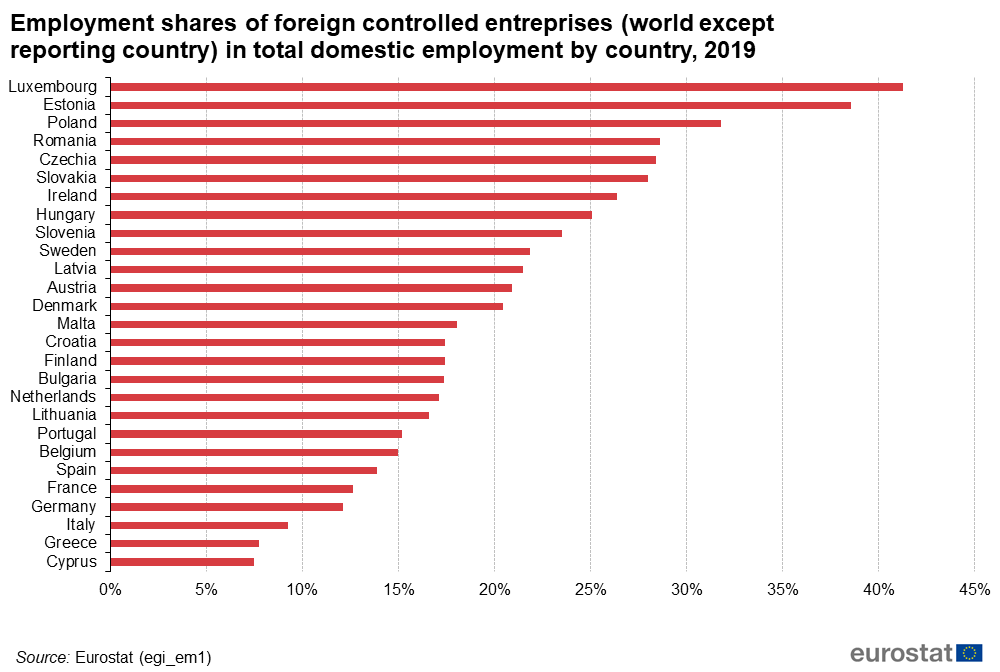
Figure 7. Employment shares of foreign controlled entreprises (world except reporting country) in total domestic employment by country, 2019.png
(
file
)
47 KB
null
1
11:29, 14 October 2022
Enterprises sourcing abroad by country and by NACE aggregate (2018-2020) Fig4 04102022.png
(
file
)
123 KB
2
11:28, 14 October 2022
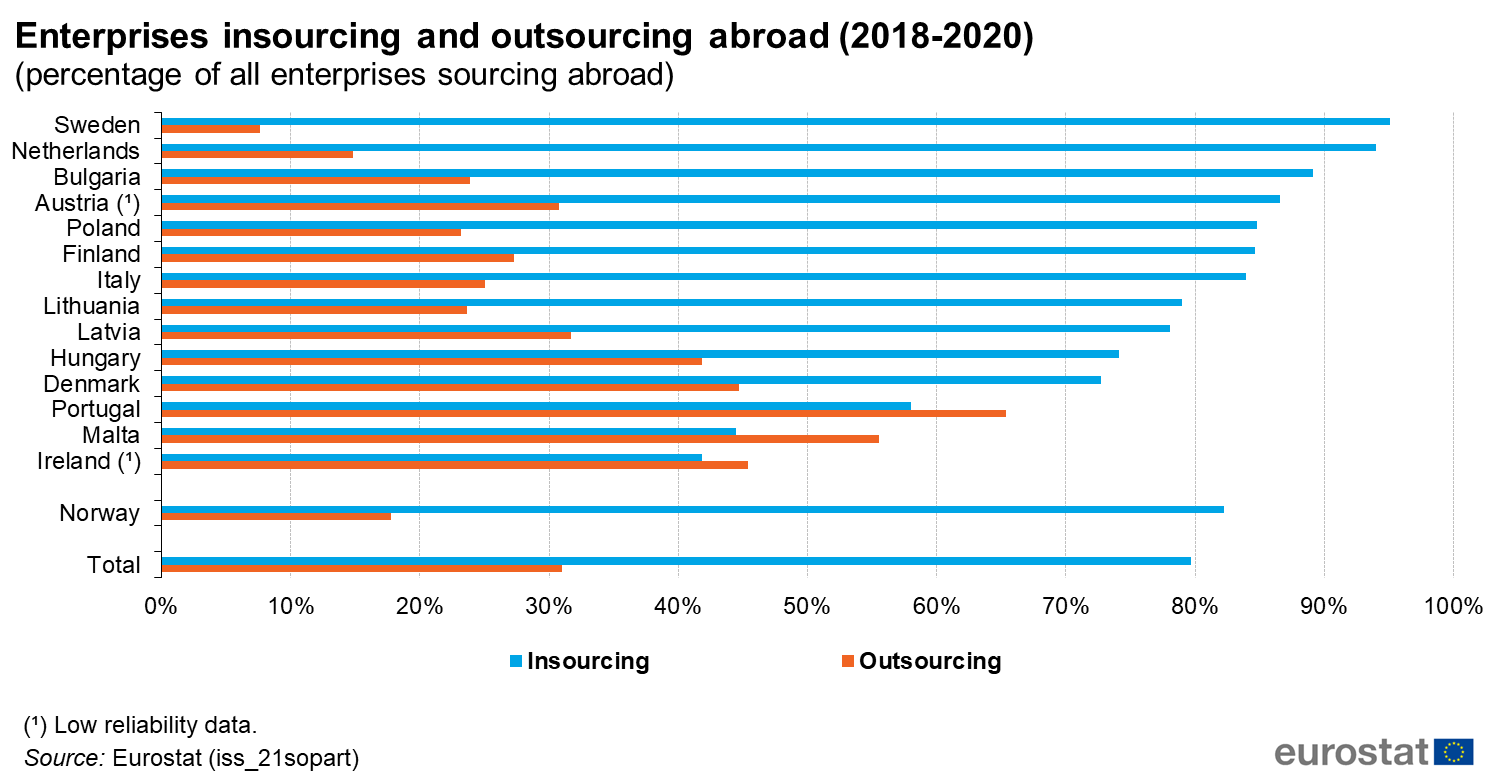
Figure 02 Enterprises insourcing and outsourcing abroad (2018-2020).png
(
file
)
71 KB
5
17:48, 4 October 2022
Impact on international sourcing resulting from the COVID-19 pandemic (2018-2020)Fig17 04102022.png
(
file
)
57 KB
3
17:21, 4 October 2022
SE article-ready table 2021 REV.xlsx
(
file
)
209 KB
2
17:17, 4 October 2022
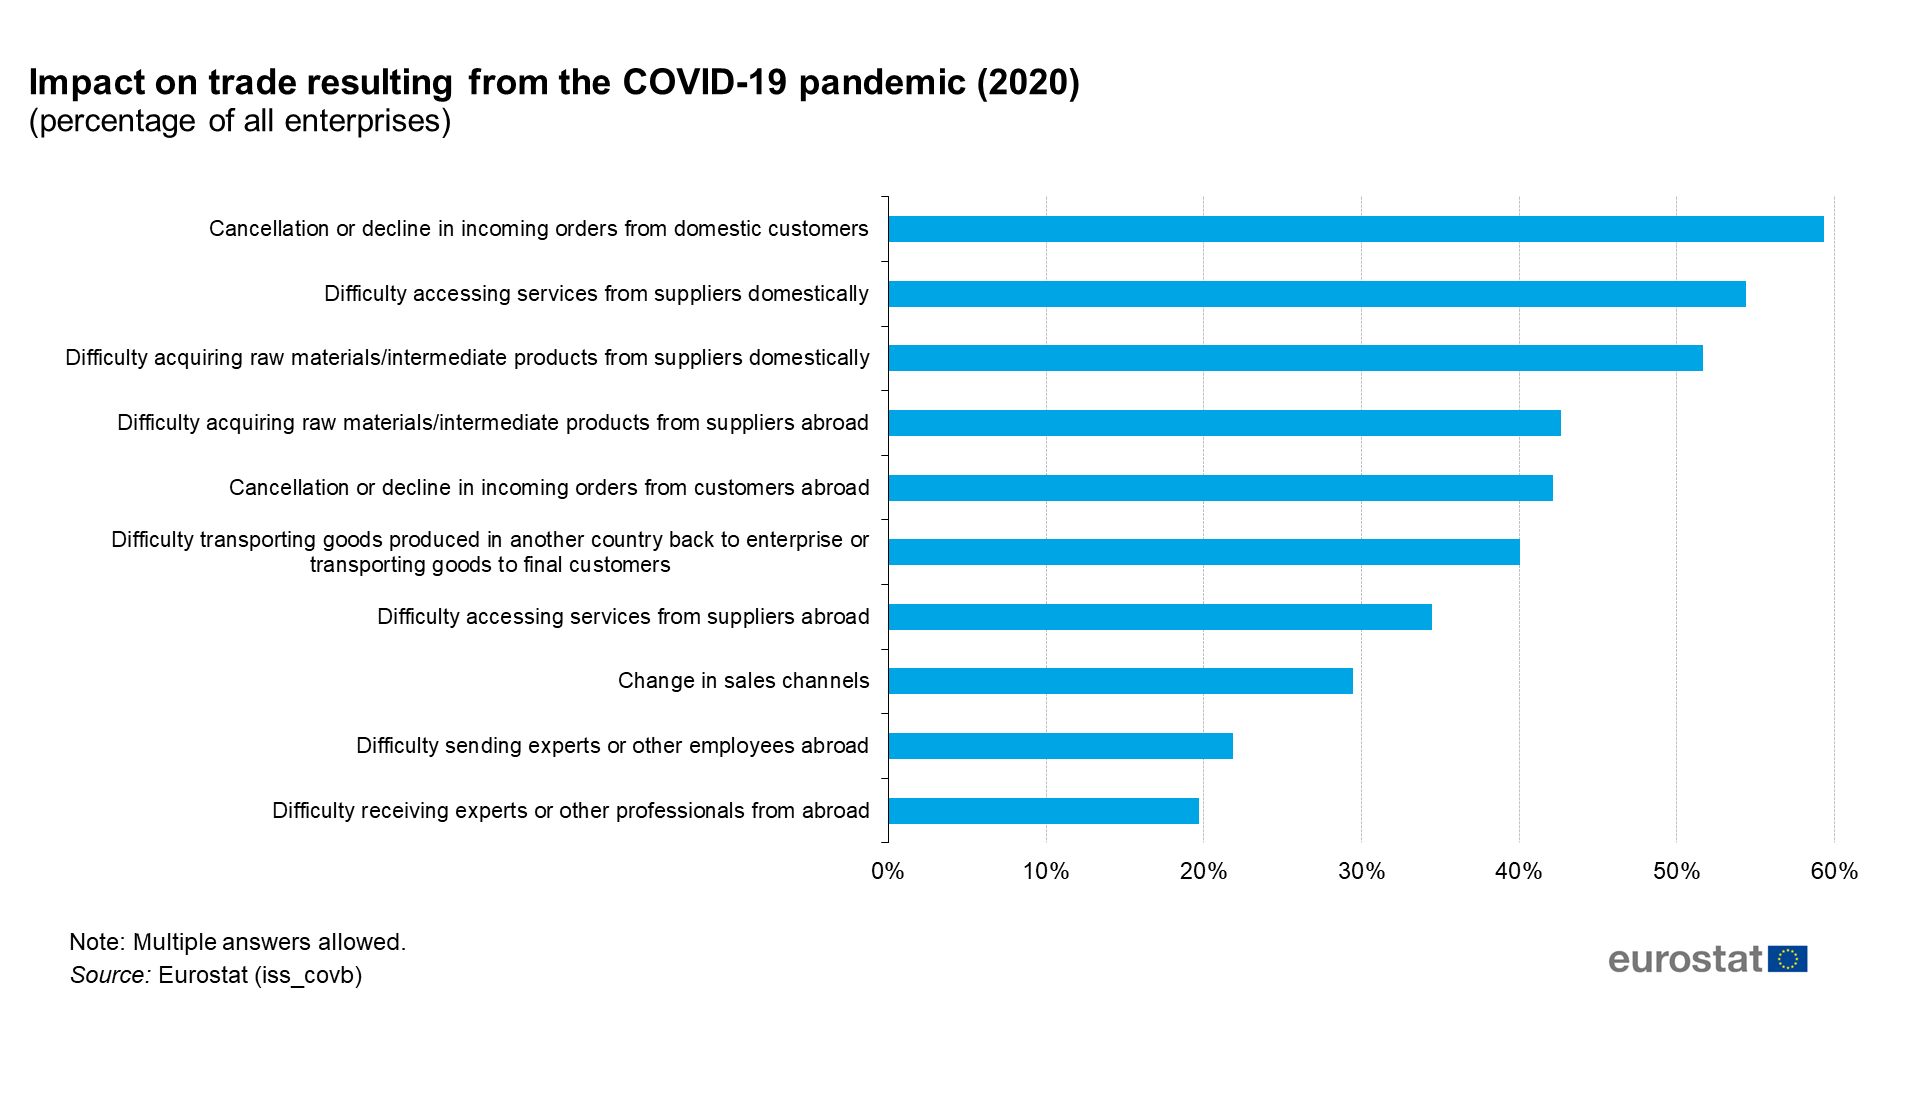
Impact on trade resulting from the COVID-19 pandemic (2018-2020)Fig19 04102022.png
(
file
)
110 KB
3
First page
Previous page
Next page
Last page
Special page
ISSN 2443-8219


_perspectives_in_thousand_tonnes.png)


_in_total_domestic_employment_by_country,_2019.png)
_Fig4_04102022.png)
.png)
Fig17_04102022.png)
Fig19_04102022.png)