Tutorials
Log in
Statistics Explained
menu
search
search
Navigation
Main page
Statistical themes
Glossary
Categories
Statistics 4 beginners
Tutorials
Help
Eurostat home
Education corner
Online publications
Regional yearbook
Sustainable development
Full list
Tools
User contributions
Logs
View user groups
Special pages
search
Navigation
Main page
Statistical themes
Glossary
Categories
Statistics 4 beginners
Tutorials
Help
Eurostat home
Education corner
Online publications
Regional yearbook
Sustainable development
Full list
Tools
User contributions
Logs
View user groups
Special pages
Navigation
Main page
Statistical themes
Glossary
Categories
Statistics 4 beginners
Tutorials
Help
Eurostat home
Education corner
Online publications
Regional yearbook
Sustainable development
Full list
Tools
User contributions
Logs
View user groups
Special pages
Uploads by Piirtju
This special page shows all uploaded files.
File list
Items per page:
20
50
100
250
500
Search for media name:
Username:
Include old versions of files
Go
First page
Previous page
Next page
Last page
Date
Name
Thumbnail
Size
Description
Versions
02:15, 21 December 2023
Annual statistical accounts of the EU institutions and bodies subsector 20-12-2023.xlsb
(
file
)
76 KB
1
01:16, 21 December 2023
Empty image2.PNG
(
file
)
151 bytes
1
01:15, 21 December 2023
Empty image.PNG
(
file
)
151 bytes
2
23:28, 20 December 2023
Stock-flow adjustment of the EU Institutions and bodies subsector, 2021 and 2022 (EUR million).png
(
file
)
39 KB
1
23:27, 20 December 2023
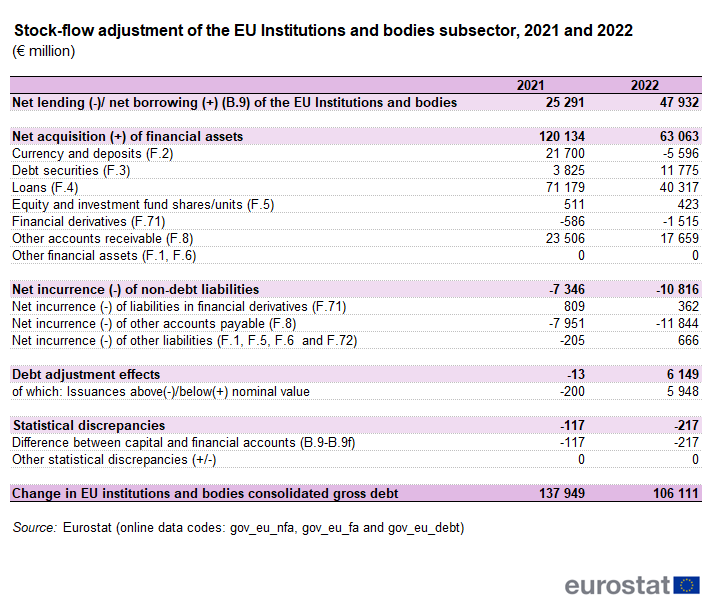
Stock-flow adjustment of the EU Institutions and bodies subsector, 2021 and 2022 (€ million).png
(
file
)
39 KB
1
18:32, 20 December 2023
Key figures of the EU institutions and bodies accounts 2021 and 2022 (EUR billion) v3.png
(
file
)
20 KB
1
18:25, 20 December 2023
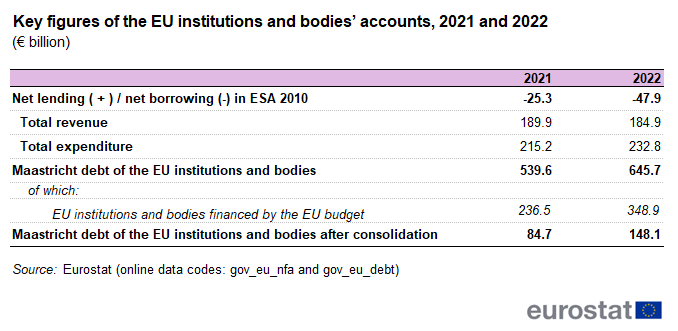
Key figures of the EU institutions and bodies’ accounts, 2021 and 2022 (€ billion) v3.png
(
file
)
20 KB
1
15:25, 8 August 2023
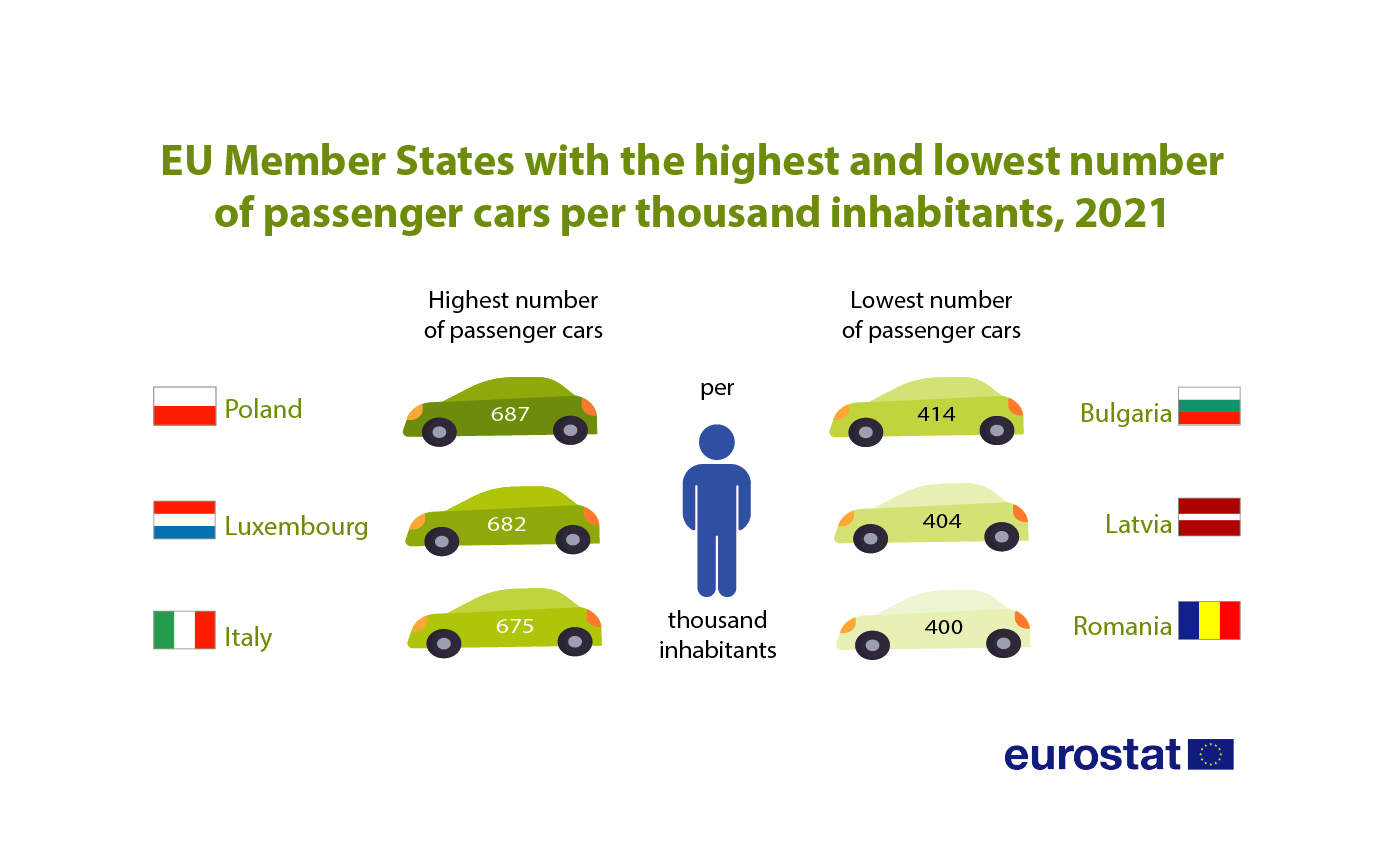
Passenger cars per thousand inhabitants, 2021.png
(
file
)
68 KB
2
13:37, 21 July 2023
AGFS graphs 2022 19-07-2023.xlsb
(
file
)
77 KB
3
16:08, 20 July 2023
Minimum wage statistics 2023S02.xlsx
(
file
)
62 KB
2
14:24, 20 July 2023
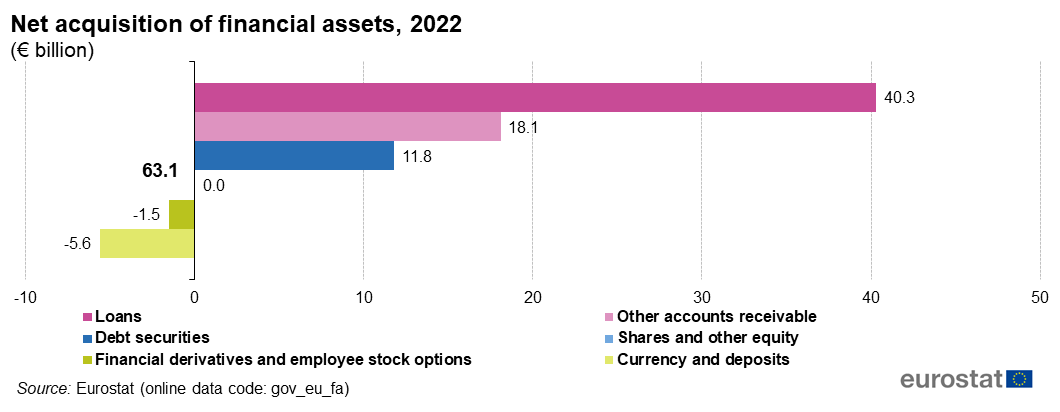
Net acquisition of financial assets, 2022 (euro billion).png
(
file
)
32 KB
1
14:08, 20 July 2023
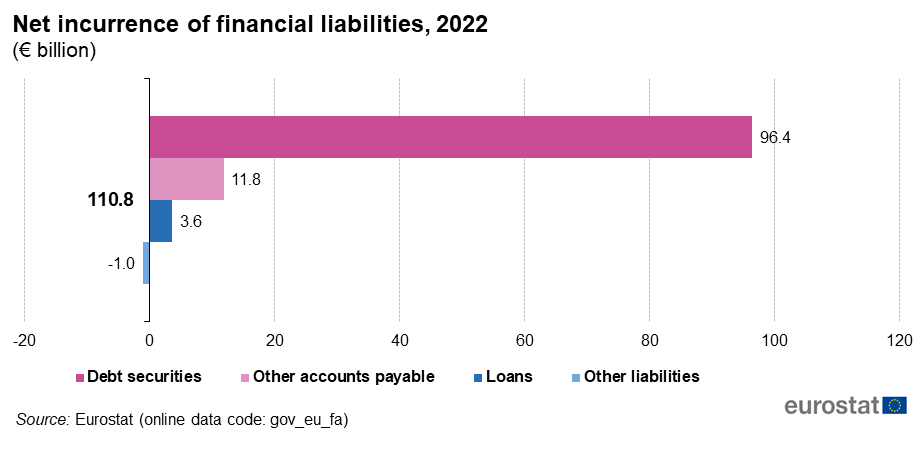
Net incurrence of financial liabilities, 2022 (euro billion).png
(
file
)
27 KB
1
13:24, 20 July 2023
Maastricht debt of the EU institutions and bodies after consolidation of assets against Member States, 2021 and 2022 (euro million).png
(
file
)
30 KB
1
13:18, 20 July 2023
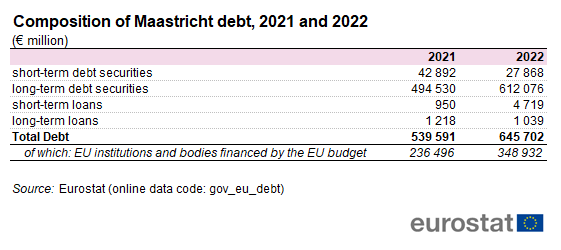
Composition of Maastricht debt, 2021 and 2022 (euro million).png
(
file
)
20 KB
1
13:02, 20 July 2023
Composition of Maastricht debt, 2022 (% of total debt).png
(
file
)
26 KB
3
12:15, 20 July 2023
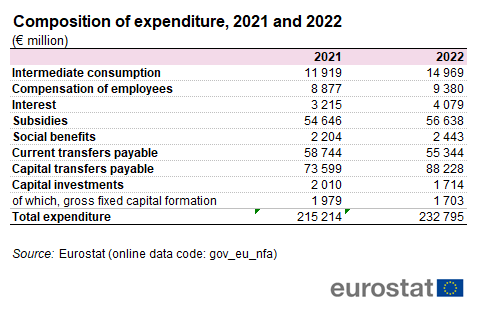
Composition of expenditure, 2021 and 2022 (euro million).png
(
file
)
24 KB
1
12:11, 20 July 2023
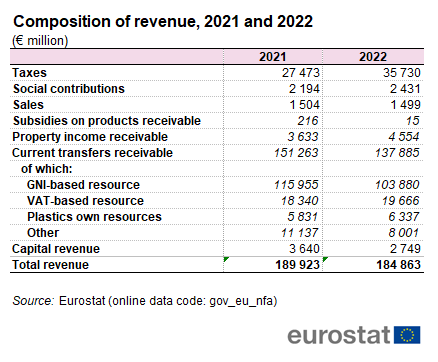
Composition of revenue, 2021 and 2022 (euro million).png
(
file
)
27 KB
1
12:09, 20 July 2023
Key figures of the EU institutions and bodies accounts, 2021 and 2022 (euro million).png
(
file
)
24 KB
1
08:49, 20 July 2023
Composition of revenue.png
(
file
)
26 KB
2
08:32, 20 July 2023
Composition of total revenue, 2022 (% of total revenue) v2.png
(
file
)
30 KB
2
08:20, 20 July 2023
Key figures of the EU institutions and bodies accounts.png
(
file
)
21 KB
3
11:47, 2 December 2022
International trade in hybrid and electric cars Dec 2022.xlsx
(
file
)
13 KB
1
14:31, 28 November 2022
Gross domestic expenditure on R&D by sector, 2011-2021 (%, relative to GDP).png
(
file
)
41 KB
1
10:59, 21 October 2022
Main components of government expenditure, 2021 (¹) (% of total expenditure).png
(
file
)
79 KB
1
16:37, 7 October 2022
Quality of life - natural environment - 2022 dynamic-1.xlsx
(
file
)
15 KB
1
16:35, 7 October 2022
Quality of life - natural environment - 2022 dynamic.xlsx
(
file
)
15 KB
2
16:06, 7 October 2022
Population reporting noise from neighbours or from the street, by degree of urbanisation, 2020 (%).png
(
file
)
87 KB
1
16:03, 7 October 2022
Population reporting noise from neighbours or from the street, by income situation, 2020 (%).png
(
file
)
86 KB
1
16:00, 7 October 2022
Population reporting noise from neighbours or from the street, EU (¹) , 2011-2020 (%).png
(
file
)
28 KB
1
15:58, 7 October 2022
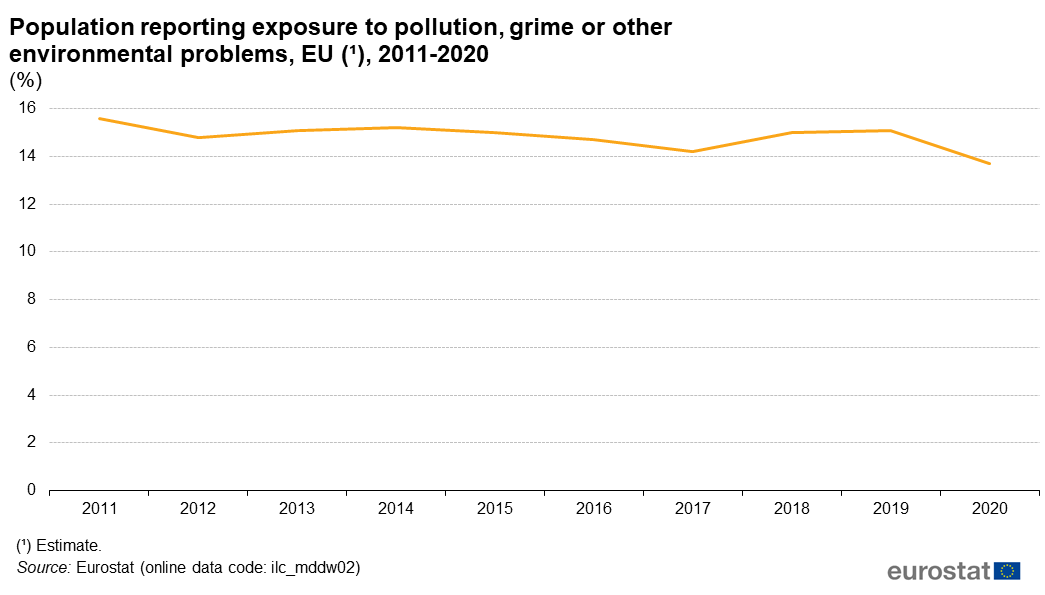
Population reporting exposure to pollution, grime or other environmental problems, EU (¹), 2011-2020 (%).png
(
file
)
31 KB
1
15:54, 7 October 2022
Population reporting exposure to pollution, grime or other environmental problems, by degree of urbanisation, 2020 (%) .png
(
file
)
80 KB
1
15:51, 7 October 2022
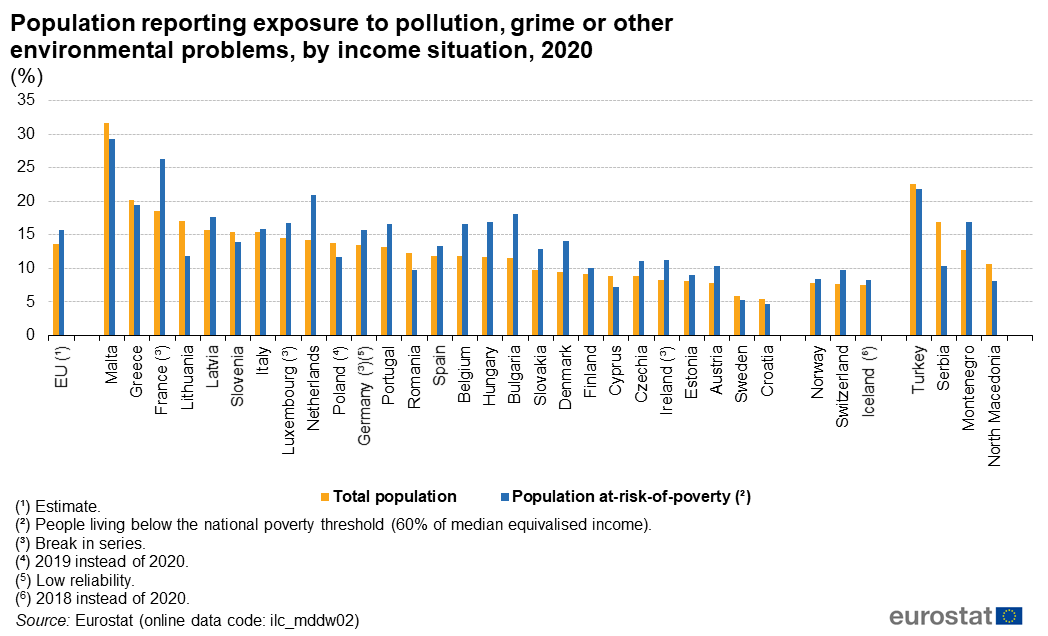
Population reporting exposure to pollution, grime or other environmental problems, by income situation, 2020 (%) .png
(
file
)
73 KB
1
15:33, 29 September 2022
SE Road Trends 2022 .xlsx
(
file
)
116 KB
3
15:31, 29 September 2022
Top 20 country-to-country flows in intra-EU road freight transport, 2021.png
(
file
)
47 KB
1
15:27, 29 September 2022
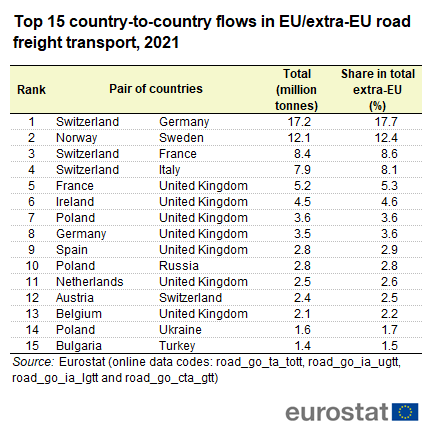
Top 15 country-to-country flows in EU extra-EU road freight transport, 2021.png
(
file
)
30 KB
1
12:53, 28 September 2022
Share of fuel type in energy consumption by agriculture and forestry, 2020.png
(
file
)
112 KB
1
12:52, 28 September 2022
Energy use statistics all tables and figures 2022.xlsx
(
file
)
65 KB
3
11:18, 28 September 2022
Energy consumption by agriculture, 2010 and 2020 (kilograms of oil equivalent per hectare of UAA).png
(
file
)
50 KB
1
10:36, 28 September 2022
20220929 EU Forestry Energy V3 Web invert.png
(
file
)
158 KB
1
10:10, 28 September 2022
Share of fuel type in energy consumption by agriculture, 2020.png
(
file
)
111 KB
1
10:03, 28 September 2022
Share of the total direct consumption of energy by agriculture and forestry, 2020 (%).png
(
file
)
50 KB
1
09:46, 28 September 2022
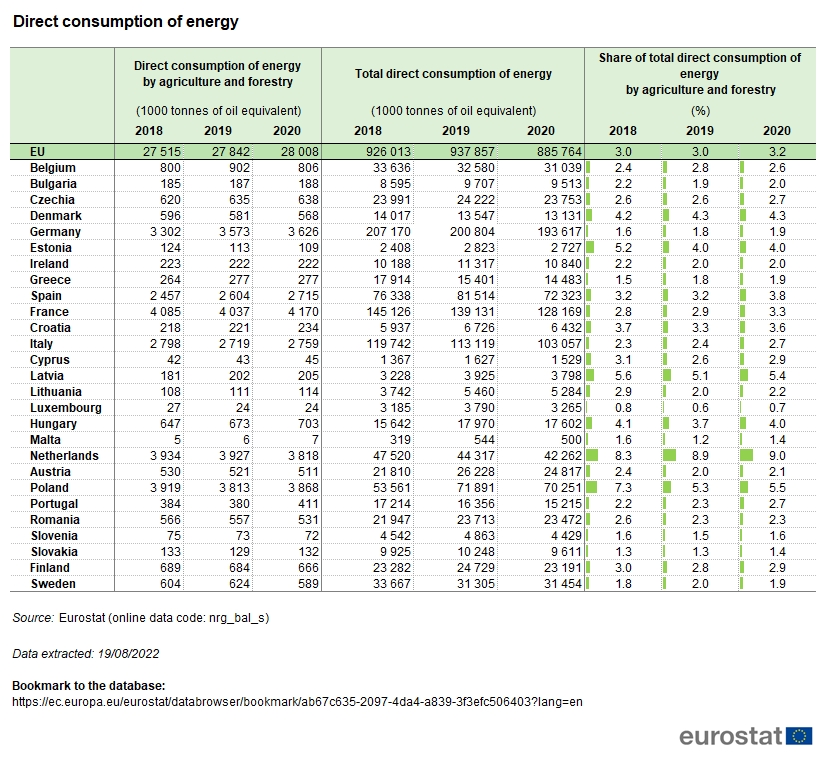
Direct consumption of energy.png
(
file
)
86 KB
1
17:11, 27 September 2022
EU labour market data Q2 2022.xlsx
(
file
)
84 KB
1
17:03, 27 September 2022
Employment, unemployment and labour market slack (age group 20 to 64, seasonally adjusted data), 2022Q2.png
(
file
)
94 KB
1
16:52, 27 September 2022
Change in the unemployment rate (age group 20-64, seasonally adjusted data), 2022Q2 compared with 2022Q1 (percentage point).png
(
file
)
55 KB
1
16:39, 27 September 2022
Change in the labour market slack and employment rate (age group 20-64, seasonally adjusted data), 2022Q2 compared with 2022Q1 (percentage point).png
(
file
)
70 KB
1
14:57, 27 September 2022
Change in the labour market slack and employment rate (age group 20-64, seasonally adjusted data), Q2 2022 compared with Q1 2022 (percentage point).png
(
file
)
70 KB
1
14:54, 26 September 2022
2022-Air pollution-figures.xlsx
(
file
)
25 KB
2
14:49, 26 September 2022
Emissions of air pollutants, EU, 1990-2020 (Index 1990=100, except for PM2 5 Index 2000=100).png
(
file
)
86 KB
1
14:45, 26 September 2022
Air pollution - emission inventories interactive September 2022.xlsx
(
file
)
14 KB
1
First page
Previous page
Next page
Last page
Special page
ISSN 2443-8219
.png)
.png)
_v3.png)
_v3.png)

.png)
.png)
.png)
.png)
.png)
.png)
.png)
.png)

_v2.png)

.png)
_(%25_of_total_expenditure).png)
.png)
.png)
_,_2011-2020_(%25).png)
,_2011-2020_(%25).png)
_.png)
_.png)


.png)


.png)

,_2022Q2.png)
,_2022Q2_compared_with_2022Q1_(percentage_point).png)
,_2022Q2_compared_with_2022Q1_(percentage_point).png)
,_Q2_2022_compared_with_Q1_2022_(percentage_point).png)
.png)