Tutorials
Log in
Statistics Explained
menu
search
search
Navigation
Main page
Statistical themes
Glossary
Categories
Statistics 4 beginners
Tutorials
Help
Eurostat home
Education corner
Online publications
Regional yearbook
Sustainable development
Full list
Tools
User contributions
Logs
View user groups
Special pages
search
Navigation
Main page
Statistical themes
Glossary
Categories
Statistics 4 beginners
Tutorials
Help
Eurostat home
Education corner
Online publications
Regional yearbook
Sustainable development
Full list
Tools
User contributions
Logs
View user groups
Special pages
Navigation
Main page
Statistical themes
Glossary
Categories
Statistics 4 beginners
Tutorials
Help
Eurostat home
Education corner
Online publications
Regional yearbook
Sustainable development
Full list
Tools
User contributions
Logs
View user groups
Special pages
Uploads by Niculco
This special page shows all uploaded files.
File list
Items per page:
20
50
100
250
500
Search for media name:
Username:
Include old versions of files
Go
Date
Name
Thumbnail
Size
Description
Versions
14:40, 22 February 2016
High-tech statistics - tables and figures - 2016-02-22.xlsx
(
file
)
119 KB
1
14:26, 22 February 2016
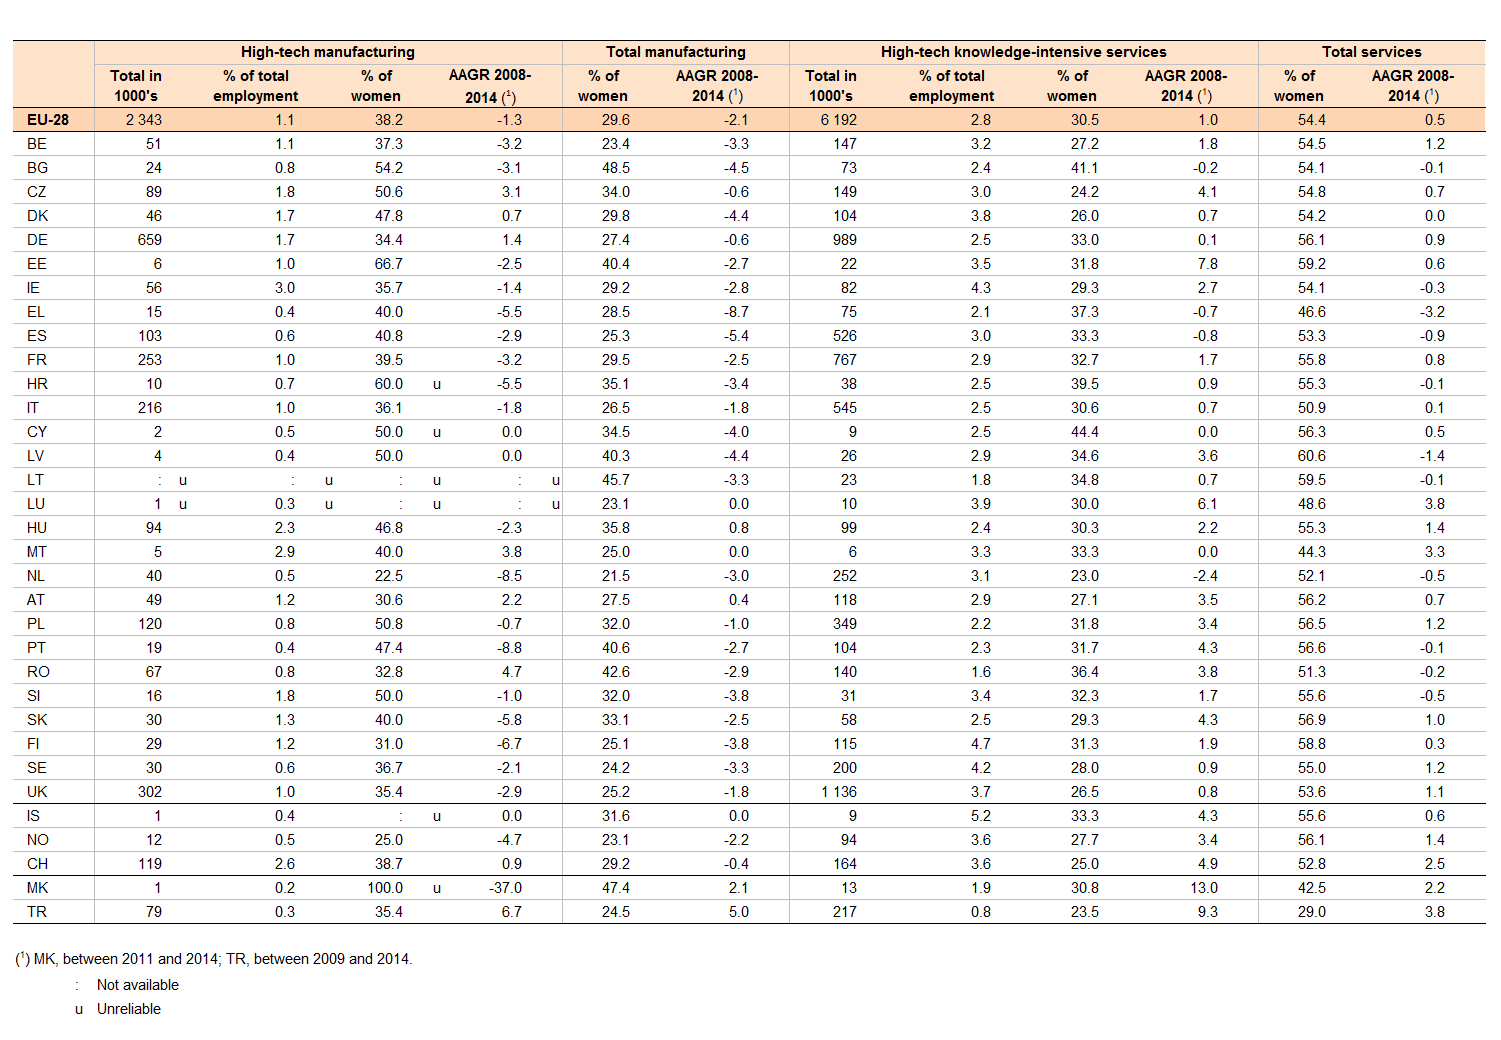
Employment in high-tech sectors, EU-28 and selected countries, 2014.png
(
file
)
72 KB
3
14:25, 22 February 2016
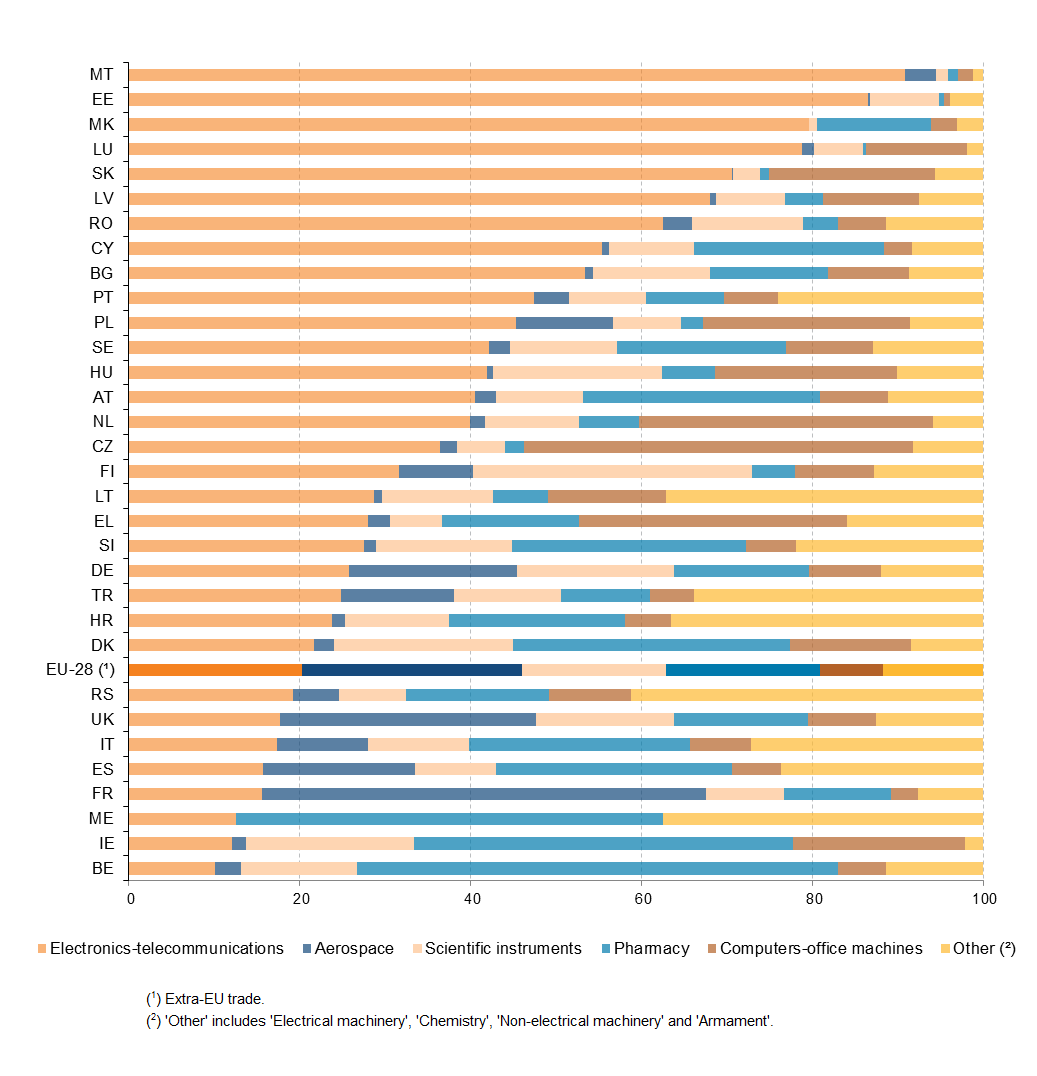
High-tech exports by high-technology group of products, EU-28 and selected countries, 2014, in %.png
(
file
)
38 KB
2
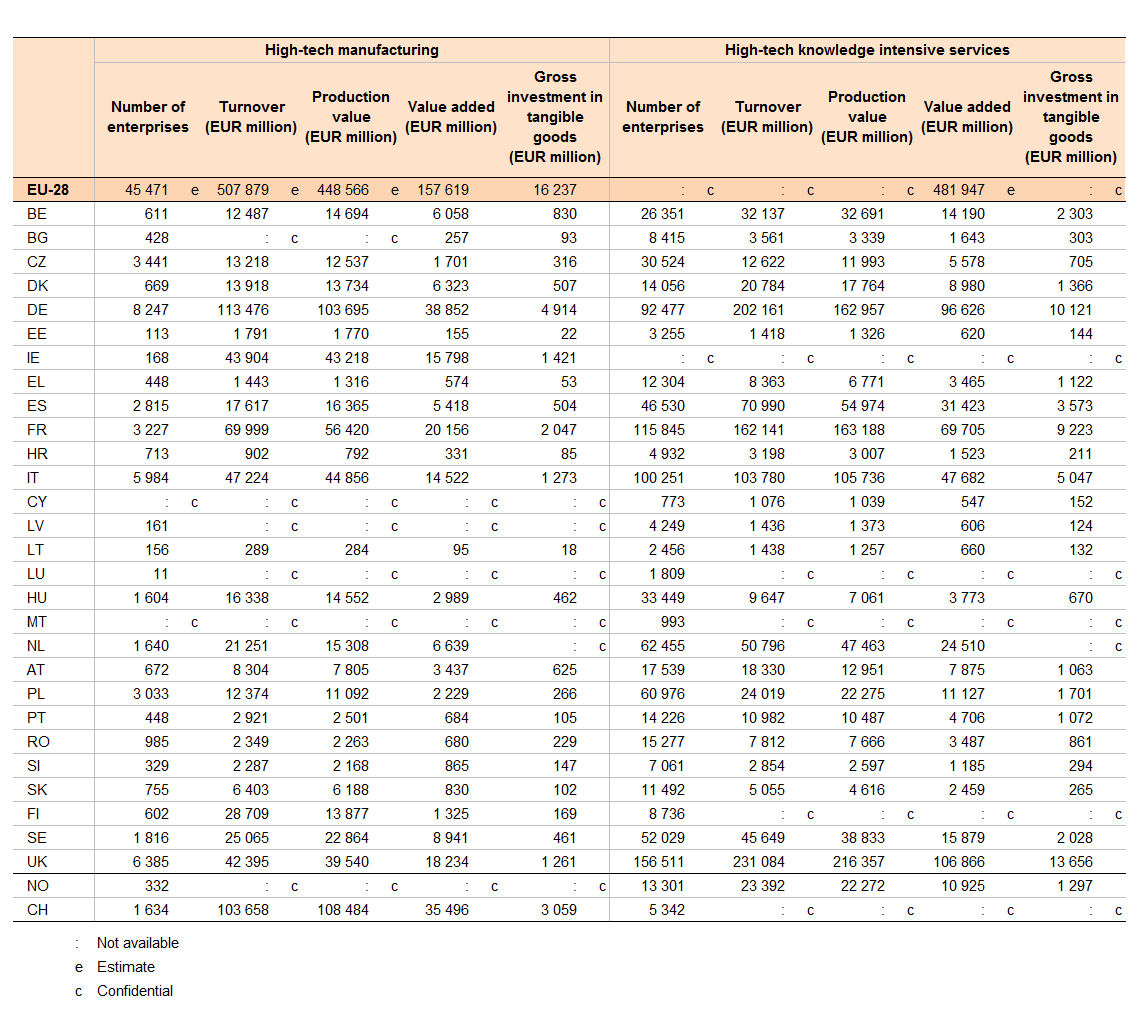
14:24, 22 February 2016
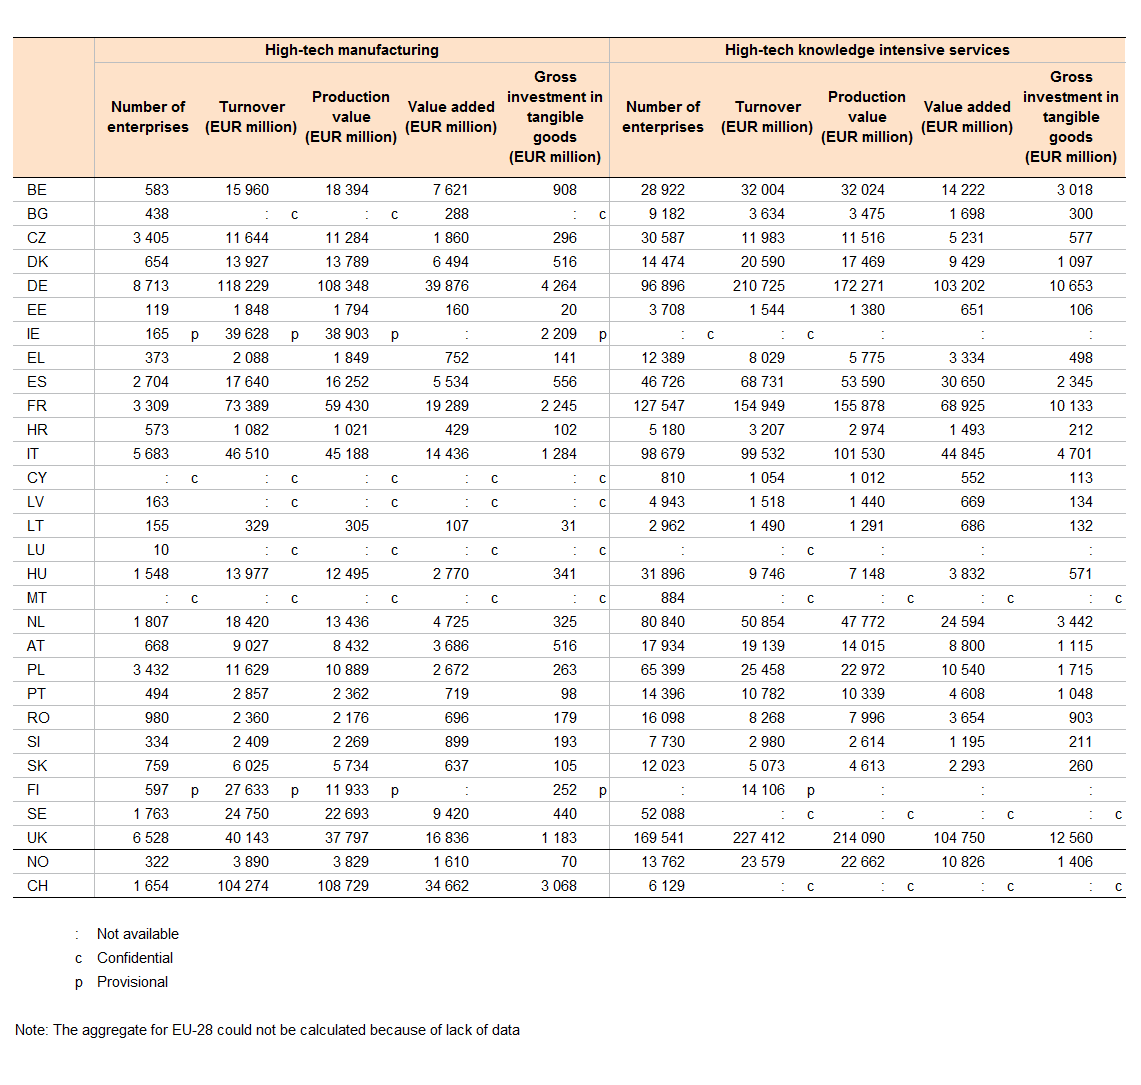
Economic statistics on high-tech sectors EU28 2013.png
(
file
)
68 KB
2
15:07, 18 February 2016
High-tech statistics - tables and figures.xlsx
(
file
)
118 KB
1
15:02, 18 February 2016
Regional disparities in employment in high-tech sectors as a percentage of total employment (NUTS 2 level), 2014 (1)(2).png
(
file
)
157 KB
2
17:53, 2 February 2016
High-tech statistics - economic data table and figures.xlsx
(
file
)
50 KB
1
17:51, 2 February 2016
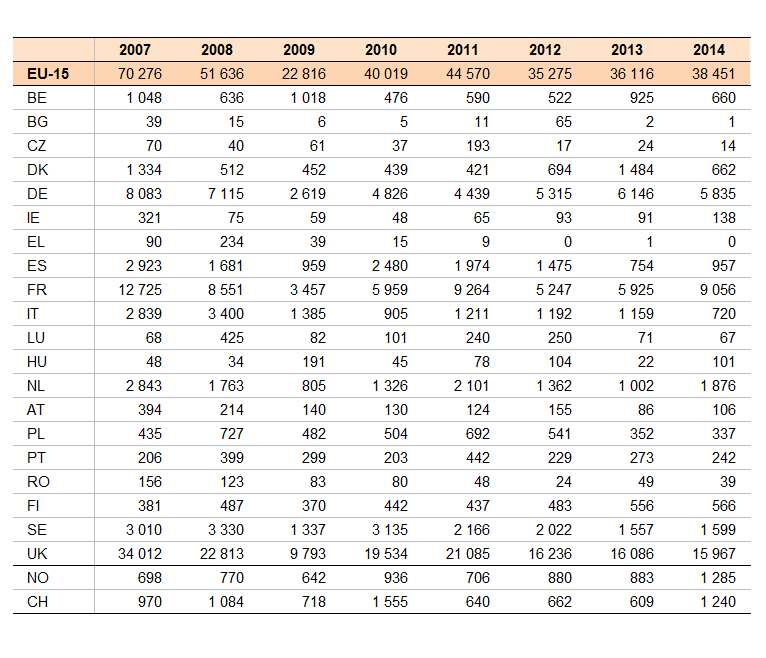
Total venture capital investment (VCI), in millions of euros.png
(
file
)
32 KB
1
17:47, 2 February 2016
Average annual growth rate of R&D expenditure in business enterprises, 2005-2013 (1)(2).png
(
file
)
33 KB
1
17:39, 2 February 2016
Economic statistics on high-tech sectors in 2012.png
(
file
)
68 KB
1
15:36, 1 February 2016
High-tech statistics - employment.xlsx
(
file
)
103 KB
1
15:35, 1 February 2016
Employment in high-tech sectors, EU-28 and selected countries, 2014.2.png
(
file
)
74 KB
1
15:15, 1 February 2016
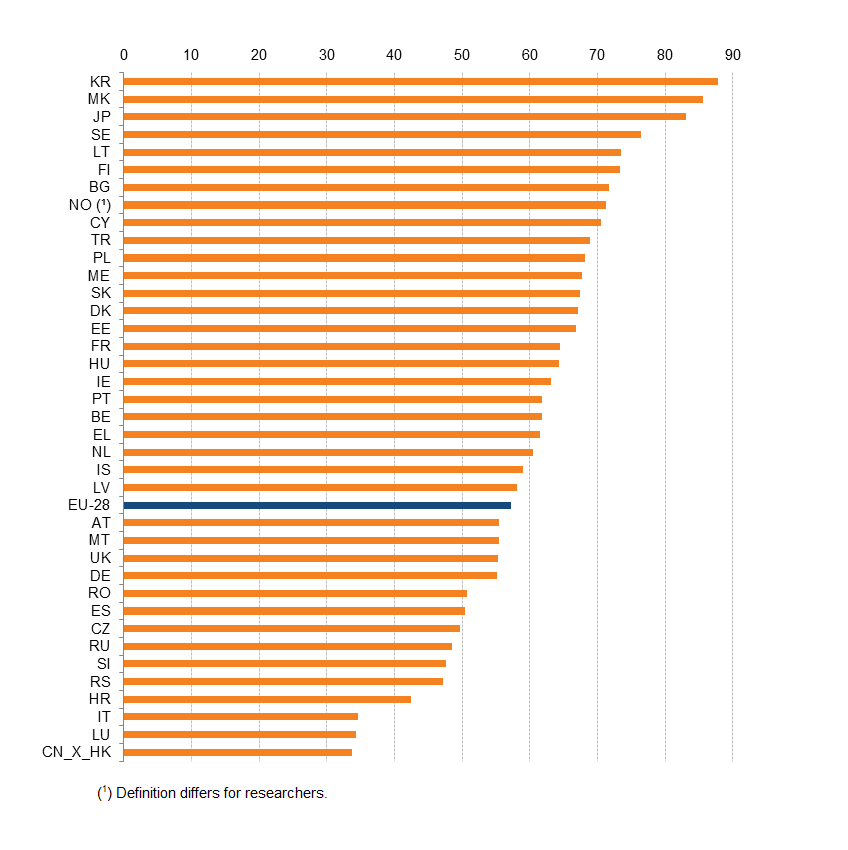
Researchers as a percentage of R&D personnel in business enterprise sectors in 2013, in %.png
(
file
)
26 KB
1
15:13, 1 February 2016
Average annual growth rate of employment in KIA in 2008-2014 (1), in %.png
(
file
)
33 KB
1
11:29, 18 January 2016
HRST Flows table and figures.xlsx
(
file
)
47 KB
1
17:47, 15 January 2016
Distribution of job-to-job mobility in total KIS sector and in total NACE activities, 2013, in %.png
(
file
)
38 KB
1
17:45, 15 January 2016
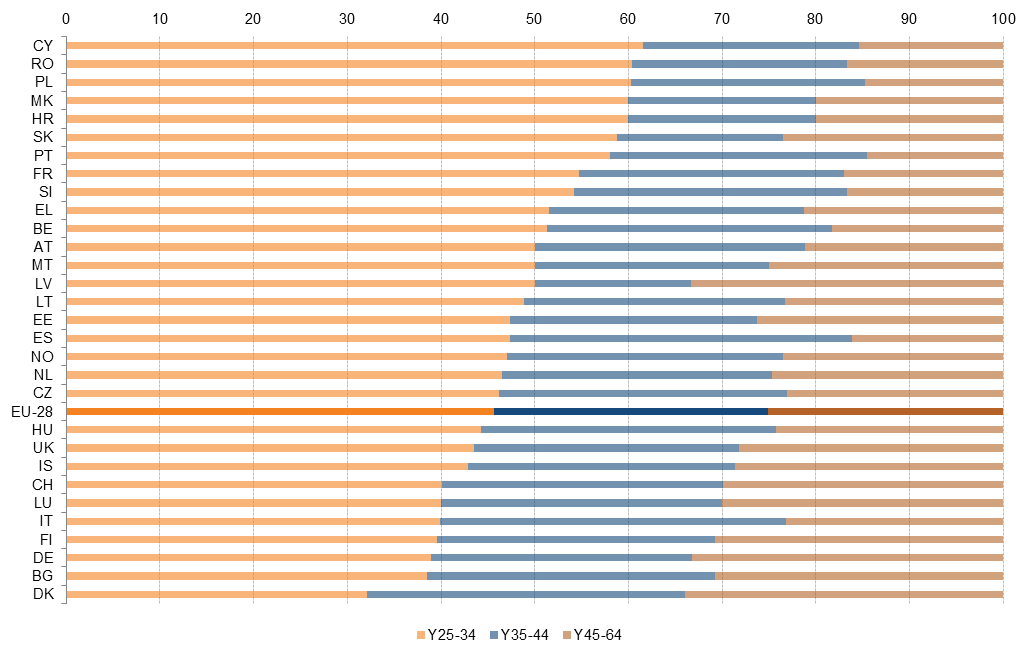
Distribution of job-to-job mobility by age group, 2013, in %.png
(
file
)
27 KB
1
17:42, 15 January 2016
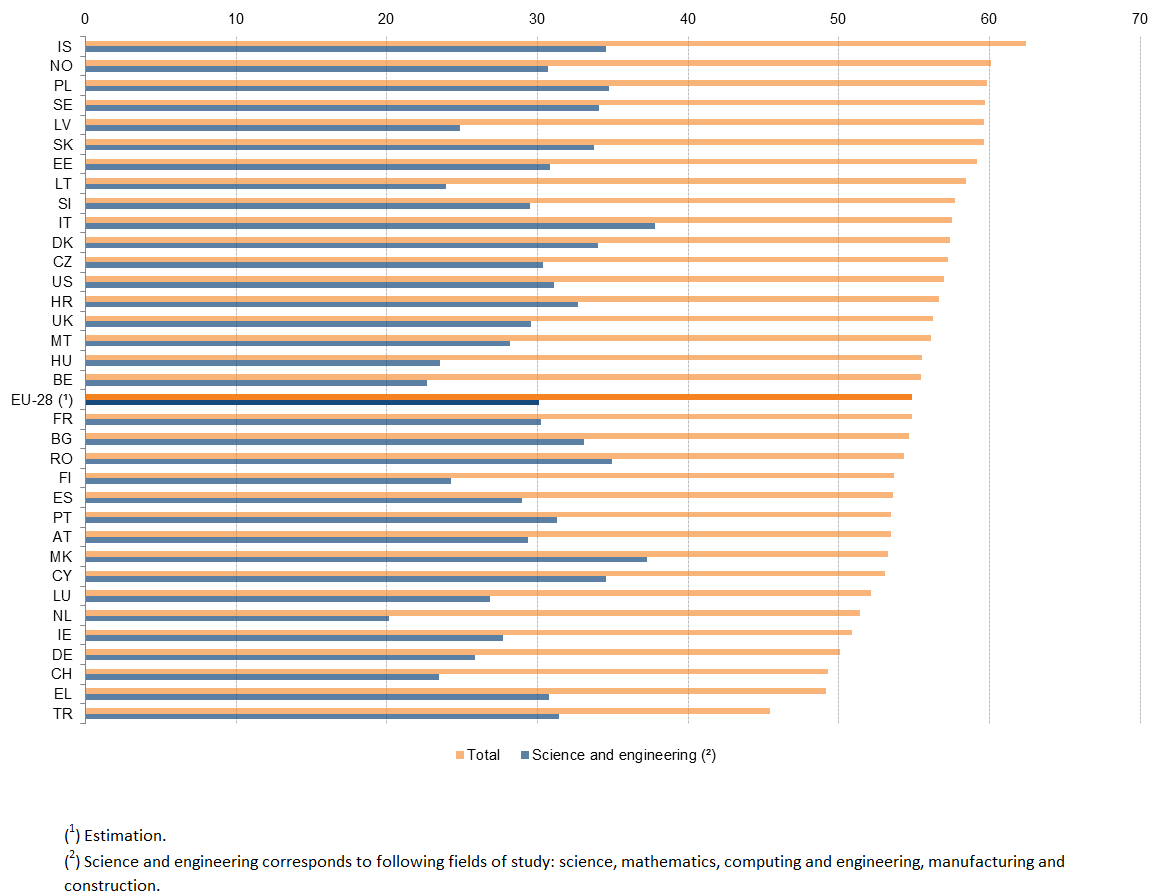
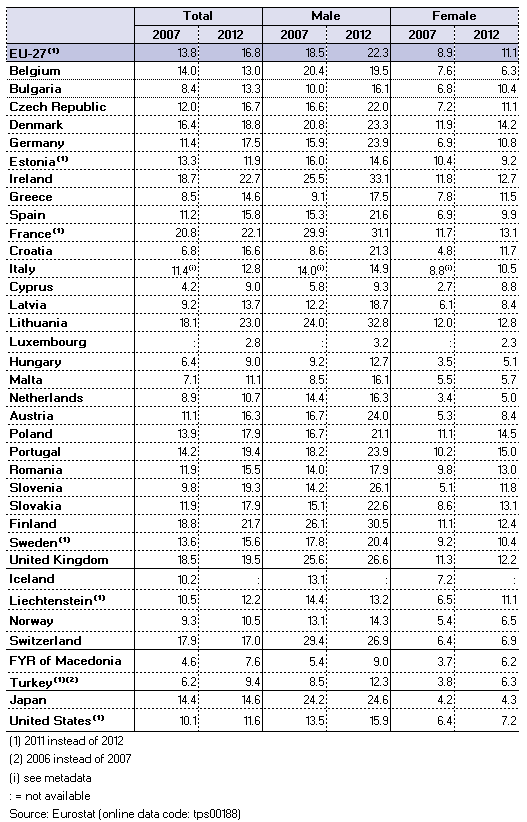
Share of female students in tertiary education, 2012, in %.png
(
file
)
34 KB
1
16:08, 15 January 2016
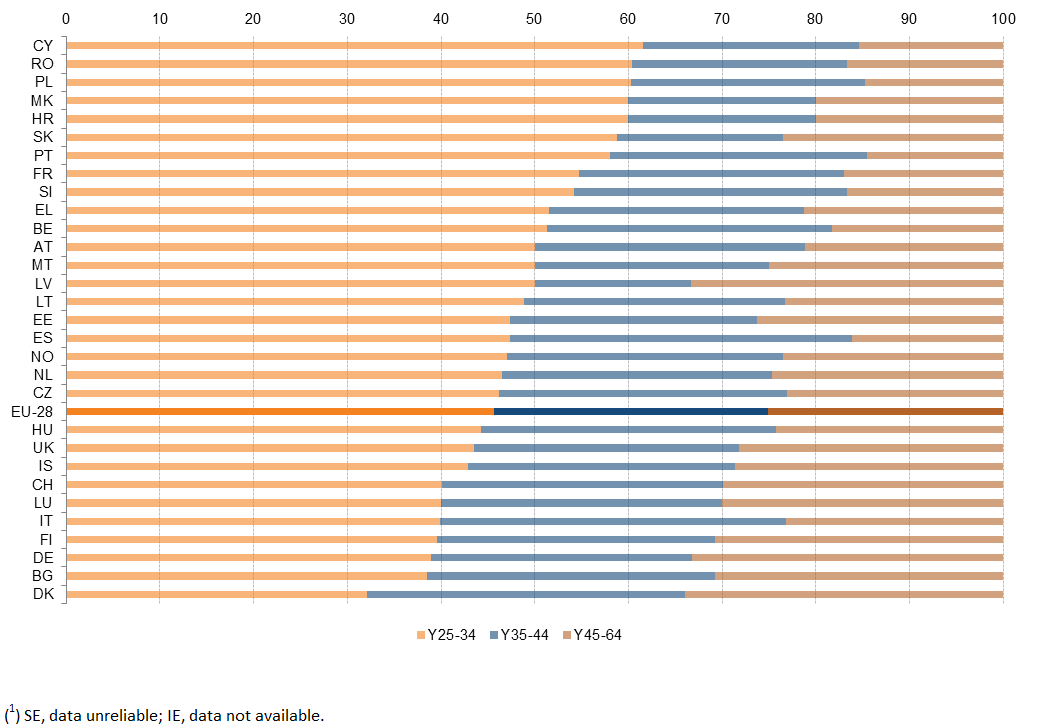
Distribution of job-to-job mobility by age group, in 2013 (¹).png
(
file
)
30 KB
1
16:05, 15 January 2016
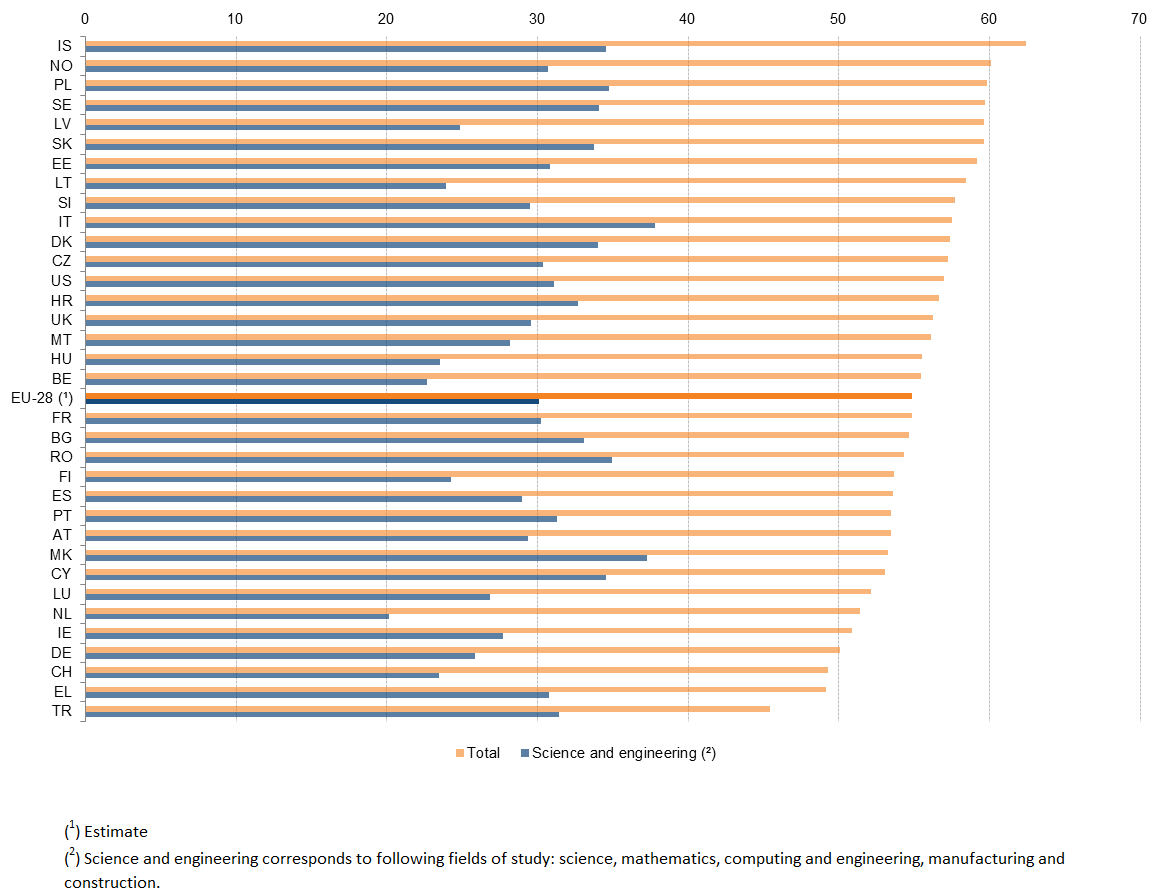
Share of female students in tertiary education in 2012, in %.png
(
file
)
34 KB
1
15:55, 15 January 2016
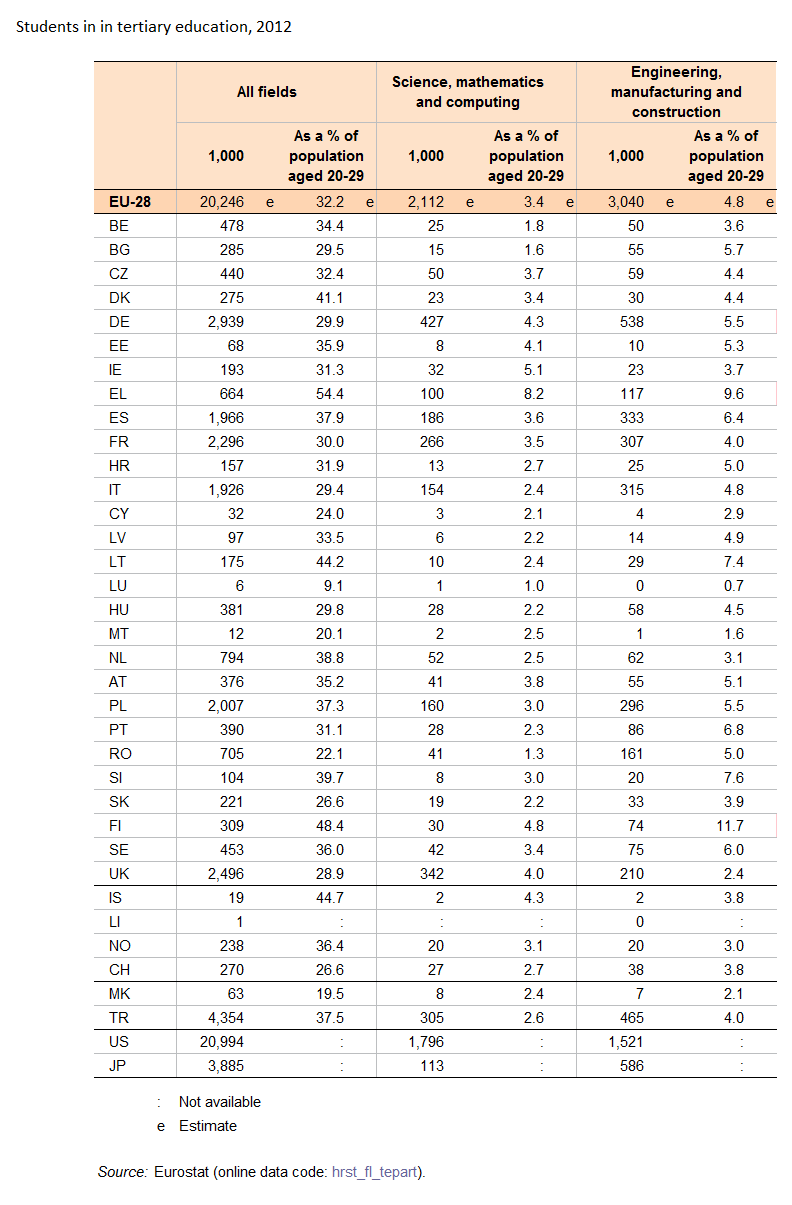
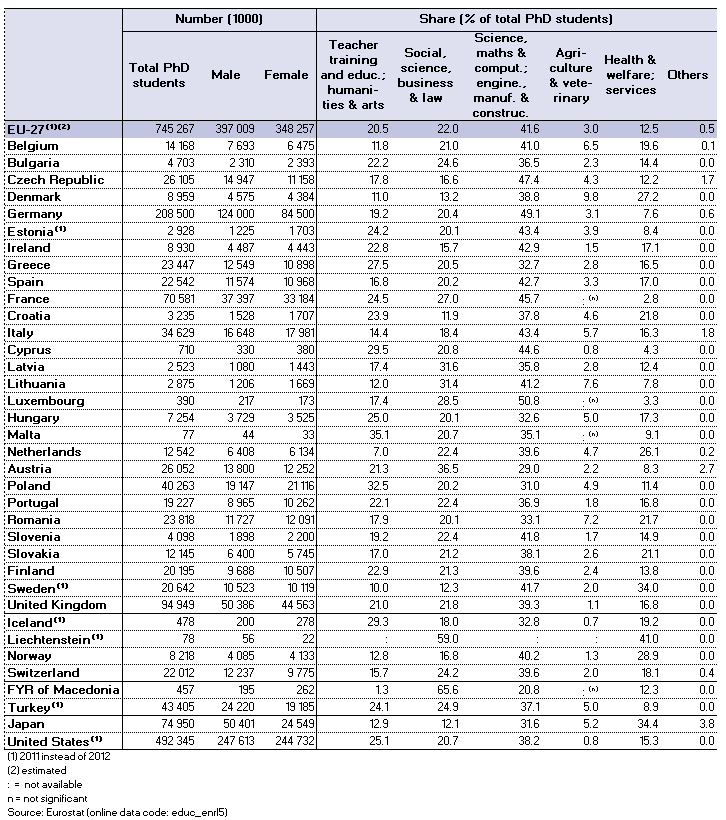
Students in tertiary education, 2012.png
(
file
)
47 KB
1
15:35, 15 January 2016
Students in in tertiary education, 2012.png
(
file
)
53 KB
3
16:10, 17 December 2015
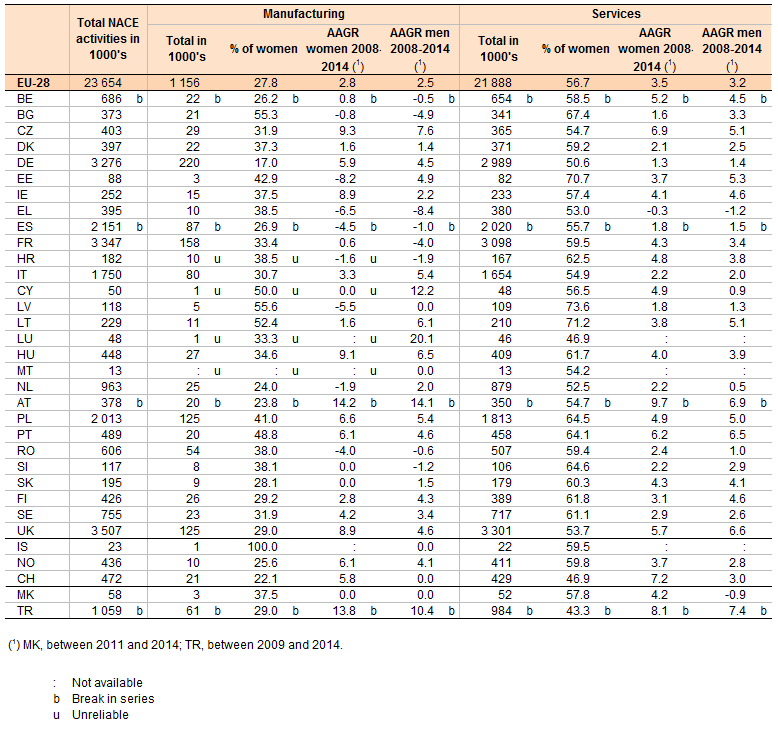
Tab1-Employment women tertiary education HRSTC 2014.png
(
file
)
55 KB
3
16:46, 29 April 2014
R&D personnel YB2014.xls
(
file
)
73 KB
1
15:20, 29 April 2014
Gender analysis of researchers in all institutional sectors, 2011 (1) (% of total researchers, based on HC).png
(
file
)
9 KB
1
15:17, 29 April 2014
Gender analysis of researchers in all institutional sectors, 2009 (1) (% of total researchers, based on FTEs).png
(
file
)
9 KB
2
15:16, 29 April 2014
Proportion of research and development personnel by sector, 2012 (1) (% of labour force).png
(
file
)
8 KB
1
15:14, 29 April 2014
Proportion of research and development personnel by sector, 2010 (1) (% of labour force).png
(
file
)
8 KB
3
15:12, 29 April 2014
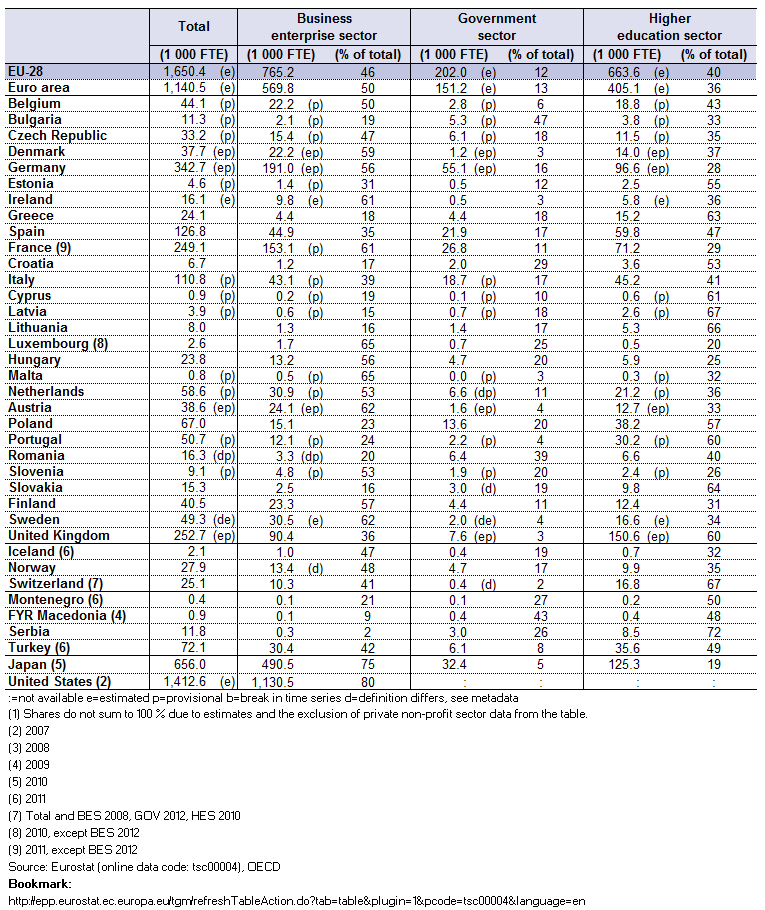
Researchers in full-time equivalents (FTE), by institutional sector, 2012 (1).png
(
file
)
43 KB
1
15:10, 29 April 2014
Researchers in full-time equivalents (FTE), by institutional sector, 2010 (1).png
(
file
)
43 KB
2
17:59, 10 April 2014
PhD students (ISCED97 level 6), 2012.png
(
file
)
25 KB
2
17:57, 10 April 2014
Science and technology graduates, 2007 and 2012 (tertiary graduates in science and technology per 1 000 persons aged 20-29 years).png
(
file
)
17 KB
2
17:56, 10 April 2014
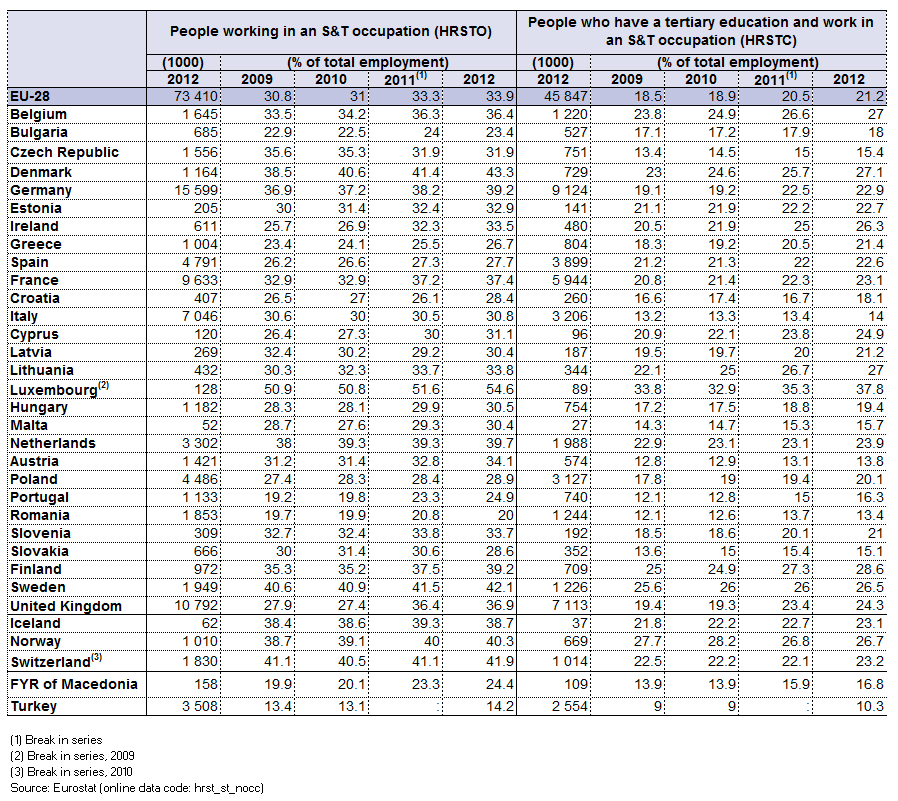
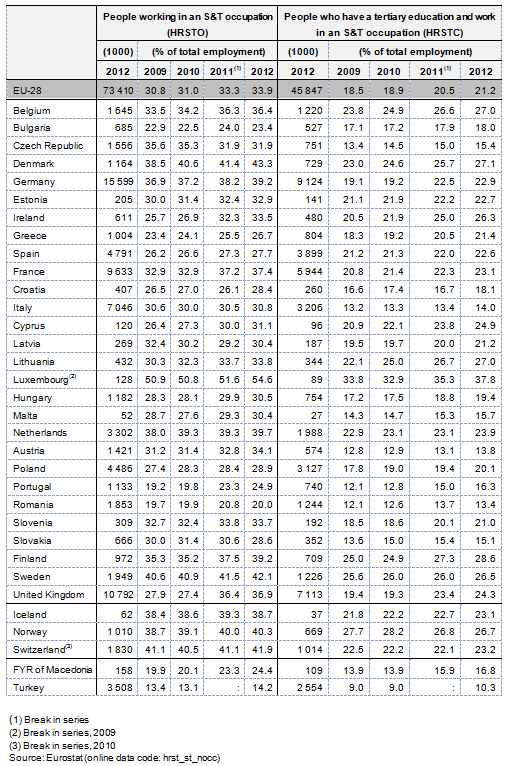
Human resources in science and technology, 2009-2012.png
(
file
)
48 KB
2
11:03, 9 April 2014
Human resources in science and technology, 2008-2011.png
(
file
)
32 KB
Human_resources_in_science_and_technology,_2009-2012.png
3
Special page
ISSN 2443-8219


,_2014_(1)(2).png)
,_in_millions_of_euros.png)
(2).png)


,_in_%25.png)


.png)


_(%25_of_total_researchers,_based_on_HC).png)
_(%25_of_total_researchers,_based_on_FTEs).png)
_(%25_of_labour_force).png)
_(%25_of_labour_force).png)
,_by_institutional_sector,_2012_(1).png)
,_by_institutional_sector,_2010_(1).png)
,_2012.png)
.png)

