Tutorials
Log in
Statistics Explained
menu
search
search
Navigation
Main page
Statistical themes
Glossary
Categories
Statistics 4 beginners
Tutorials
Help
Eurostat home
Education corner
Online publications
Regional yearbook
Sustainable development
Full list
Tools
User contributions
Logs
View user groups
Special pages
search
Navigation
Main page
Statistical themes
Glossary
Categories
Statistics 4 beginners
Tutorials
Help
Eurostat home
Education corner
Online publications
Regional yearbook
Sustainable development
Full list
Tools
User contributions
Logs
View user groups
Special pages
Navigation
Main page
Statistical themes
Glossary
Categories
Statistics 4 beginners
Tutorials
Help
Eurostat home
Education corner
Online publications
Regional yearbook
Sustainable development
Full list
Tools
User contributions
Logs
View user groups
Special pages
Uploads by N008lw7e
This special page shows all uploaded files.
File list
Items per page:
20
50
100
250
500
Search for media name:
Username:
Include old versions of files
Go
First page
Previous page
Next page
Last page
Date
Name
Thumbnail
Size
Description
Versions
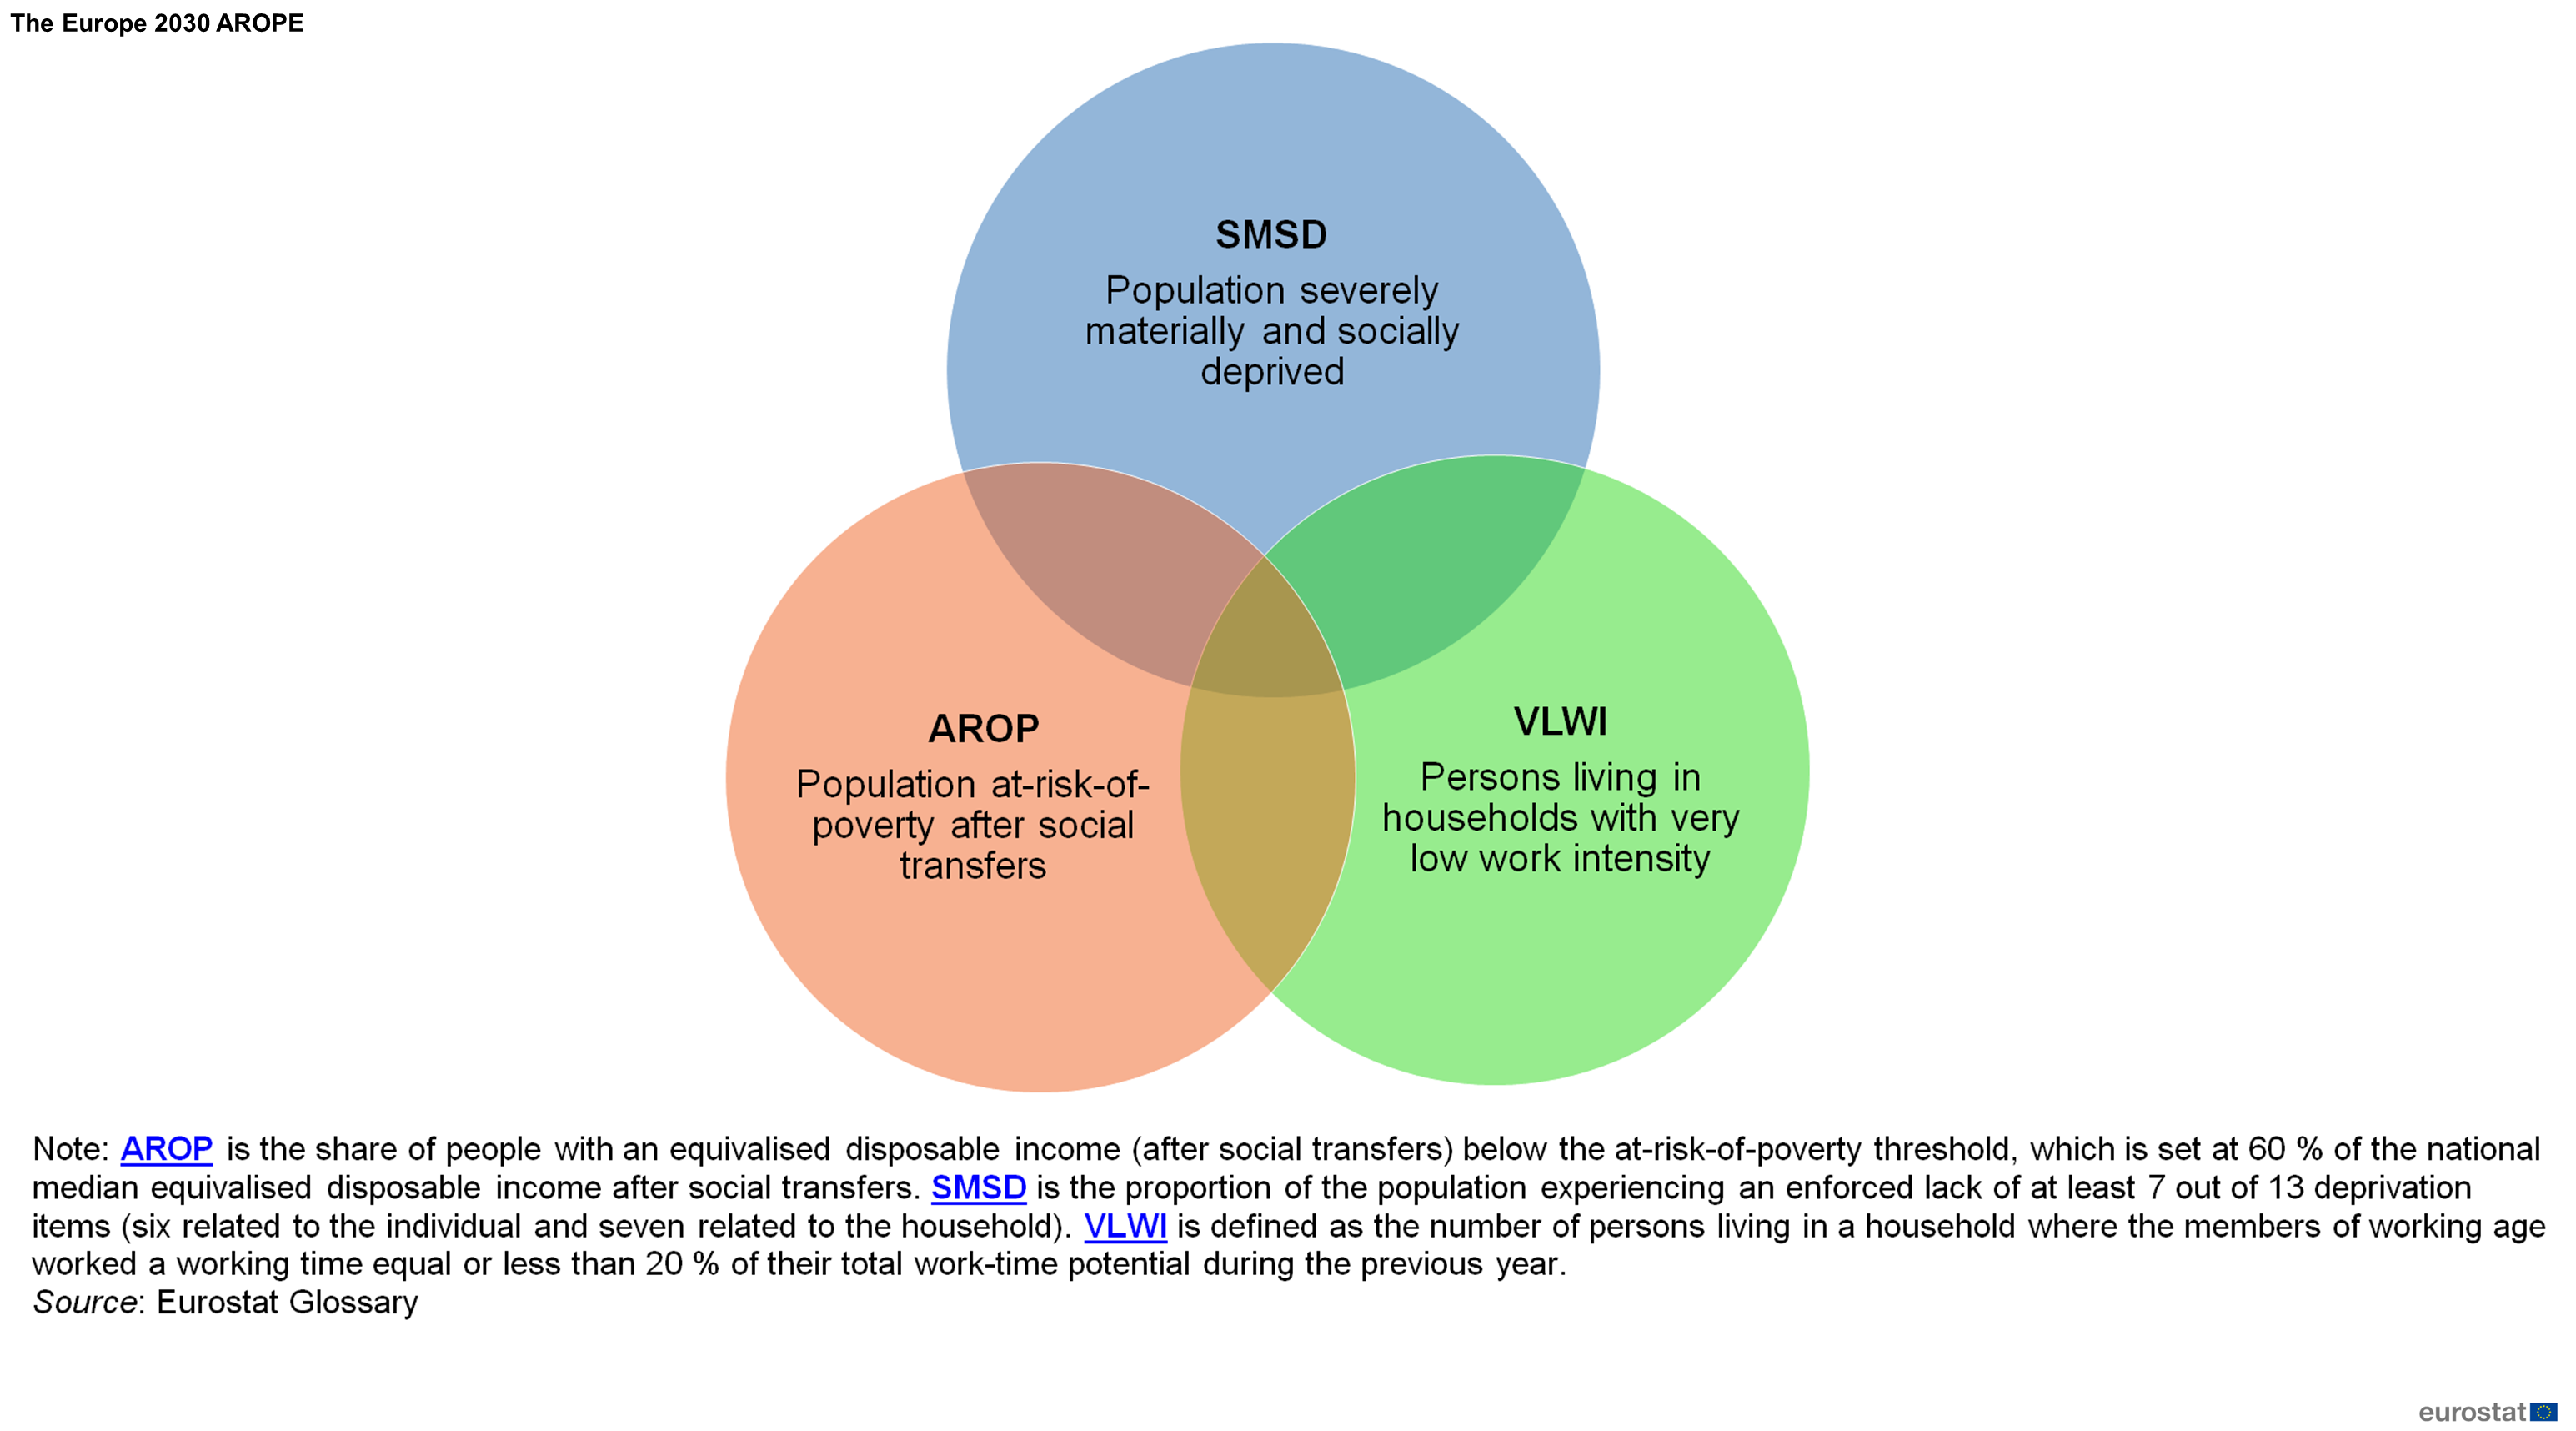
16:24, 1 February 2023
The Europe 2030 AROPE 1.png
(
file
)
454 KB
1
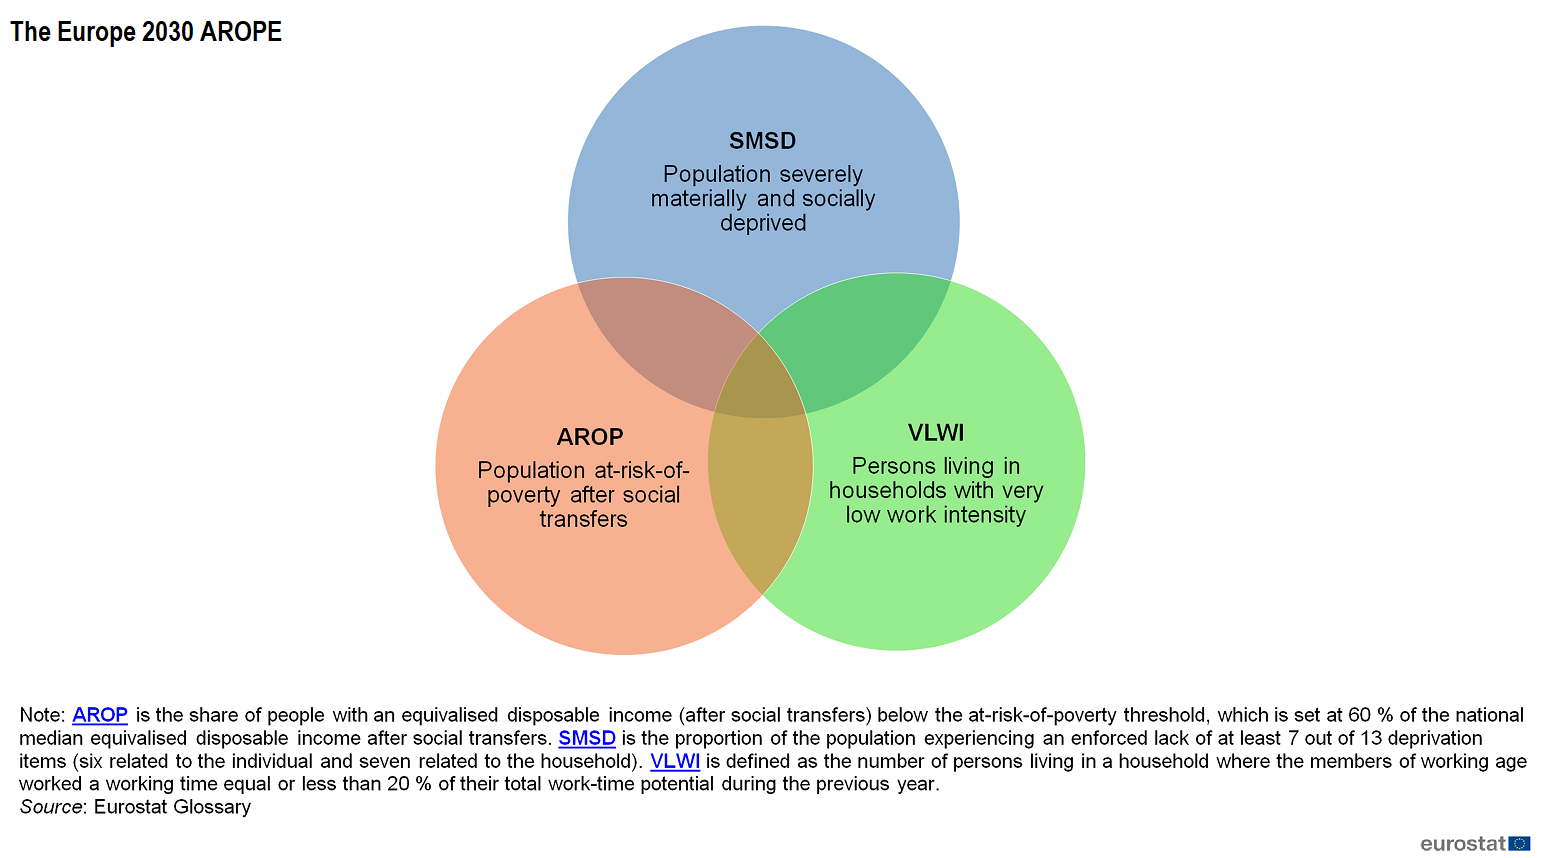
16:15, 1 February 2023
The Europe 2030 AROPE.png
(
file
)
181 KB
1
19:47, 9 January 2023
Income distribution and inequality LCIE 2023.xlsx
(
file
)
1.48 MB
1
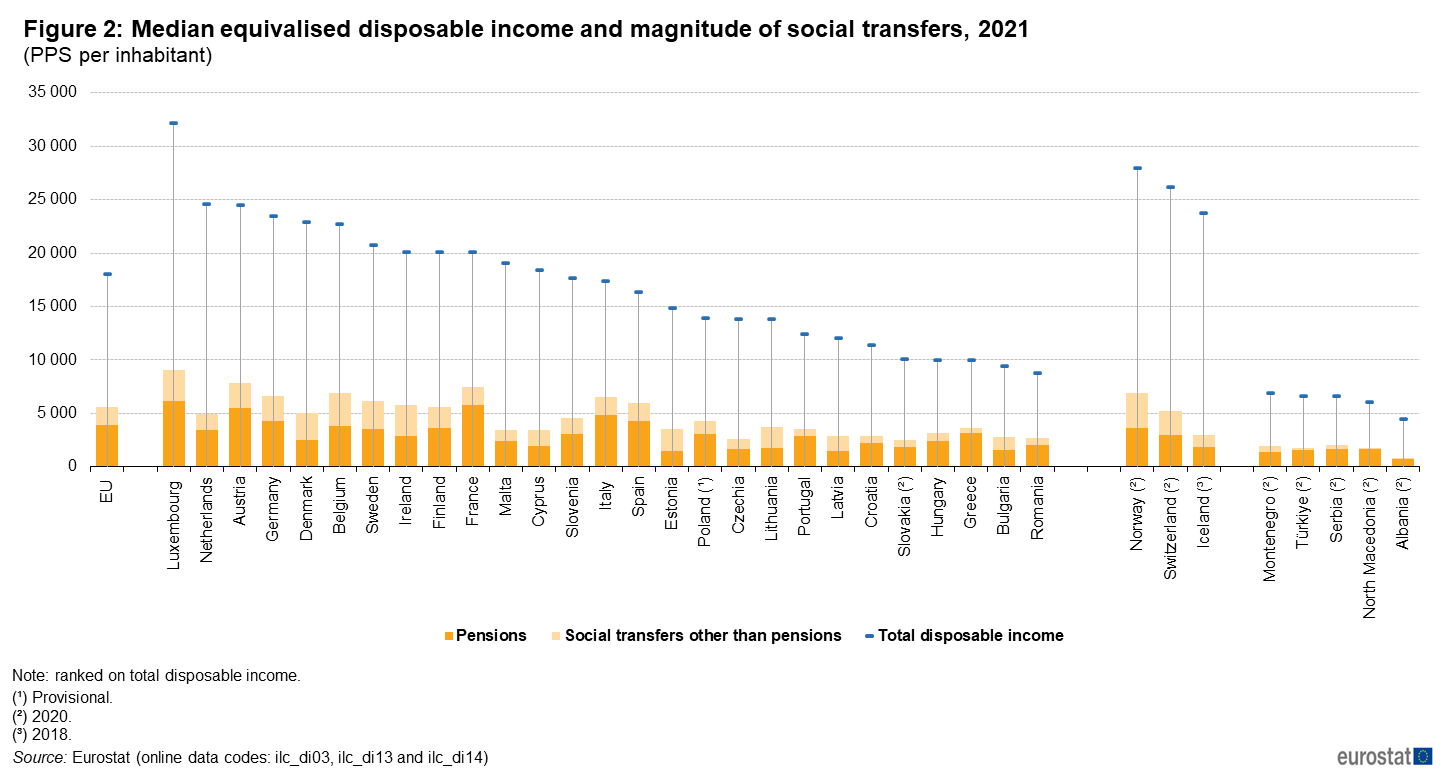
19:38, 9 January 2023
Median equivalised disposable income and magnitude of social transfers, 2021 .png
(
file
)
55 KB
1
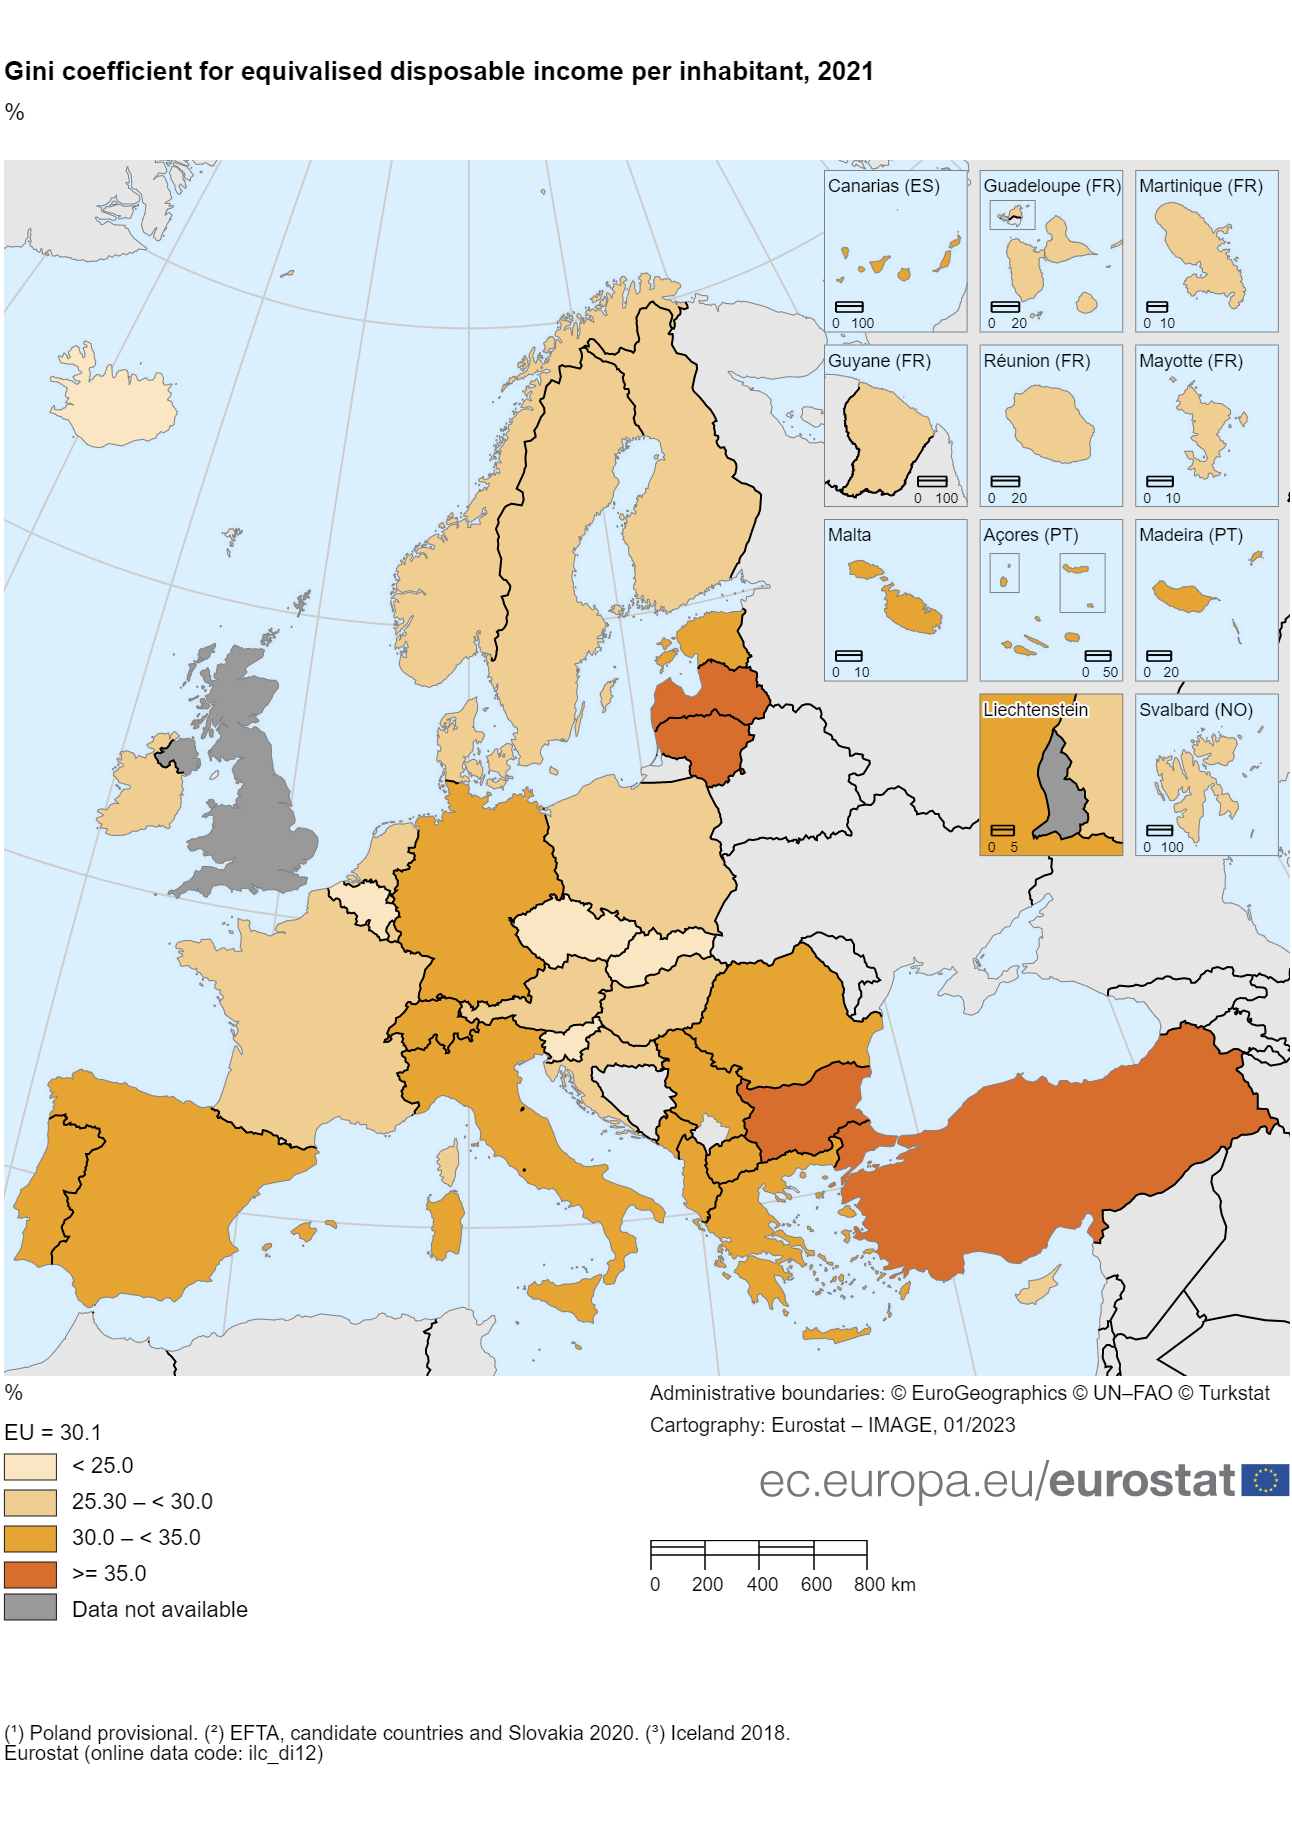
19:31, 9 January 2023
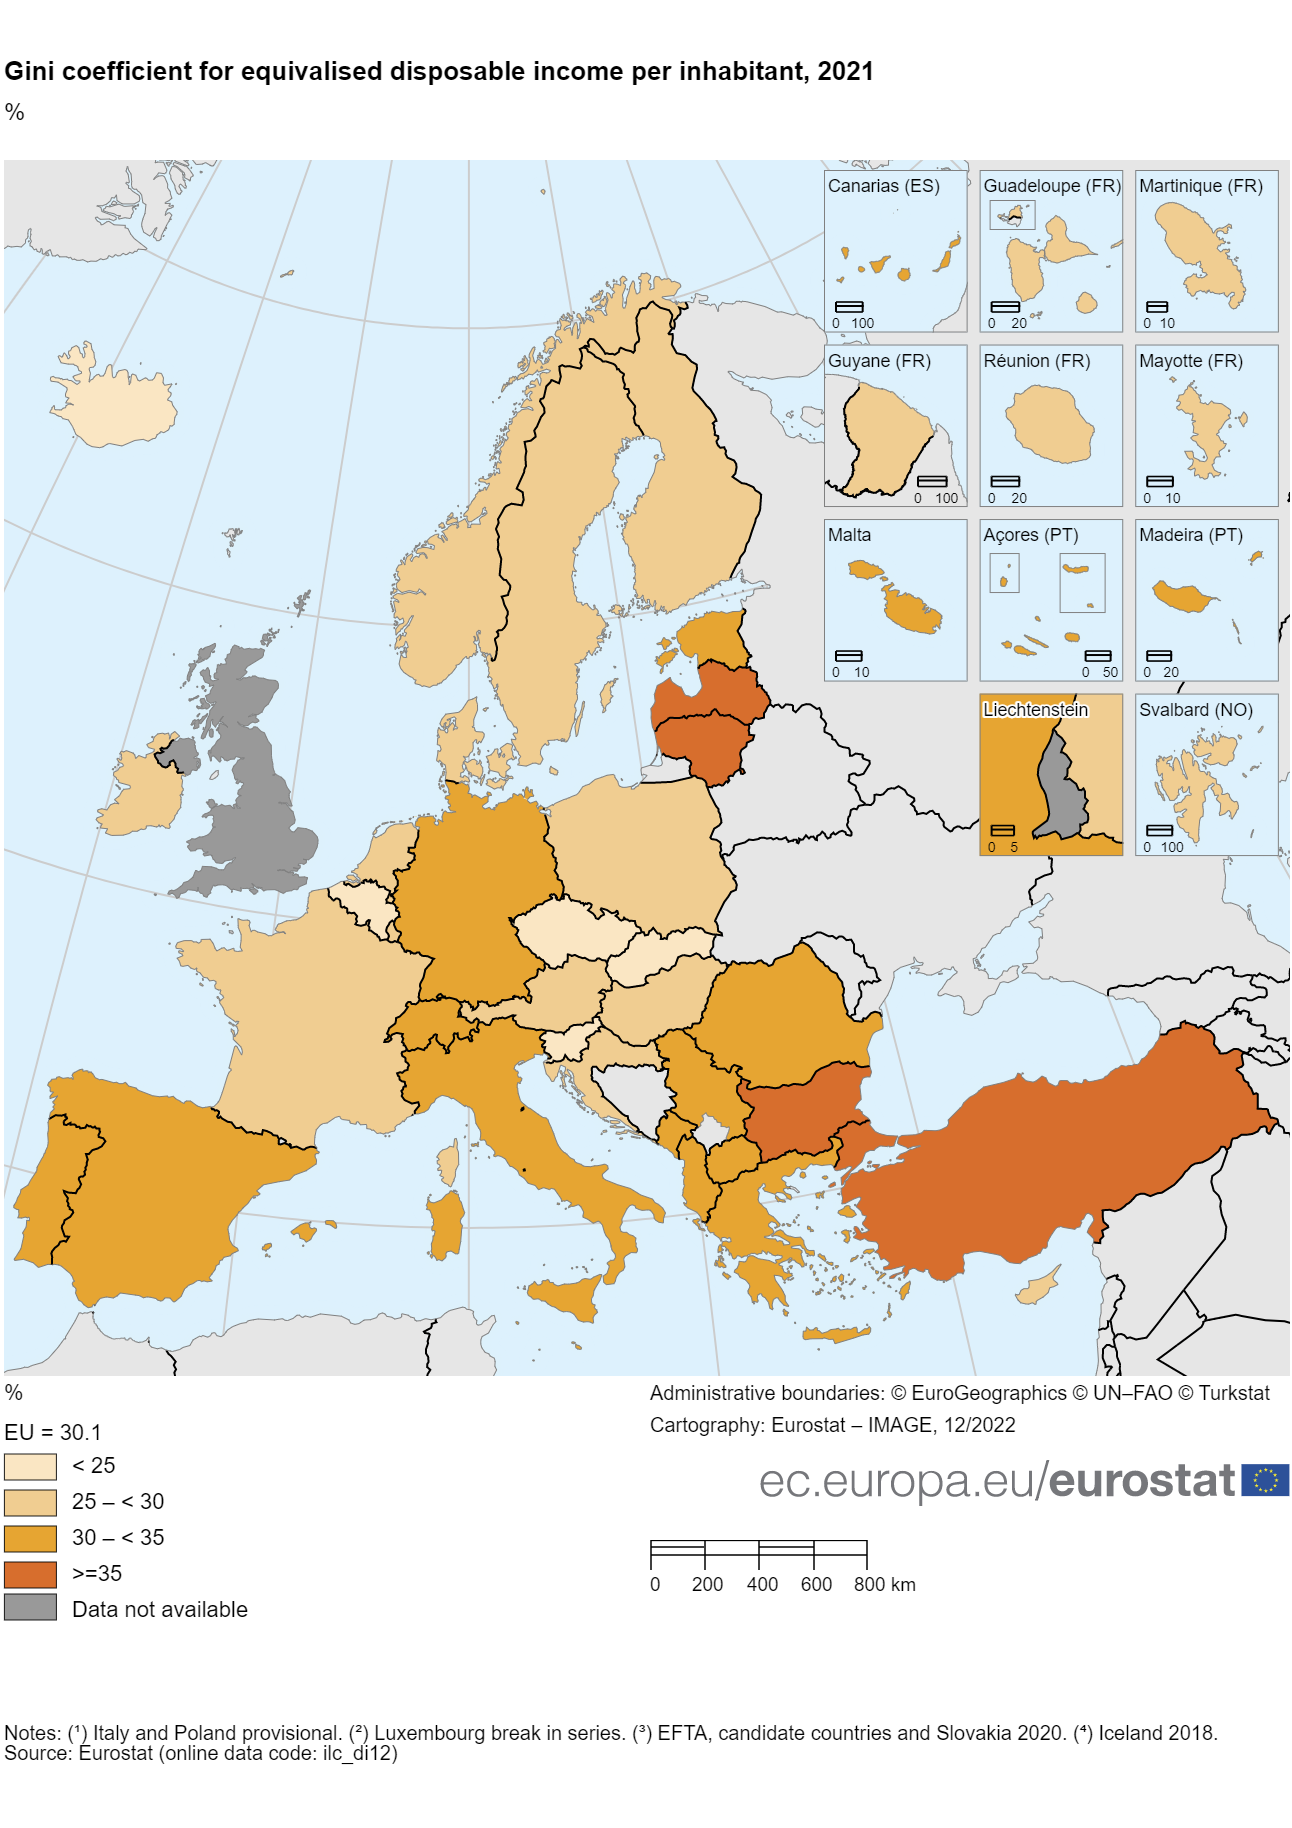
Map2 Gini coefficient for equivalised disp income per inhabitan 2021.png
(
file
)
712 KB
1
19:27, 9 January 2023
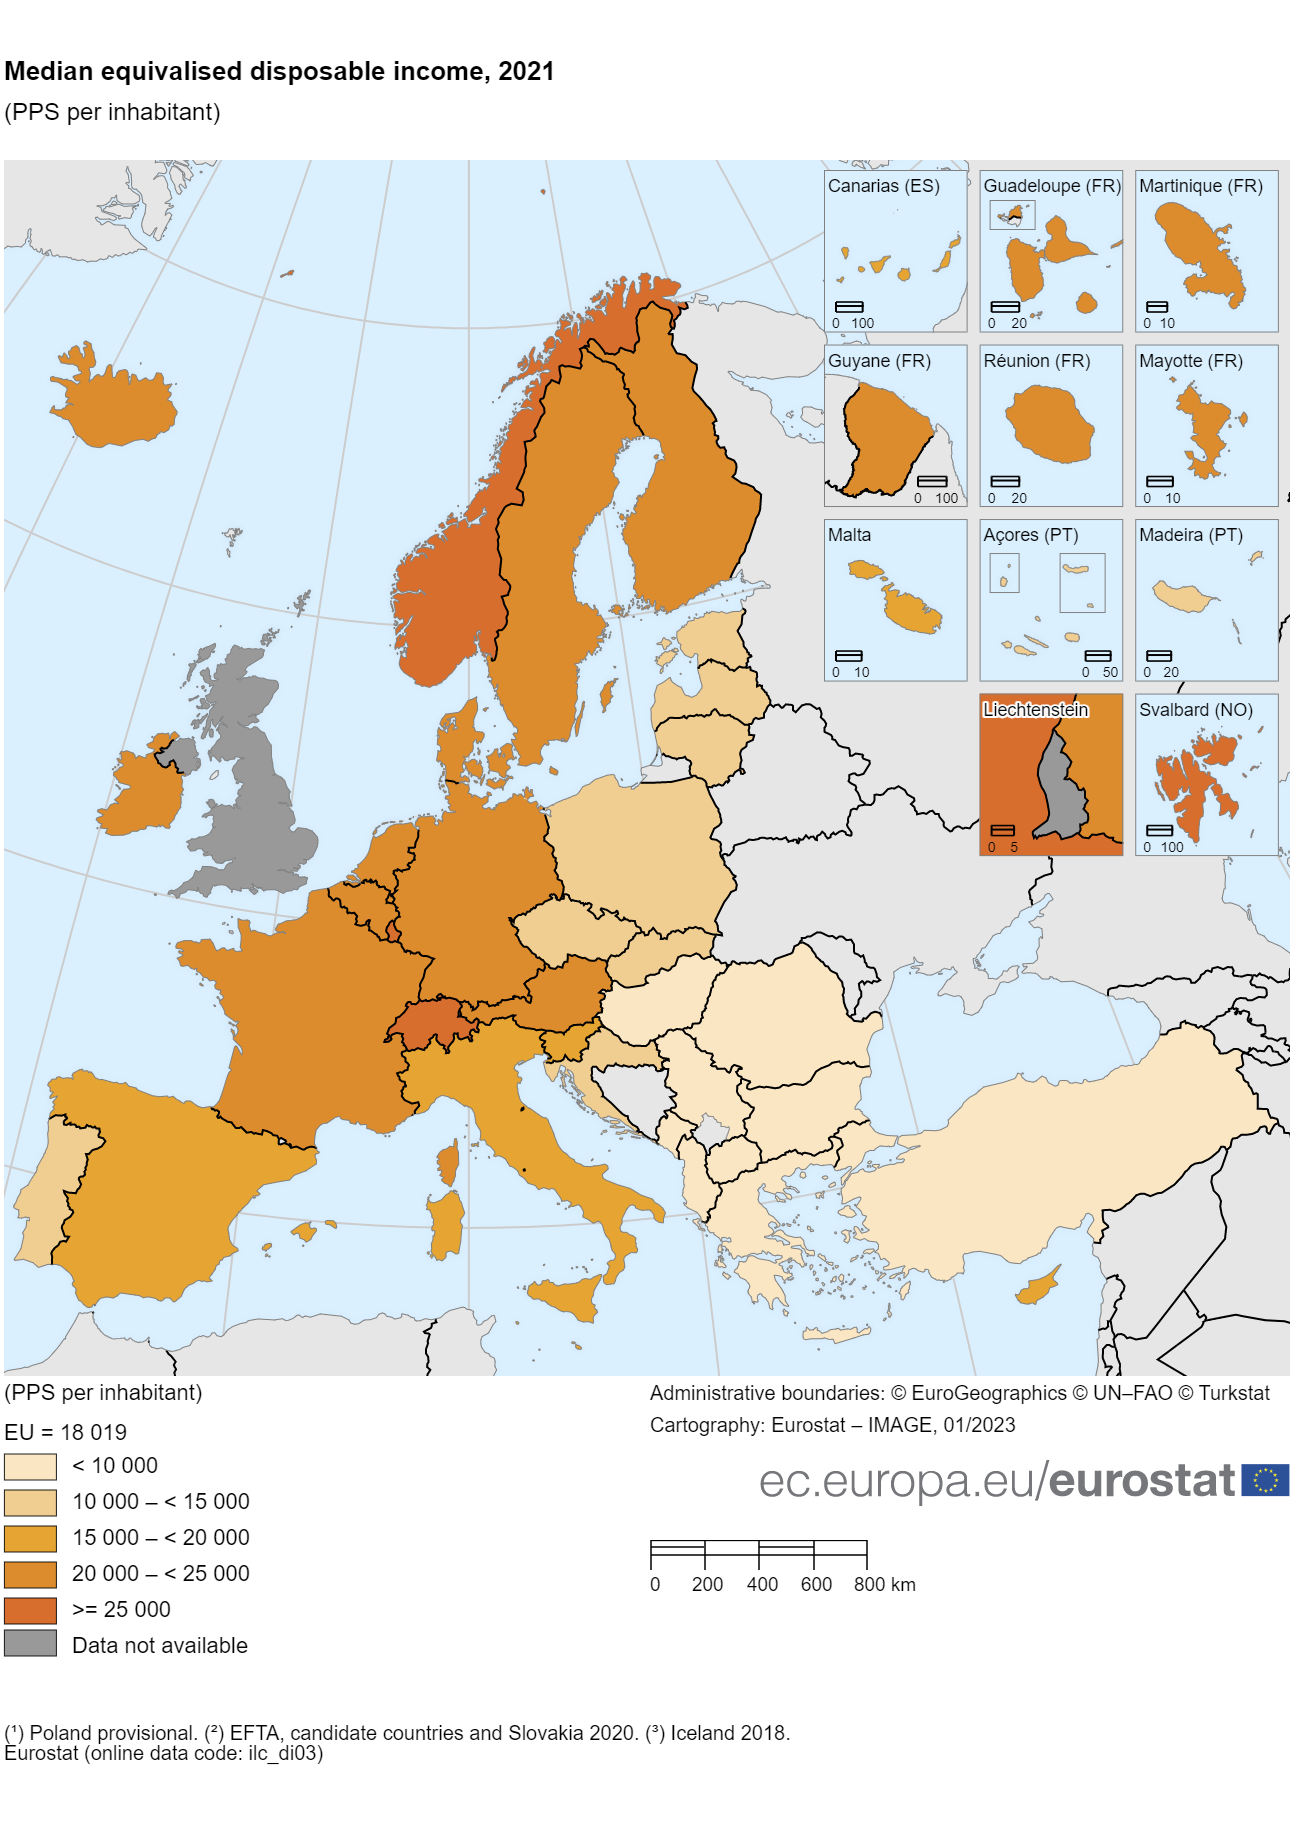
Map1.Median equivalised disposable income, 2021.png
(
file
)
721 KB
2
15:07, 8 January 2023
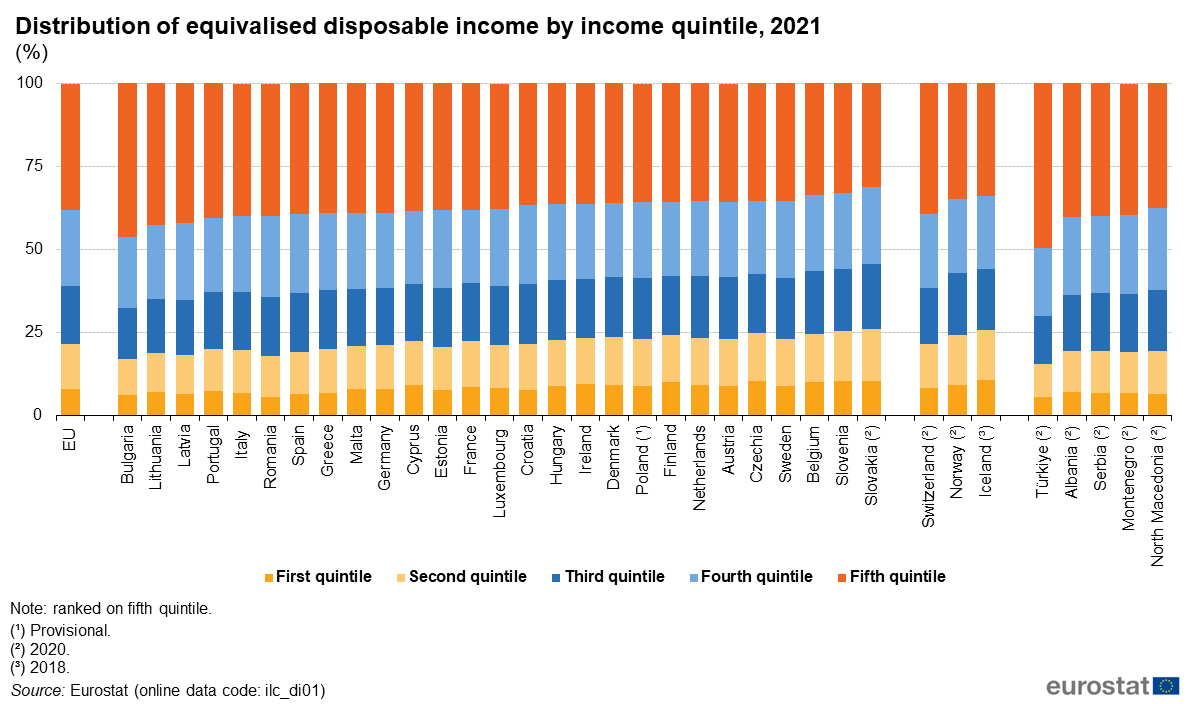
Distribution of equivalised disposable income by income quintile, 2021 (%).png
(
file
)
71 KB
Reverted to version as of 10:37, 6 January 2023 (CET)
4
11:48, 6 January 2023
Gini coefficient for equivalised disposable income per inhabitant, 2021(%).png
(
file
)
44 KB
2
11:47, 6 January 2023
Income quintile share ratio, 2021 (%).png
(
file
)
43 KB
2
11:46, 6 January 2023
Contribution of social transfers to median equivalised disposable income, 2021 (PPS per inhabitant).png
(
file
)
41 KB
2
21:35, 12 December 2022
Income distribution and inequality LCIE2023.xlsx
(
file
)
1.32 MB
1
21:32, 12 December 2022
Map2 Gini coefficient for equivalised disposable income per inhabitant, 2021.png
(
file
)
632 KB
1
13:17, 12 December 2022
Gini coefficient for equivalised disposable income per inhabitant, 2021 (%).png
(
file
)
47 KB
1
10:59, 9 December 2022
Map2.Gini coefficient for equivalised disposable income per inhabitant, 2021.png
(
file
)
314 KB
1
16:45, 25 November 2022
Material deprivation and economic strain LCIE2023.xlsx
(
file
)
229 KB
1
16:31, 25 November 2022
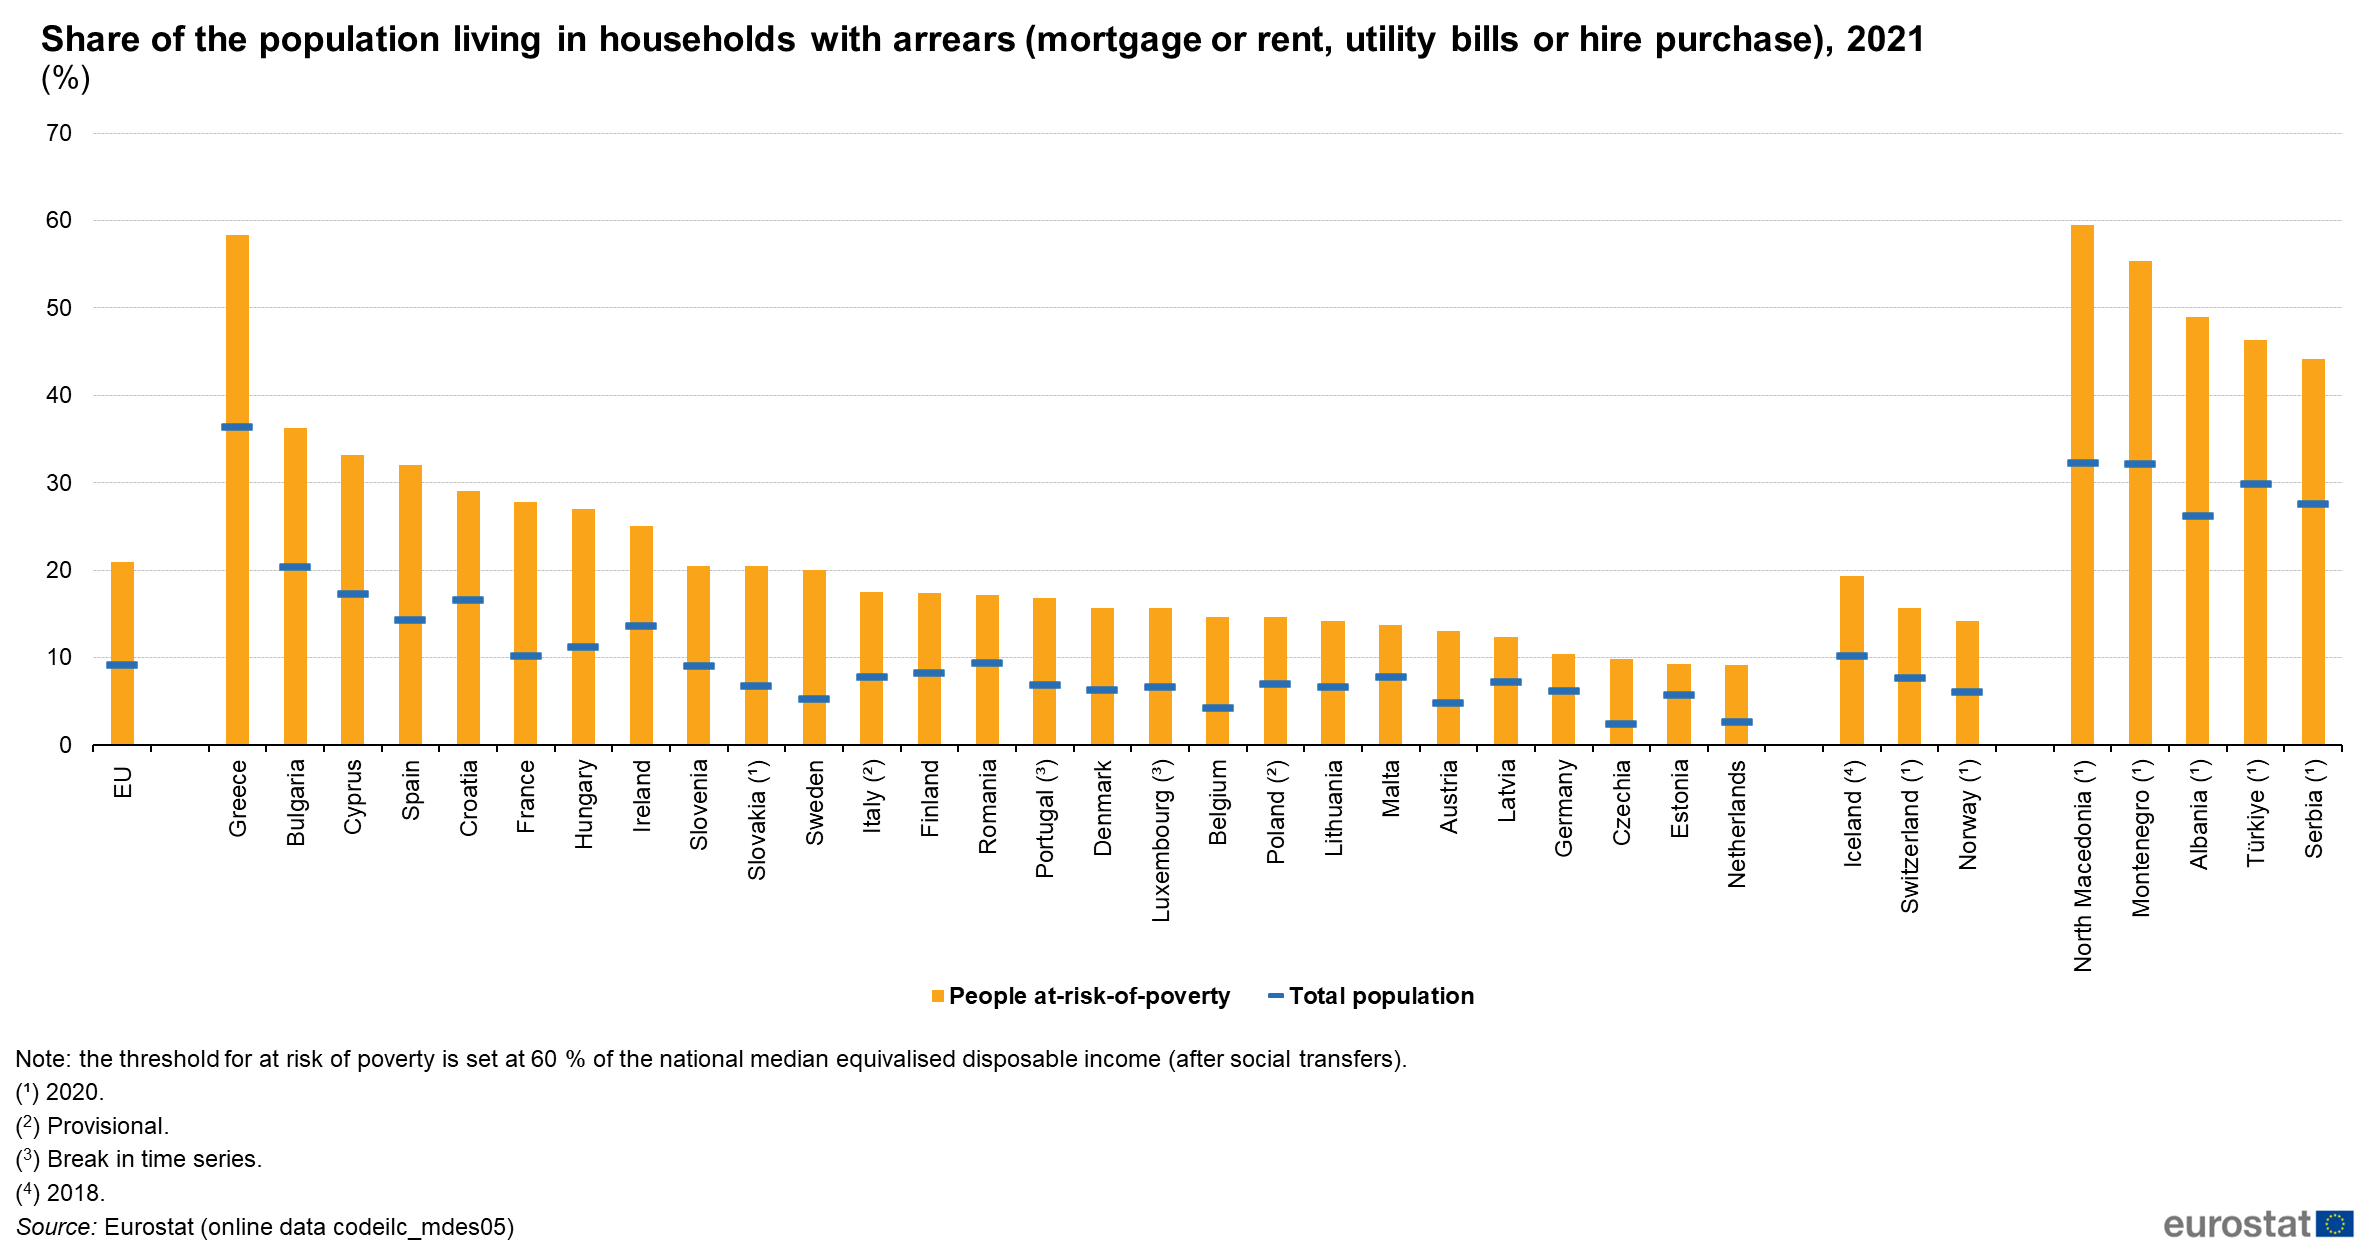
Share of the population living in households with arrears, (mortgage or rent, utility).png
(
file
)
116 KB
1
16:23, 25 November 2022
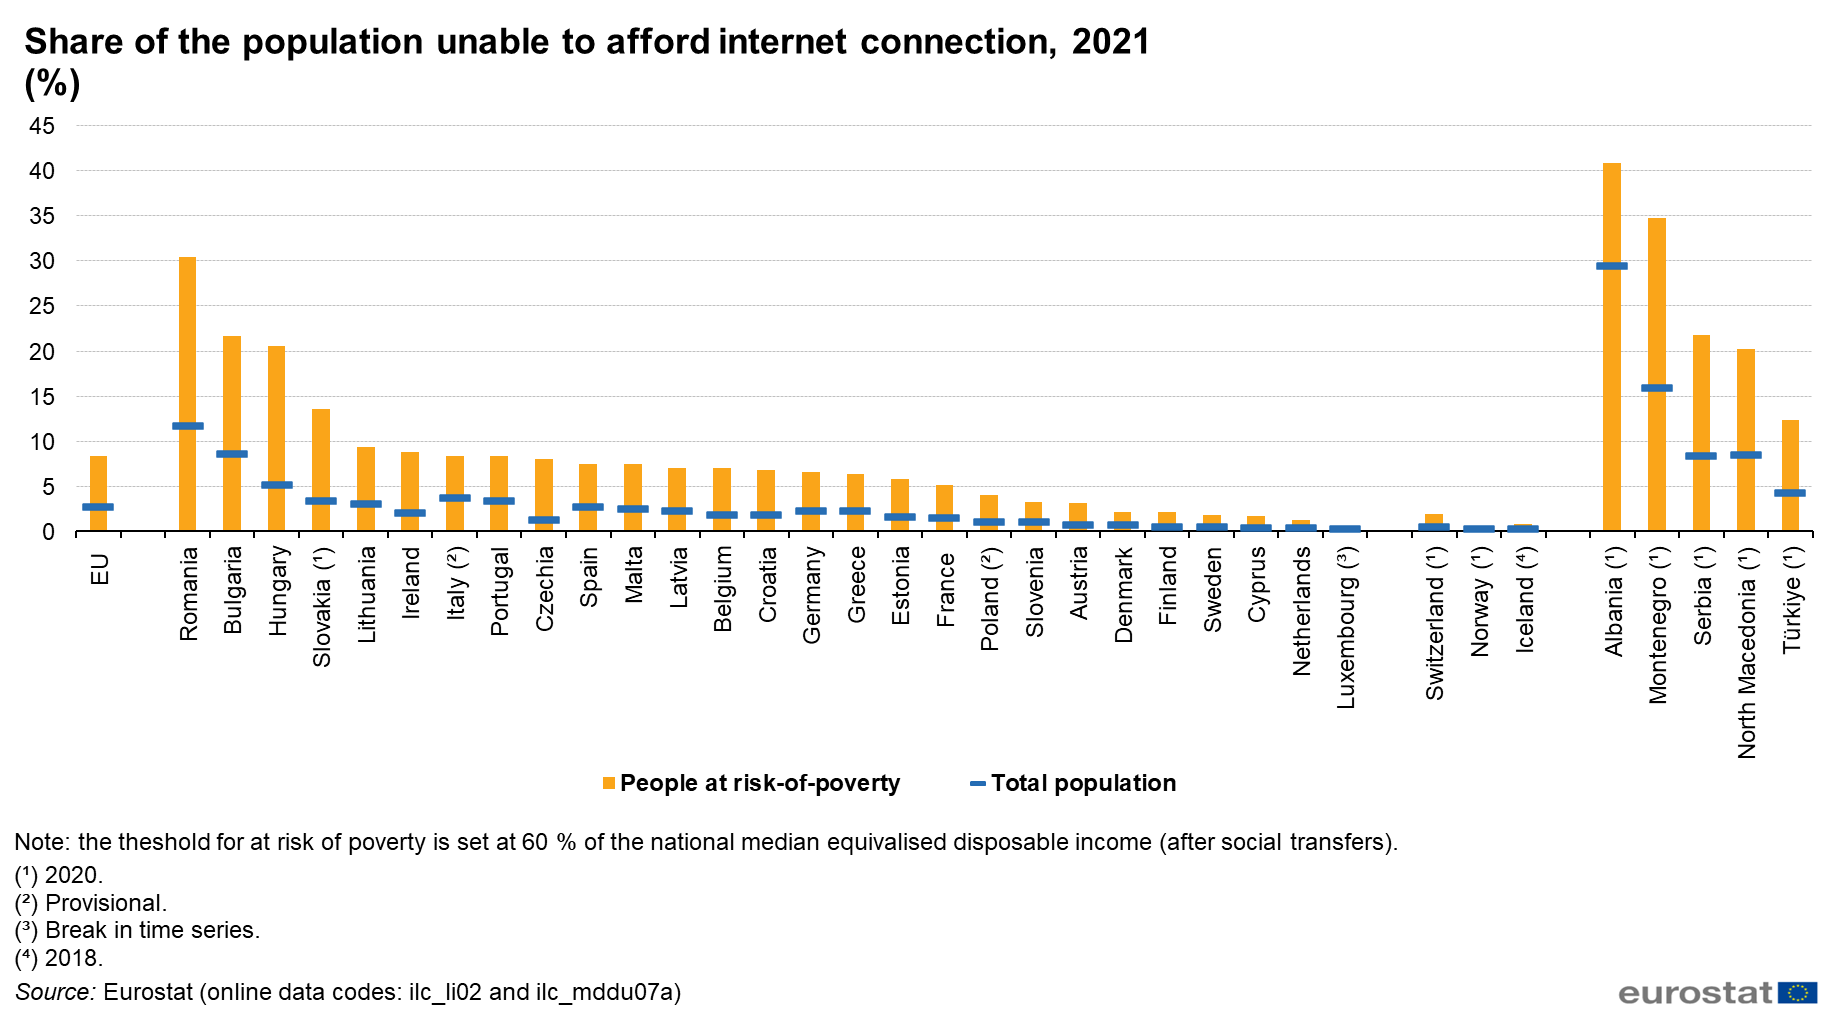
Share of the population unable to afford internet connection, 2021.png
(
file
)
85 KB
1
16:19, 25 November 2022
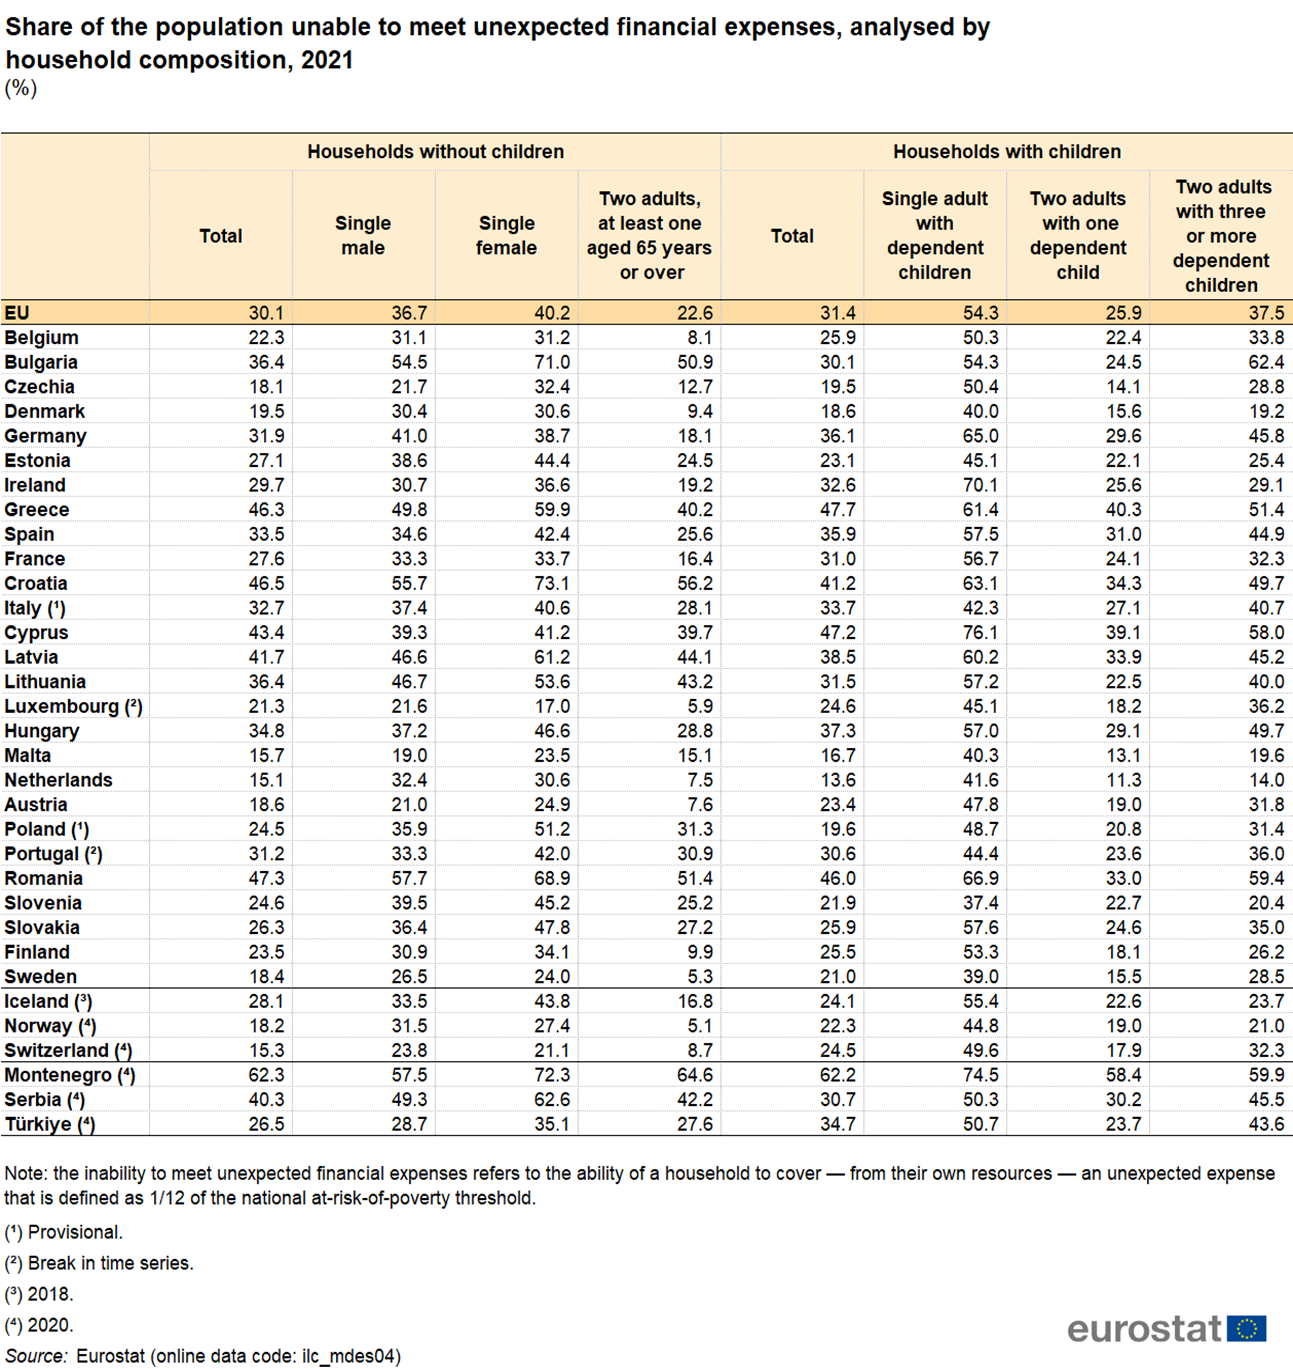
Share of the population unable to meet unexpected financial expenses, analysed by household, 2021.png
(
file
)
677 KB
1
16:05, 25 November 2022
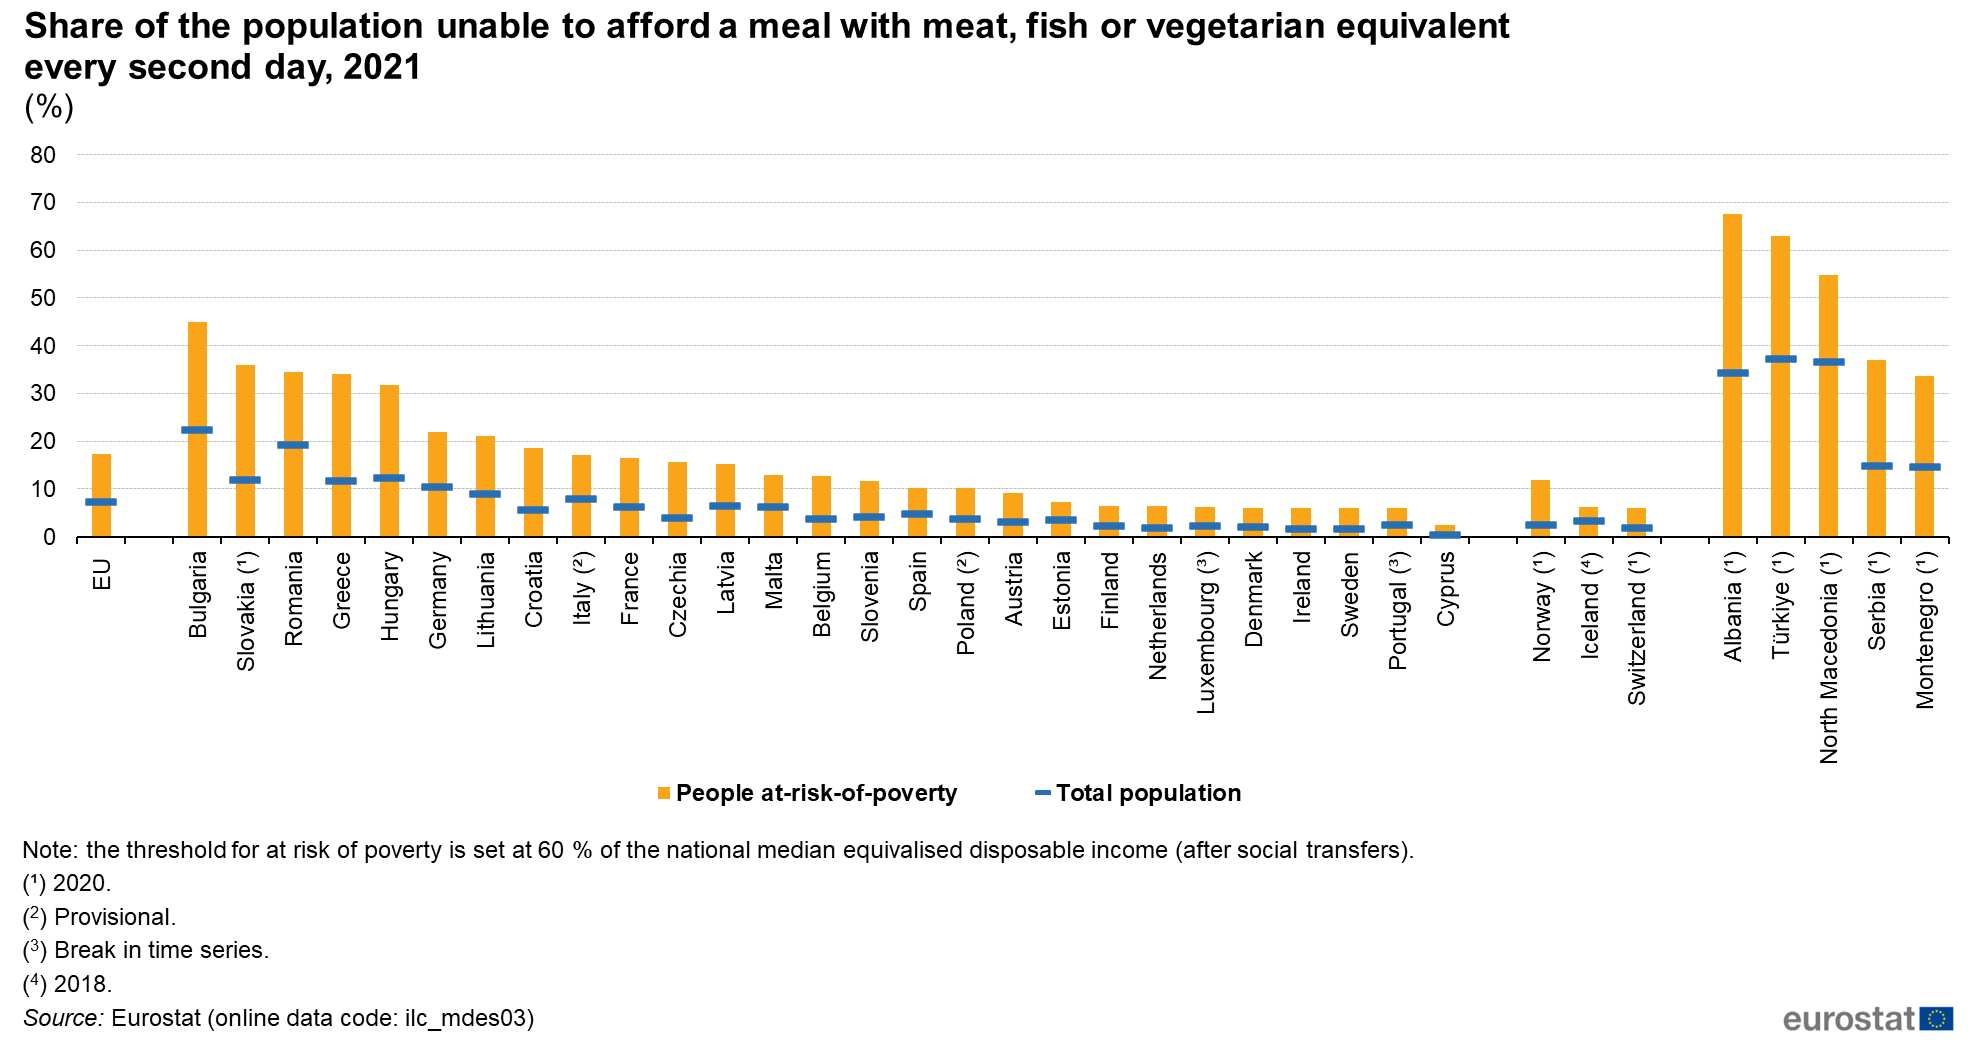
Share of the population unable to afford a meal with meat, fish or vegetarian equivalent, 2021 (%).png
(
file
)
91 KB
1
15:55, 25 November 2022
Infographic severe material, analysed by household composition.png
(
file
)
120 KB
1
15:45, 25 November 2022
Severe material and social deprivation rate, analysed by sex and age group, 2021 (%).png
(
file
)
701 KB
1
15:26, 25 November 2022
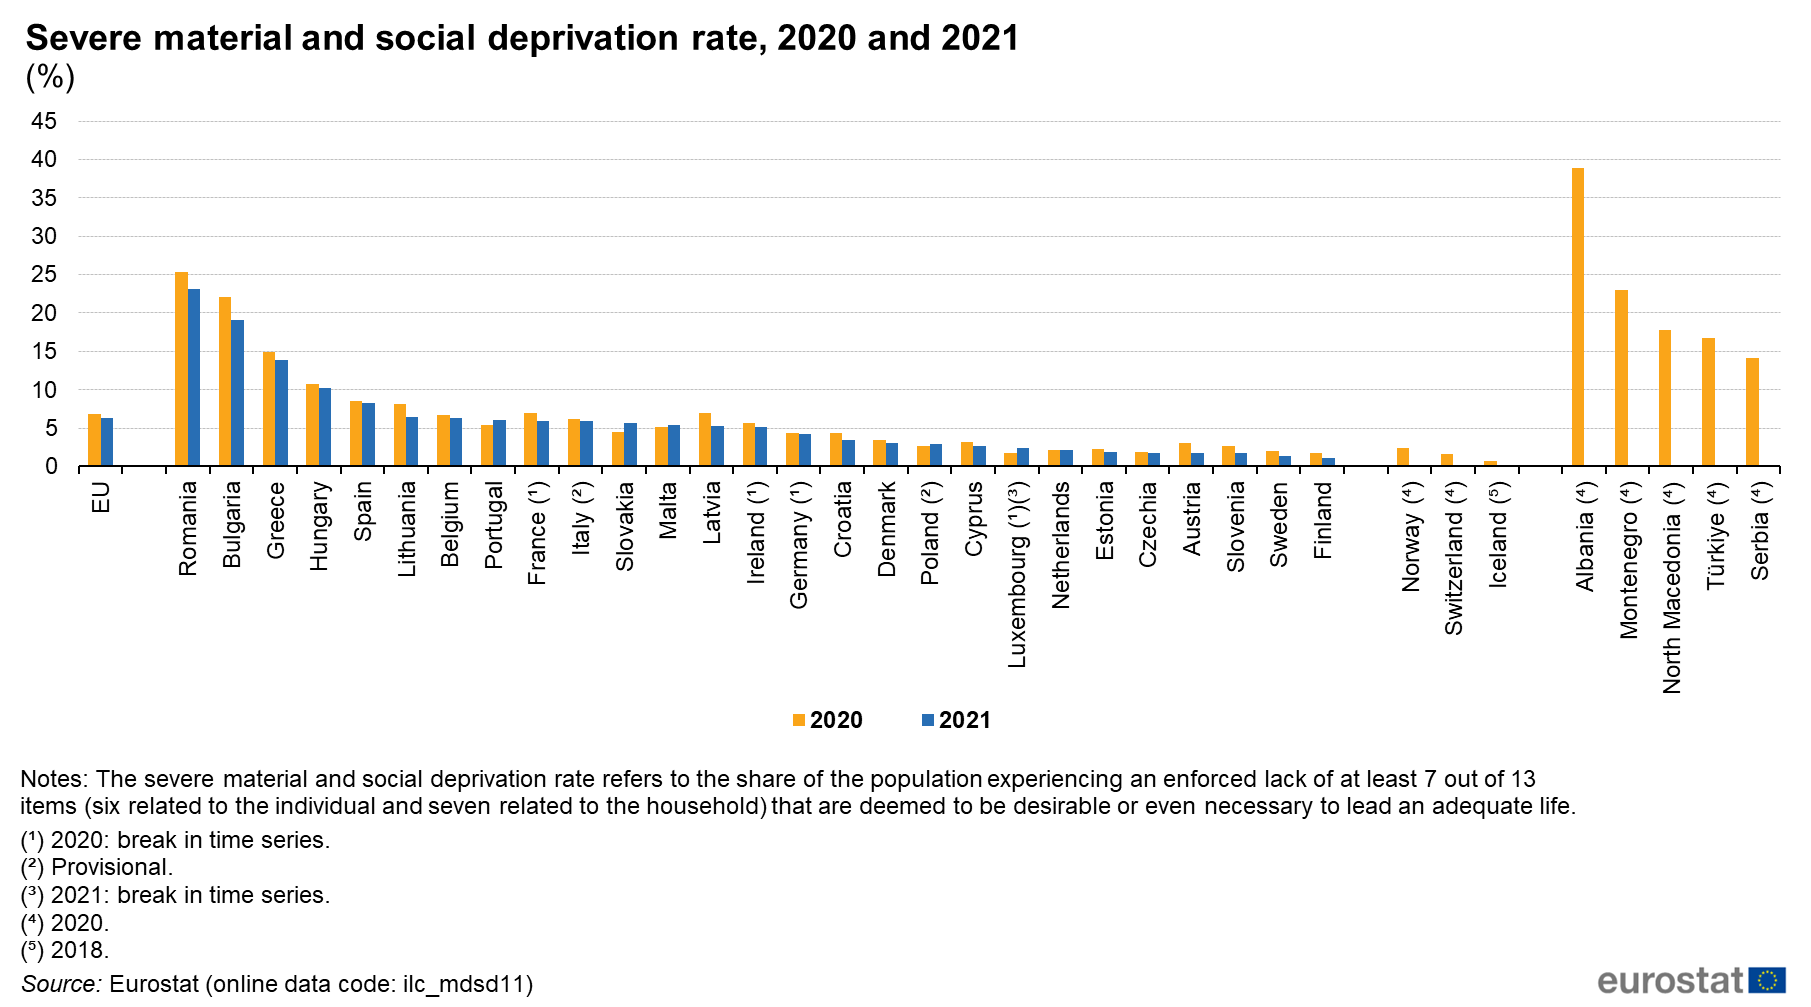
Severe material and social deprivation rate, 2020 and 2021 (%).png
(
file
)
89 KB
1
15:18, 25 November 2022
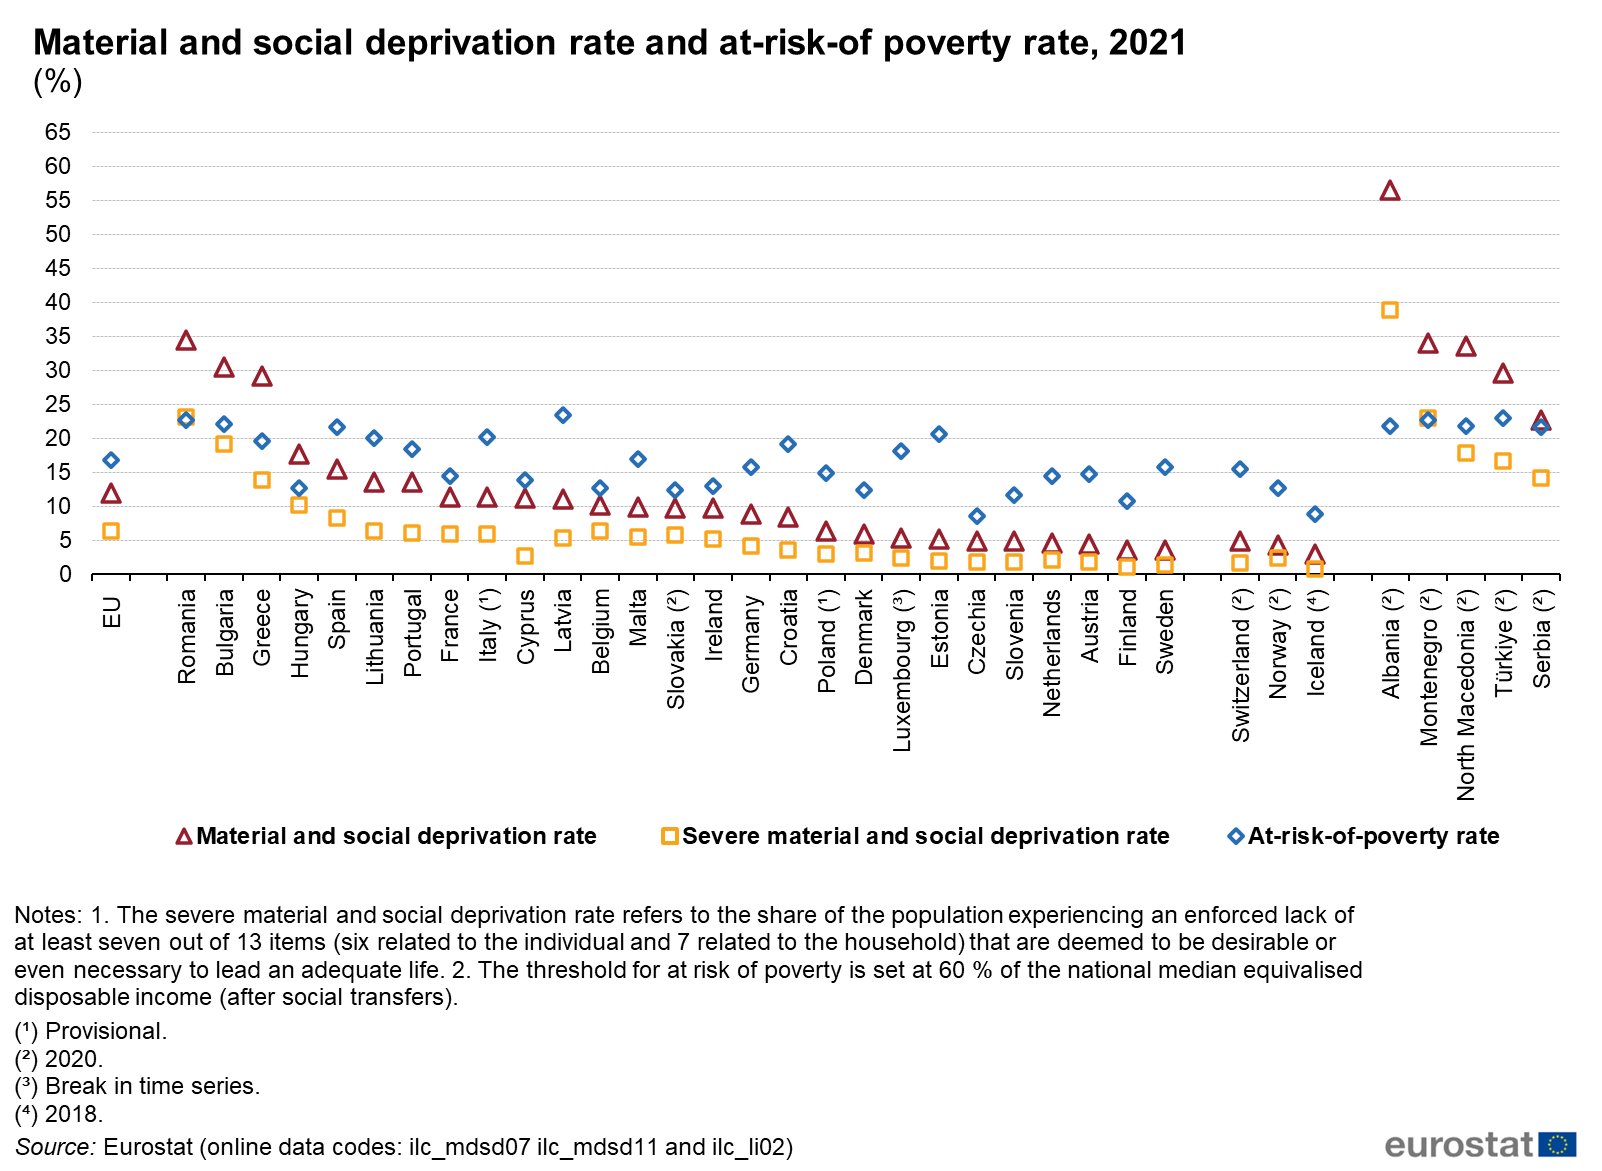
Material and social deprivation rate and at-risk-of poverty rate, 2021 (%).png
(
file
)
102 KB
1
00:00, 13 October 2022
Children at risk of poverty or social exclusion EUSILC2022.xlsx
(
file
)
63 KB
1
23:48, 12 October 2022
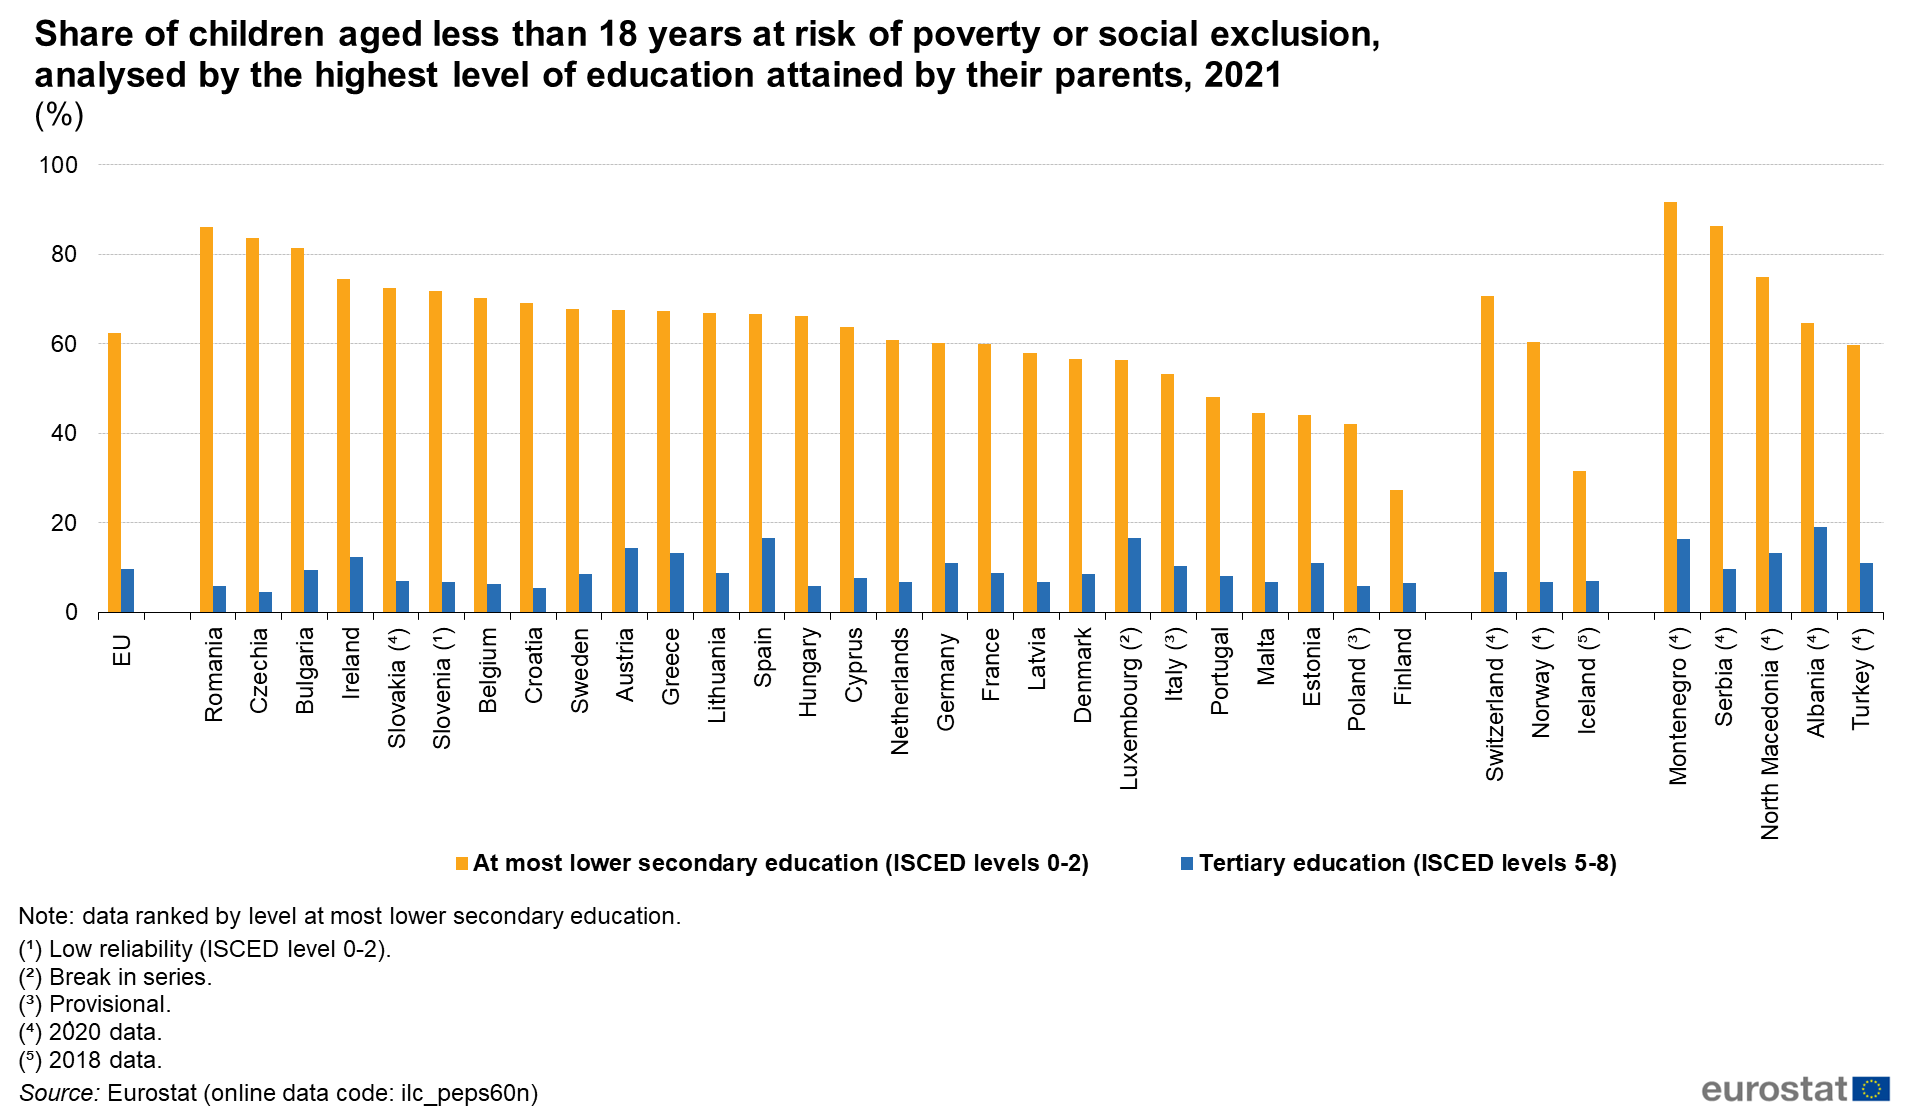
Share of children aged less than 18 years at risk of poverty or social exclusion,by education v1.png
(
file
)
125 KB
1
23:42, 12 October 2022
Children at risk of poverty or social exclusion SILC2022.xlsx
(
file
)
63 KB
2
16:50, 12 October 2022
Share of children aged less than 18 years at risk of poverty or social exclusion, by education.png
(
file
)
125 KB
1
16:19, 12 October 2022
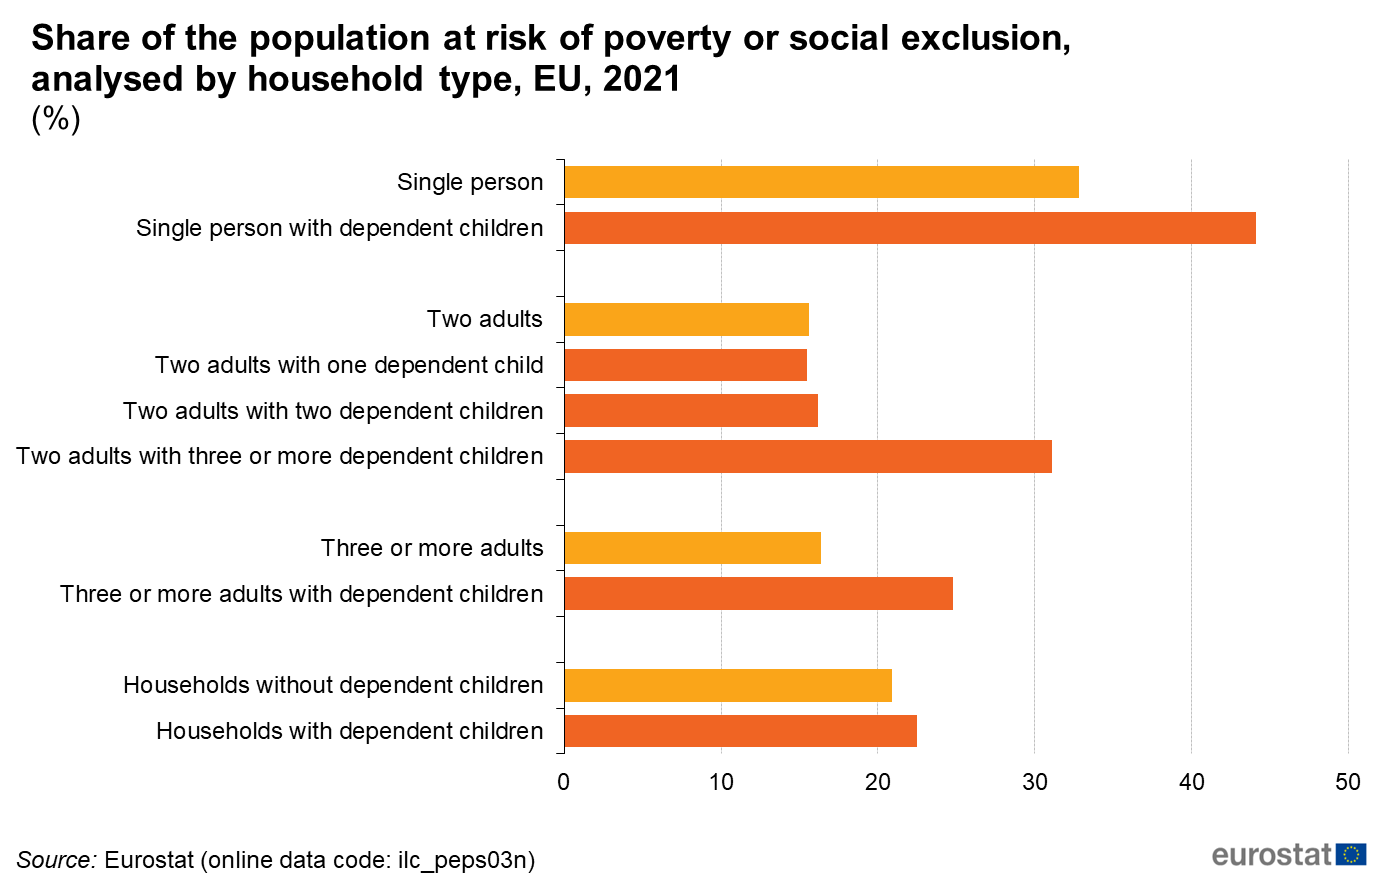
Share of the population at risk of poverty or social exclusion, analysed by household type.png
(
file
)
56 KB
1
16:06, 12 October 2022
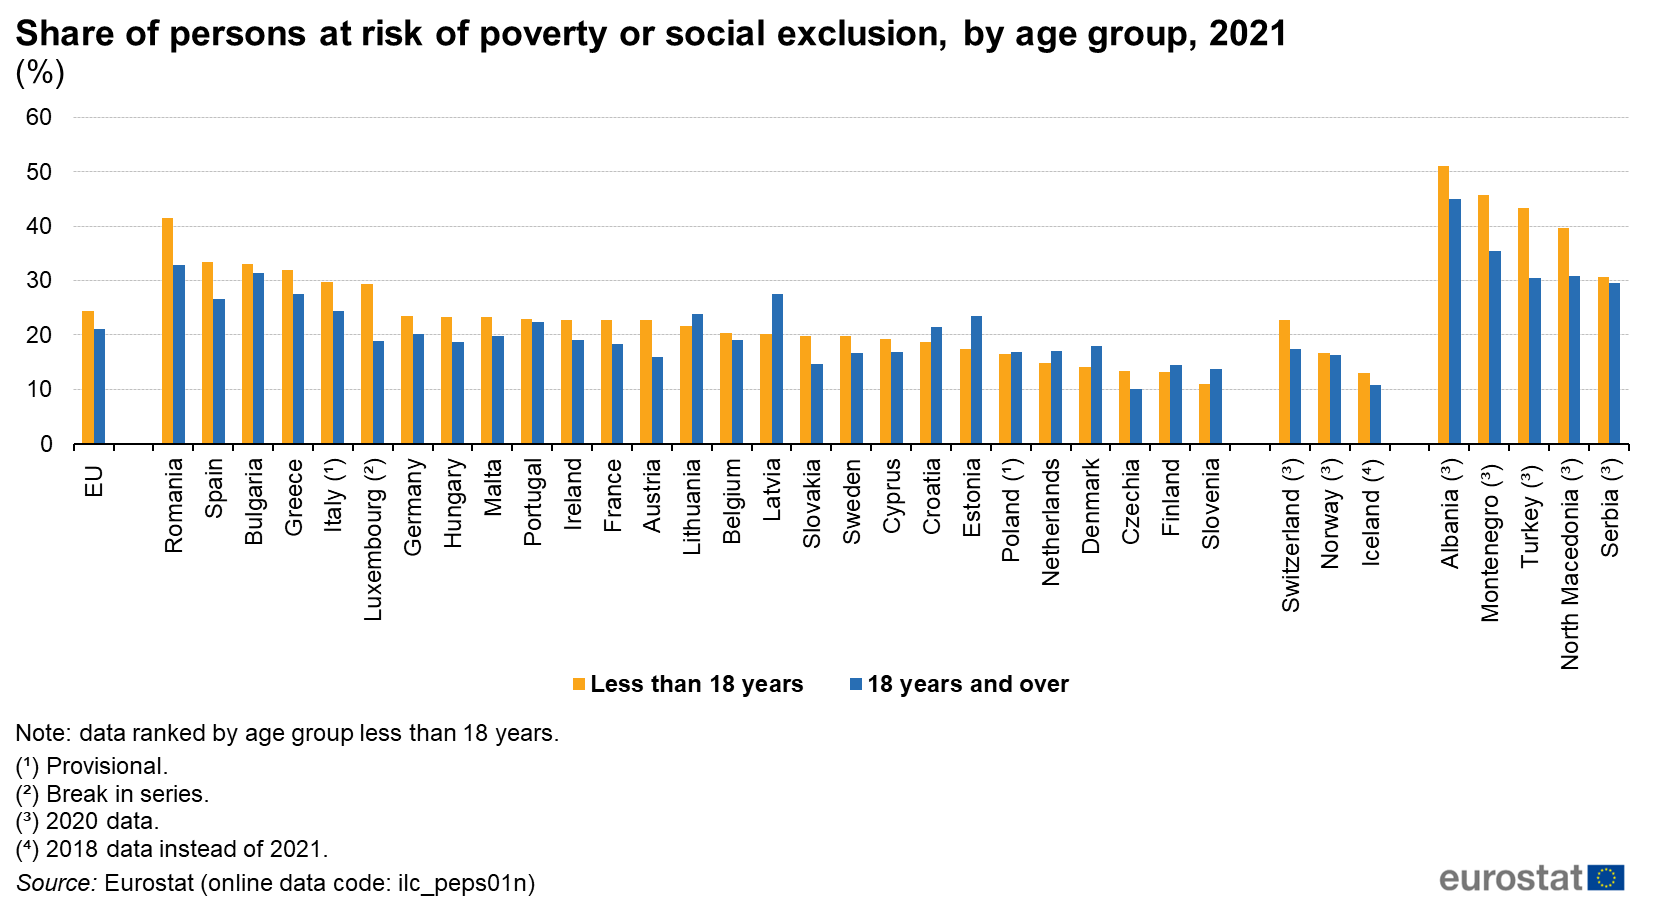
Share of persons at risk of poverty or social exclusion, by age group, 2021.png
(
file
)
97 KB
1
15:52, 12 October 2022
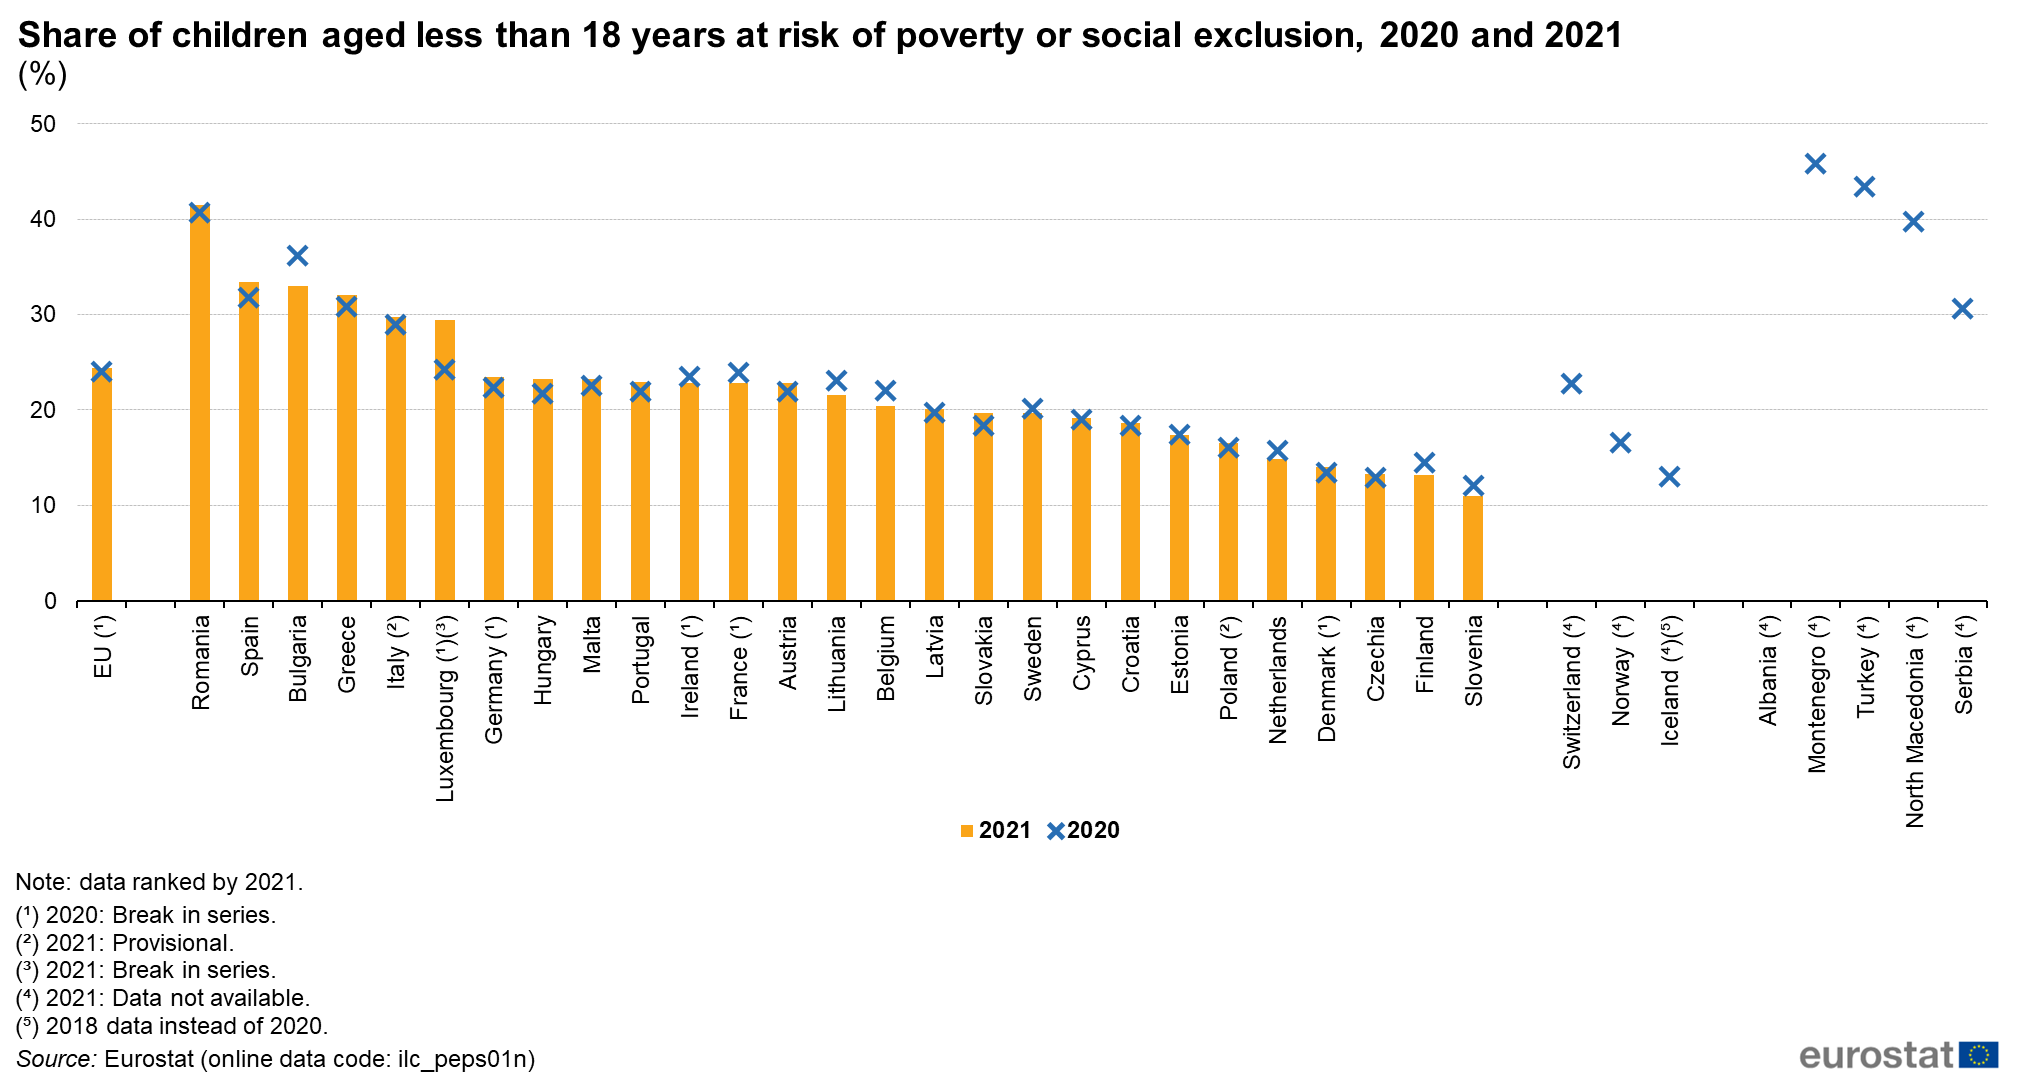
Share of children aged less than 18 years at risk of poverty or social exclusion, 2020 and 2021.png
(
file
)
107 KB
1
14:33, 12 October 2022
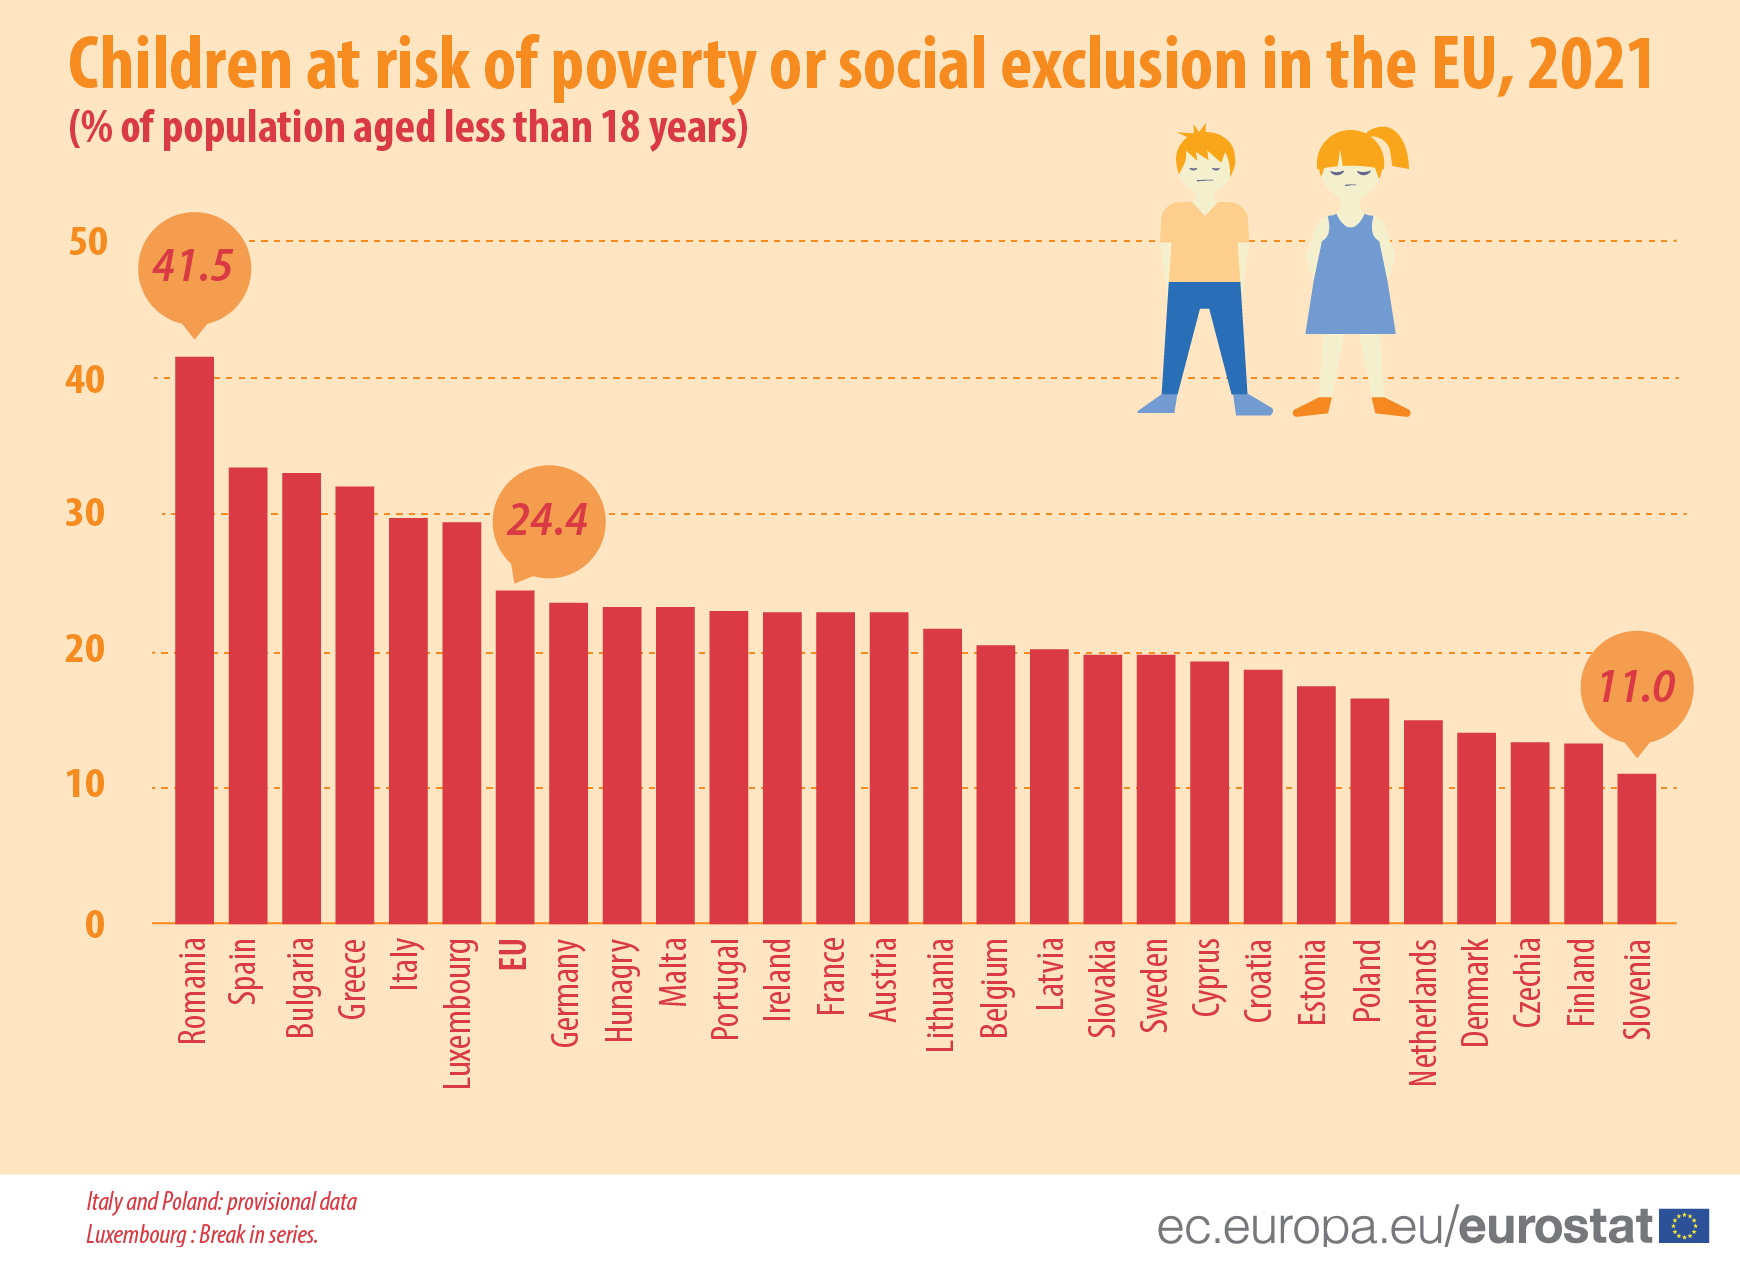
EU-CHILDREN-POVERTY 2021.png
(
file
)
110 KB
1
12:06, 28 July 2022
Stock of vehicles at regional level-update-2022.xlsx
(
file
)
1.05 MB
1
22:48, 26 July 2022
Update Living conditions in Europe-Work Intensity LCIE2020.xlsx
(
file
)
531 KB
1
18:25, 26 July 2022
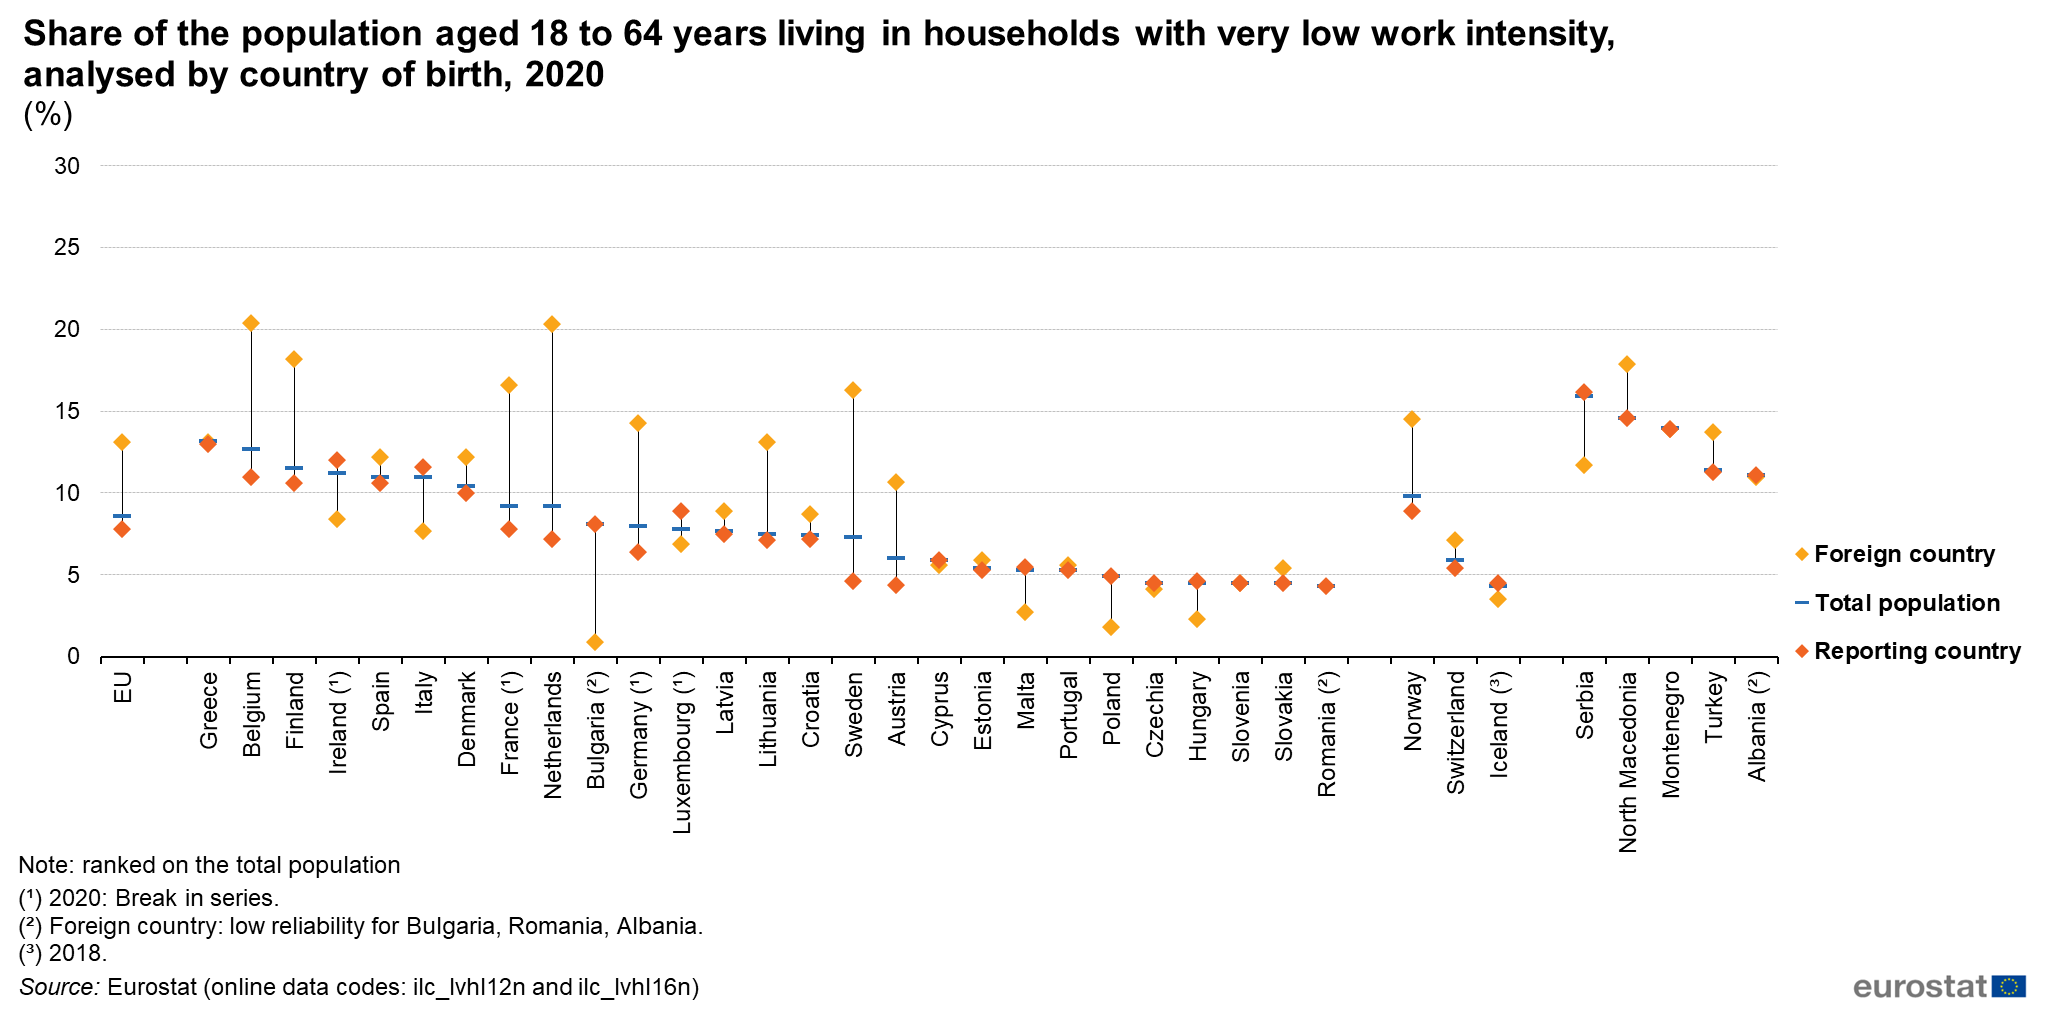
Share of the population aged 18 to 64 years living in households with very low work intensity, analysed by country of birth, 2020 (%).png
(
file
)
88 KB
1
18:04, 26 July 2022
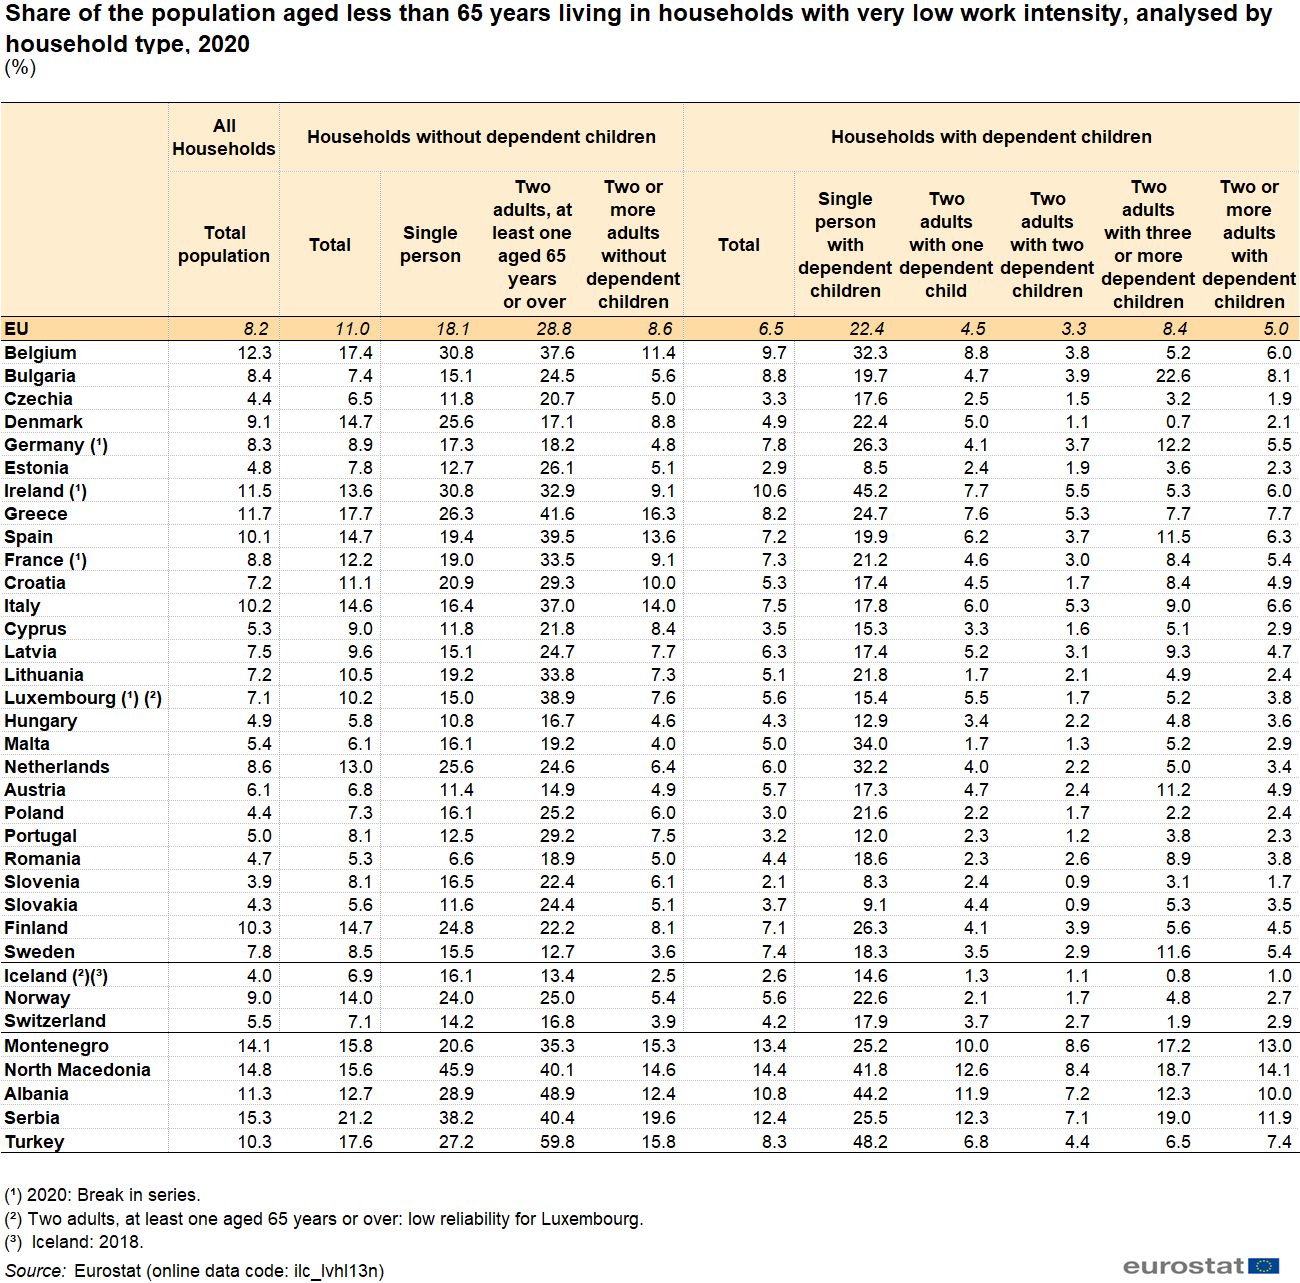
Share of the population aged less than 65 years living in households with very low work intensity, analysed by household type, 2020.png
(
file
)
112 KB
1
14:28, 26 July 2022
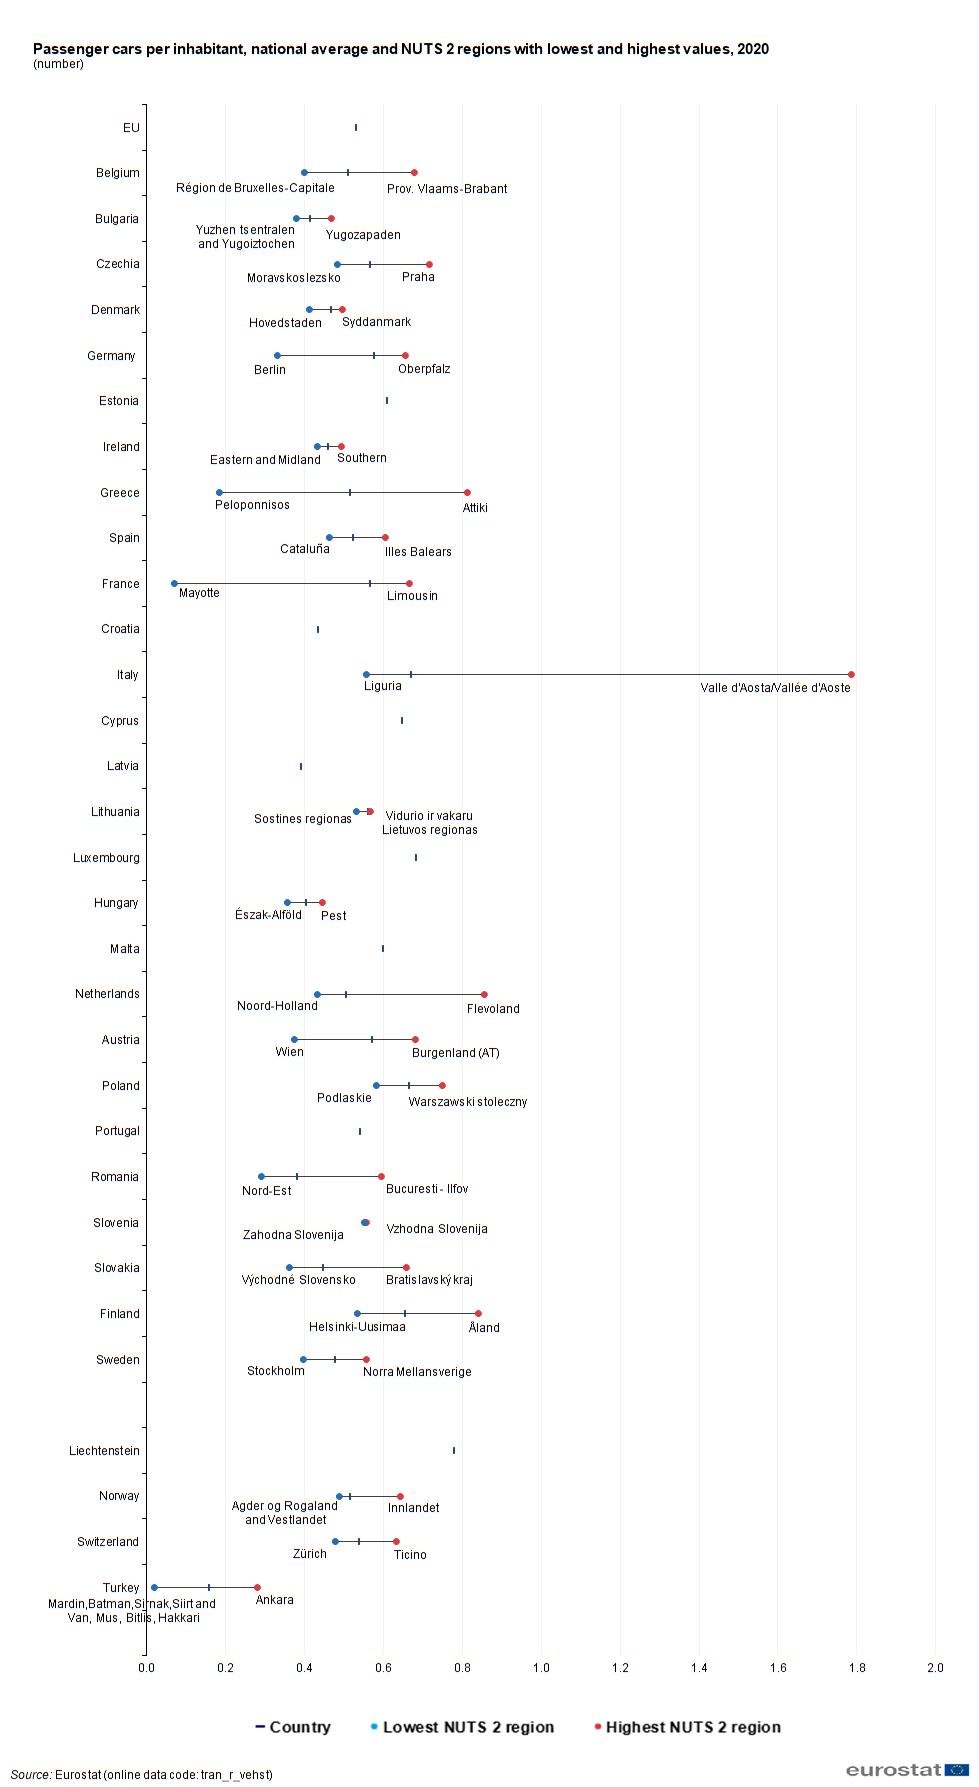
Passenger cars per inhabitant, national average NUTS 2, regions with lowest and highest values, 2020.png
(
file
)
103 KB
2
12:56, 26 July 2022
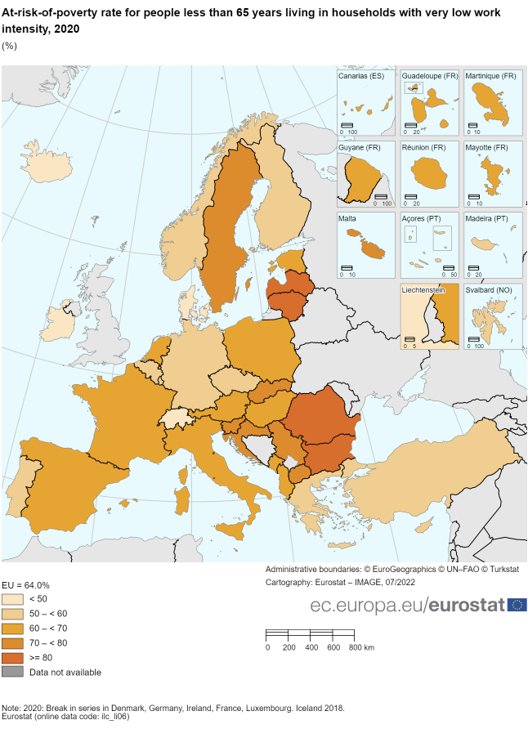
Map1. At-risk-of-poverty rate for people aged less than 65 years living in households with very low work intensity, 2020.png
(
file
)
210 KB
1
10:17, 26 July 2022
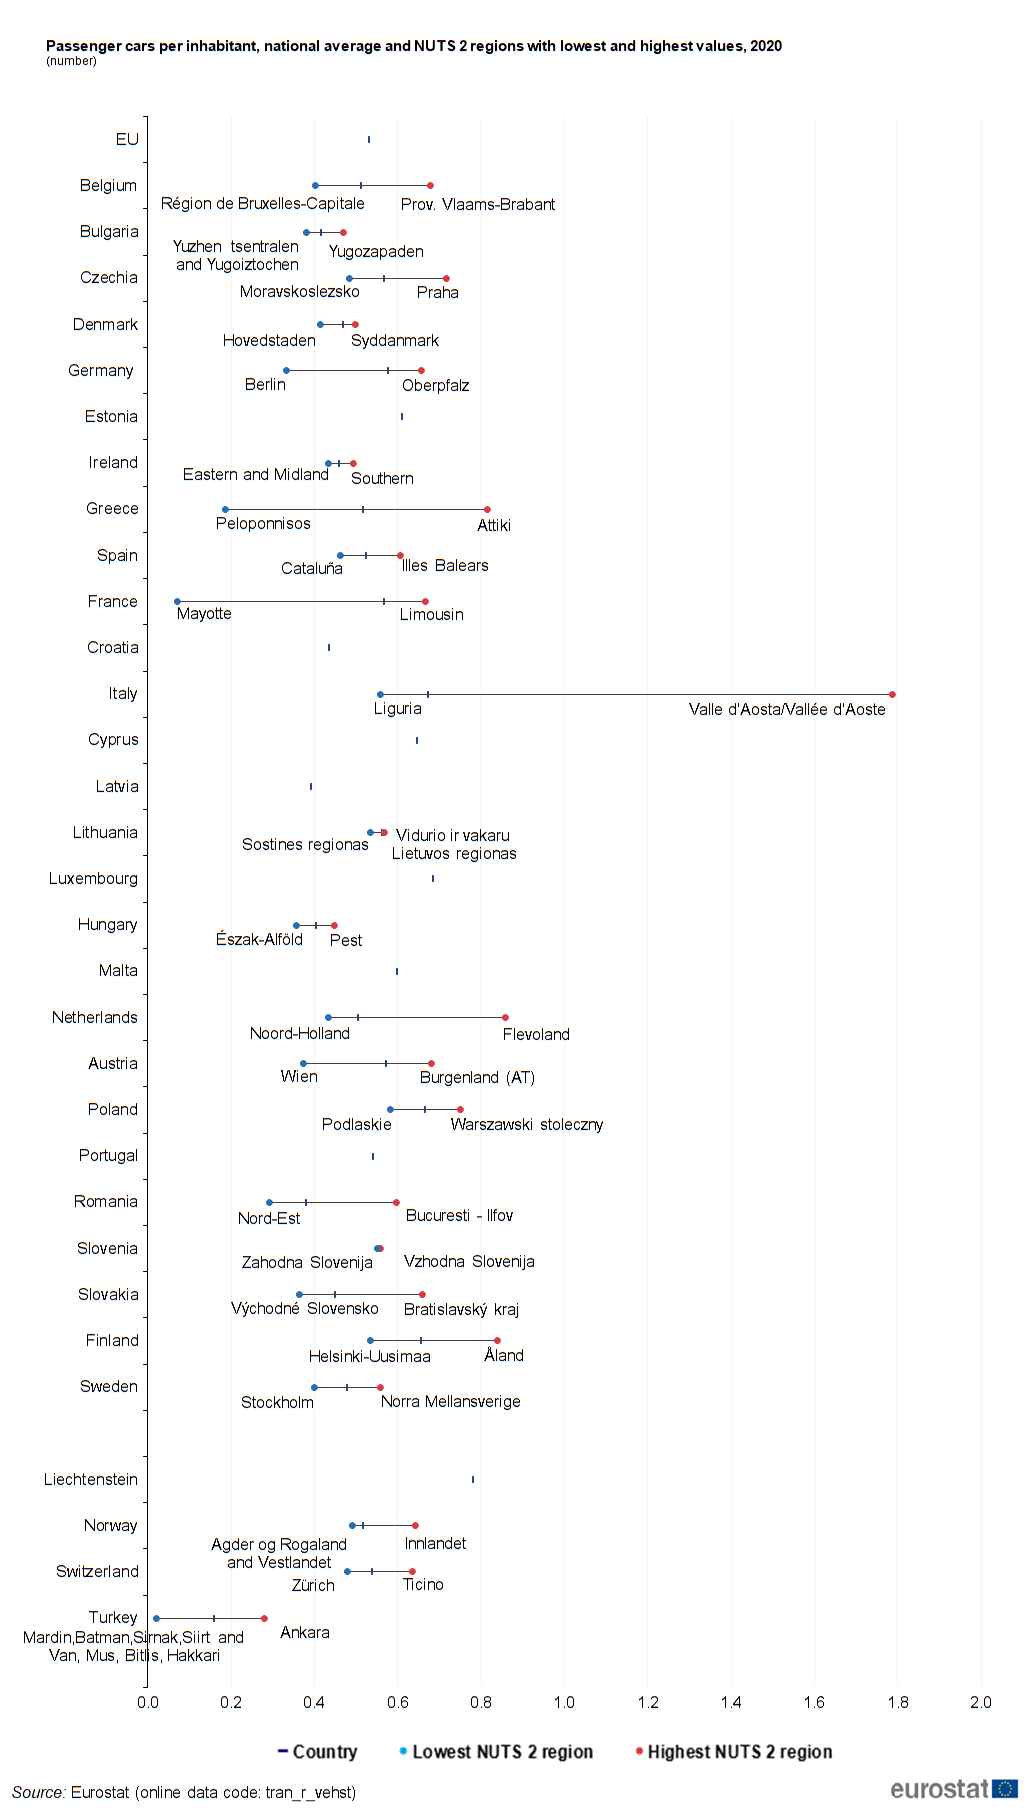
Passenger per inhabitant, national average and NUTS 2, regions with lowest and highest values, 2020.png
(
file
)
129 KB
1
09:55, 25 July 2022
Stock of vehicles at regional level, update 2022.xlsx
(
file
)
1.05 MB
1
09:23, 25 July 2022
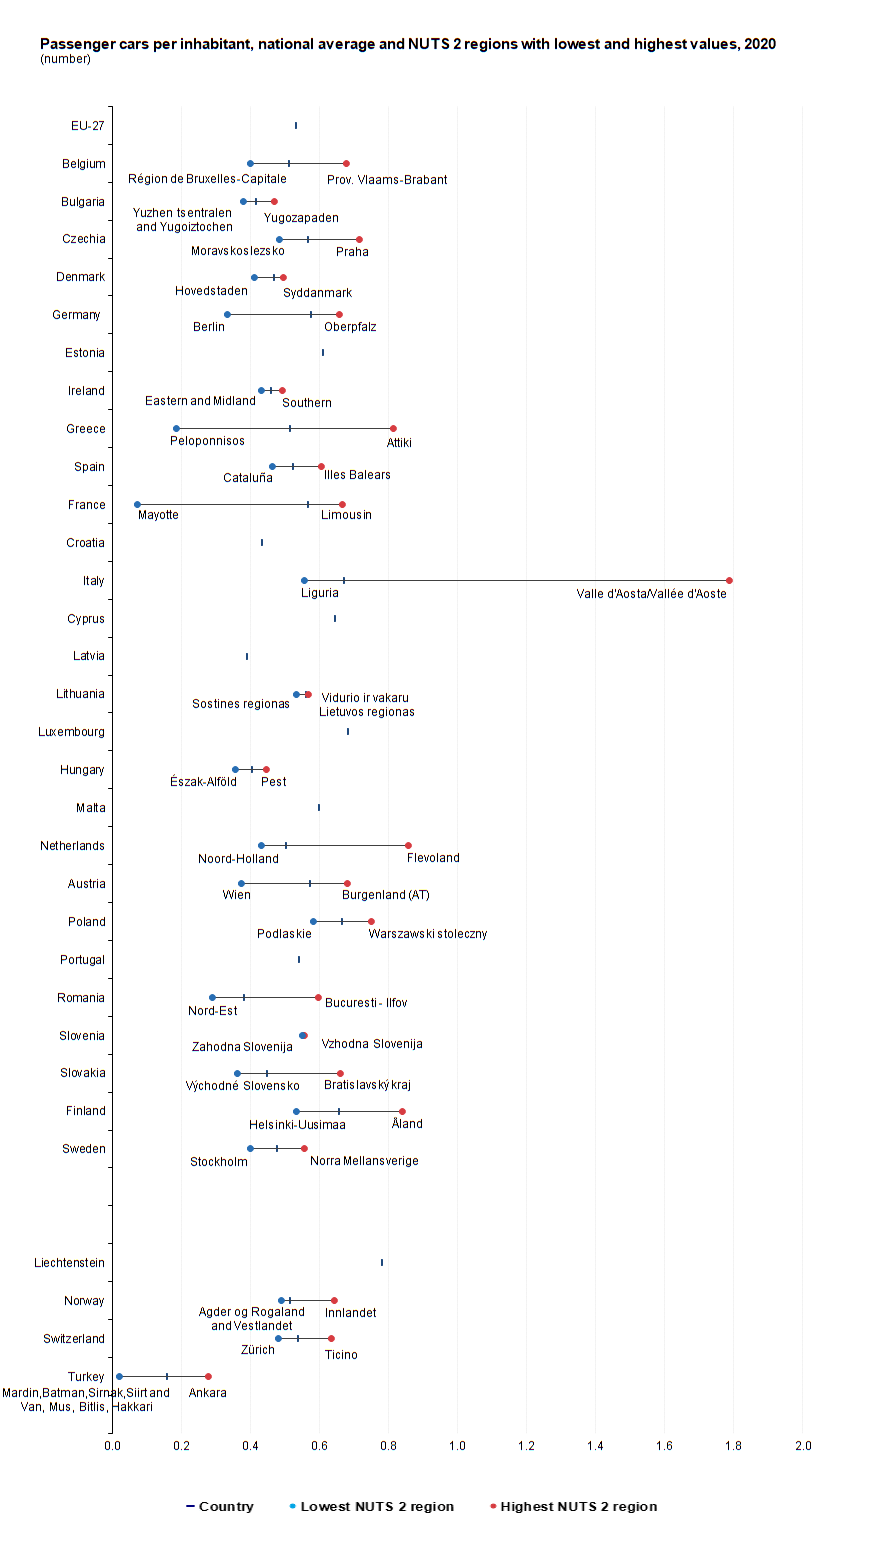
Passenger cars per inhabitant, national average and NUTS 2, regions with lowest and highest values, 2020.png
(
file
)
86 KB
1
08:45, 25 July 2022
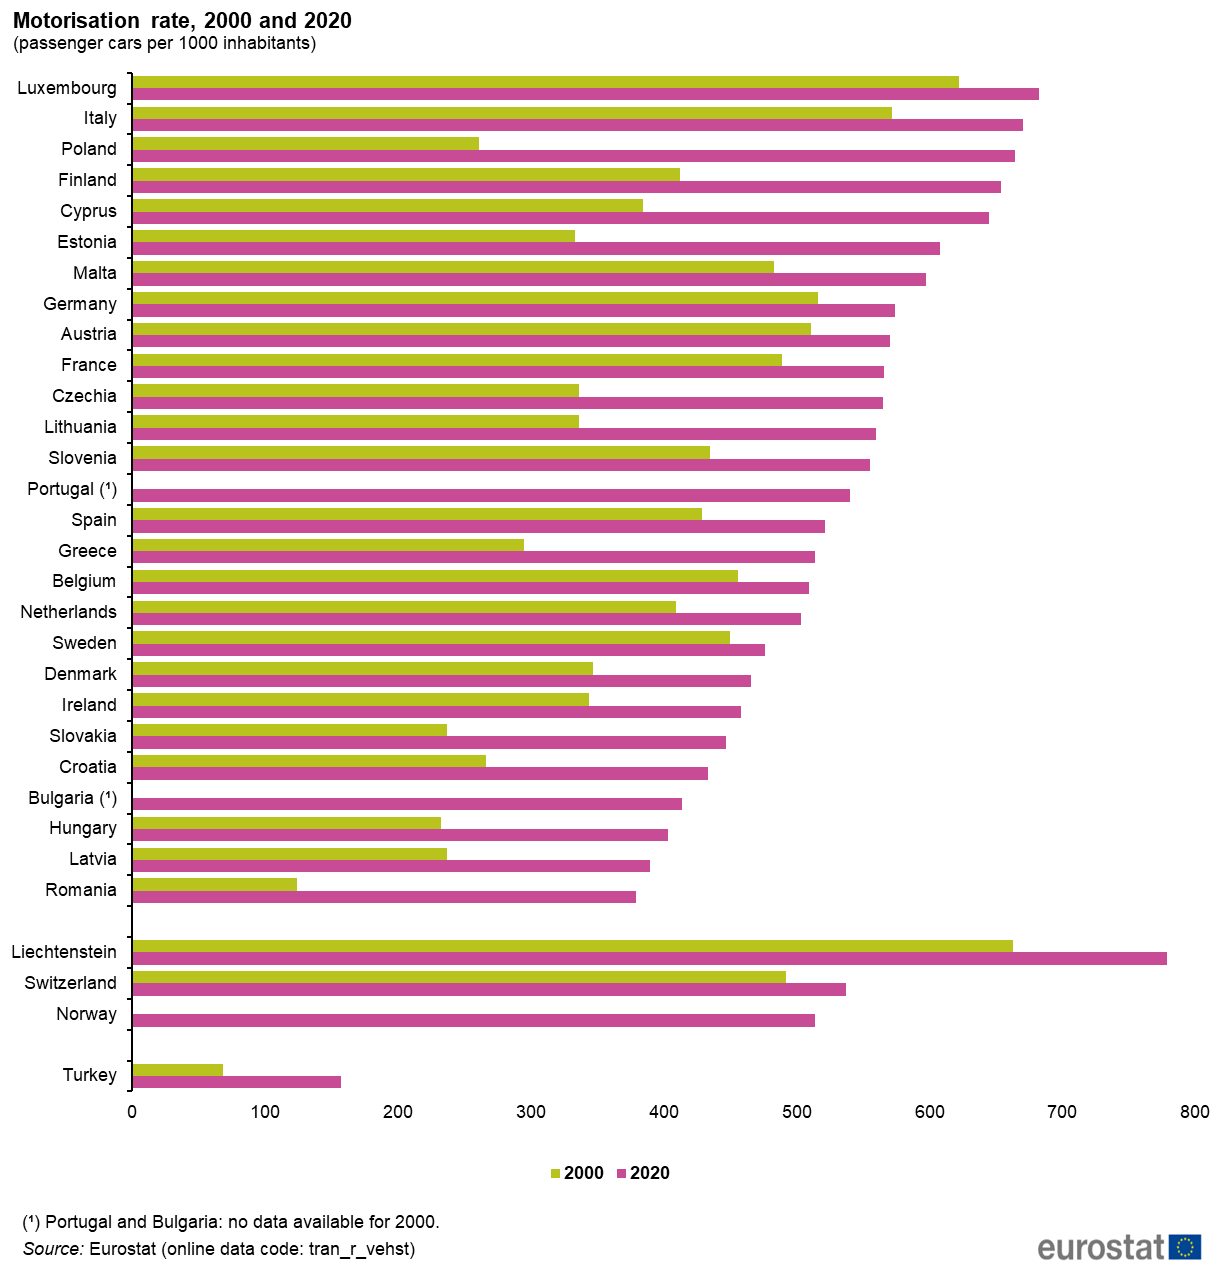
Motorisation rate, 2000 and 2020.png
(
file
)
51 KB
2
09:12, 22 July 2022
Stock of vehicles at regional level-update 2022.xlsx
(
file
)
1.05 MB
1
08:54, 22 July 2022
Map 2. Utility vehicles (lorries, road tractors and special vehicles), by NUTS 2 region, 2020.png
(
file
)
435 KB
1
08:50, 22 July 2022
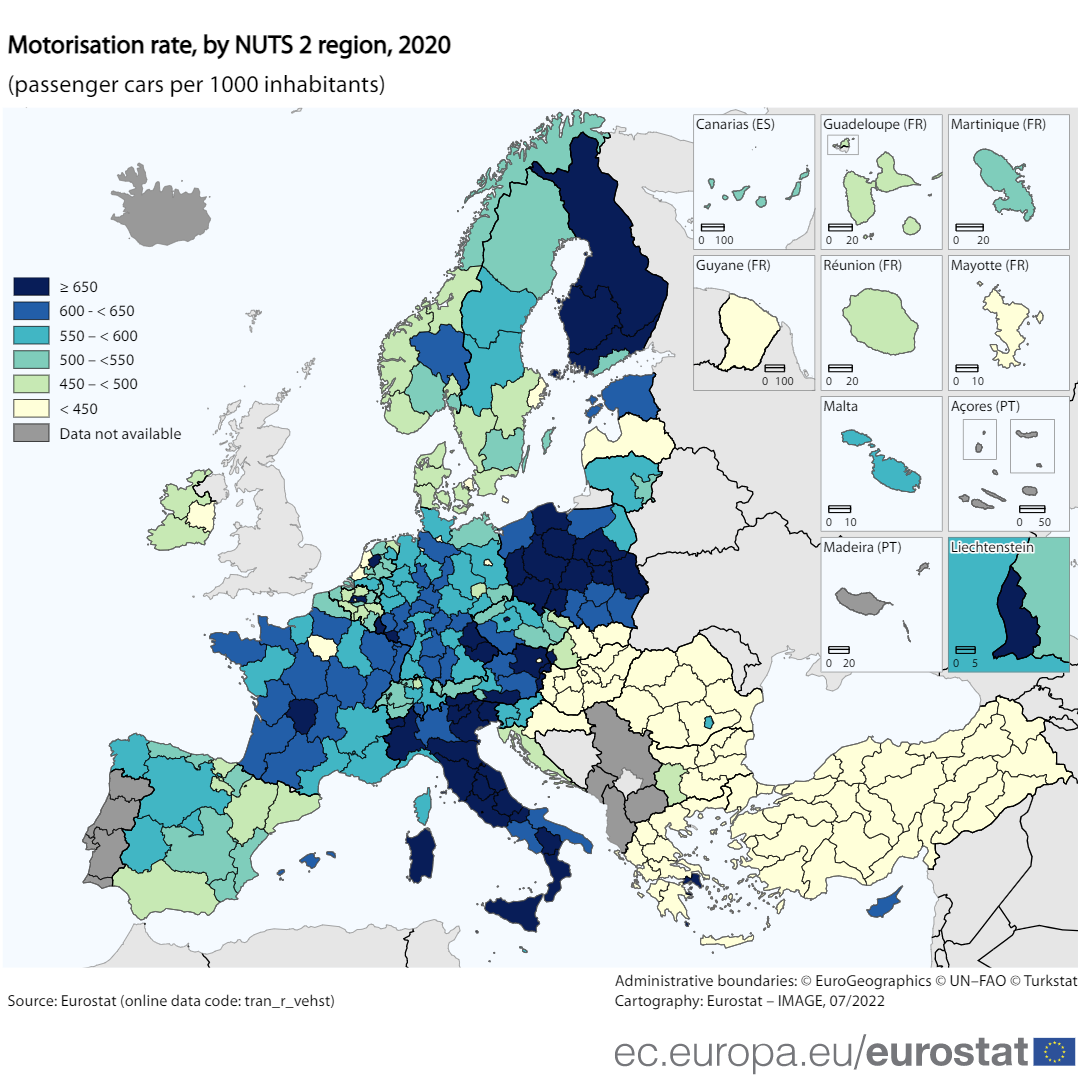
Map1.Motorisation rate, by NUTS 2 region, 2020.png
(
file
)
446 KB
1
18:30, 21 July 2022
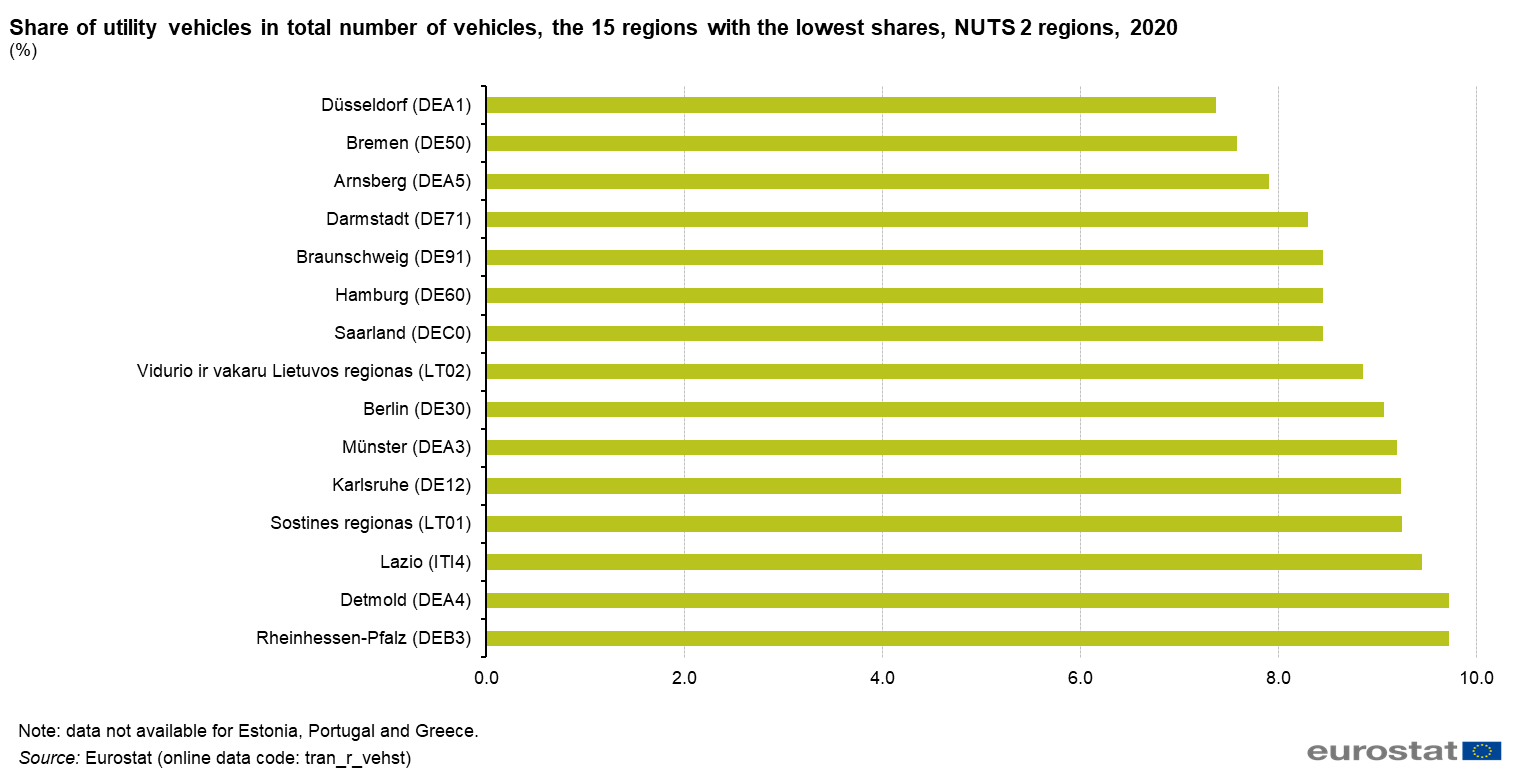
Share of utility vehicles in total number of vehicles, the 15 regions with the lowest shares, NUTS 2 regions, 2020 (%) .png
(
file
)
47 KB
1
18:01, 21 July 2022
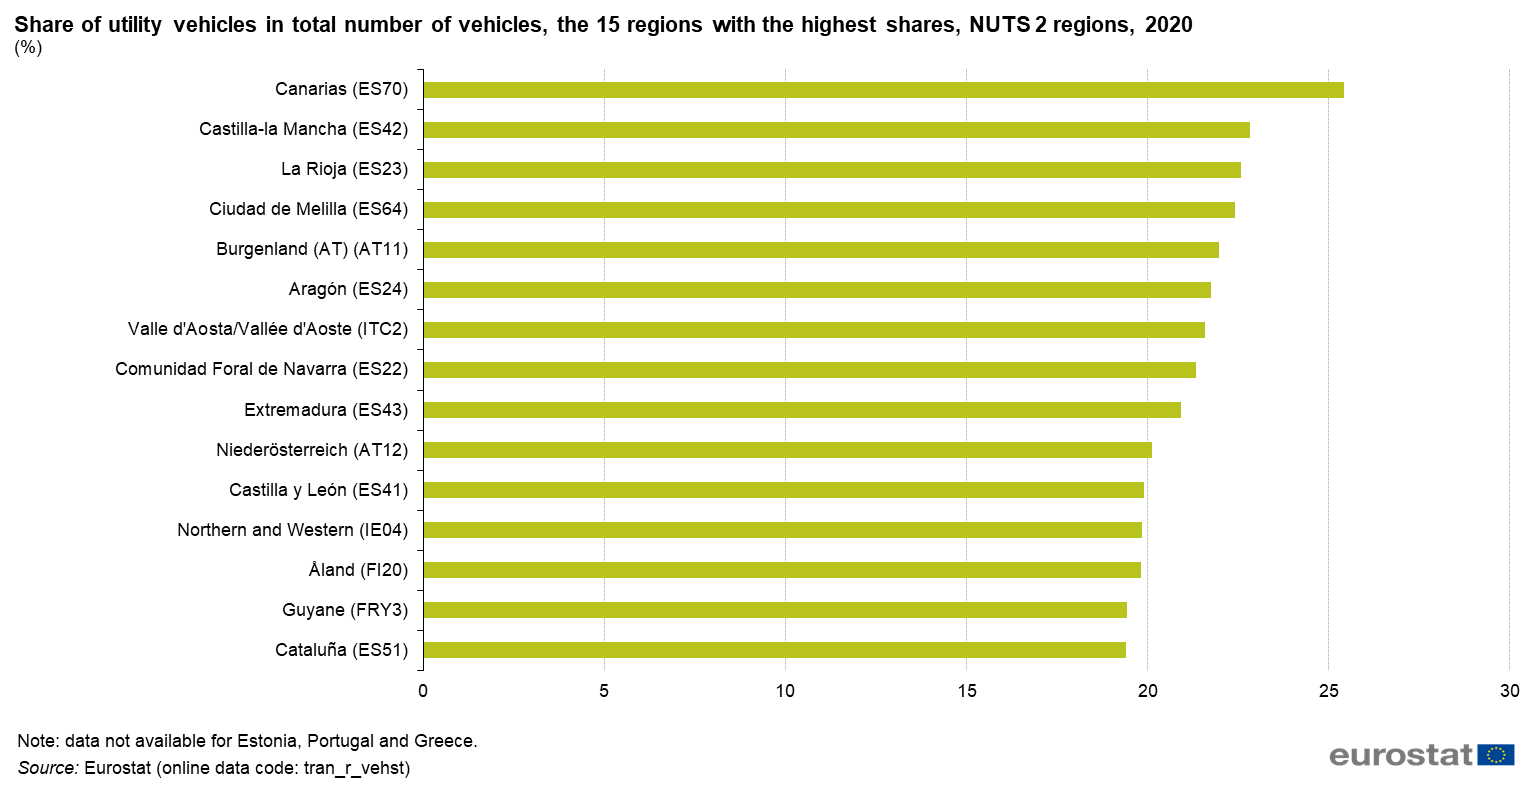
Share of utility vehicles in total number of vehicles, the 15 regions with the highest shares, NUTS 2 regions, 2020 (%).png
(
file
)
53 KB
1
17:33, 21 July 2022
Passenger cars per 1000 inhabitants, 2000 and 2020.png
(
file
)
50 KB
1
17:25, 21 July 2022
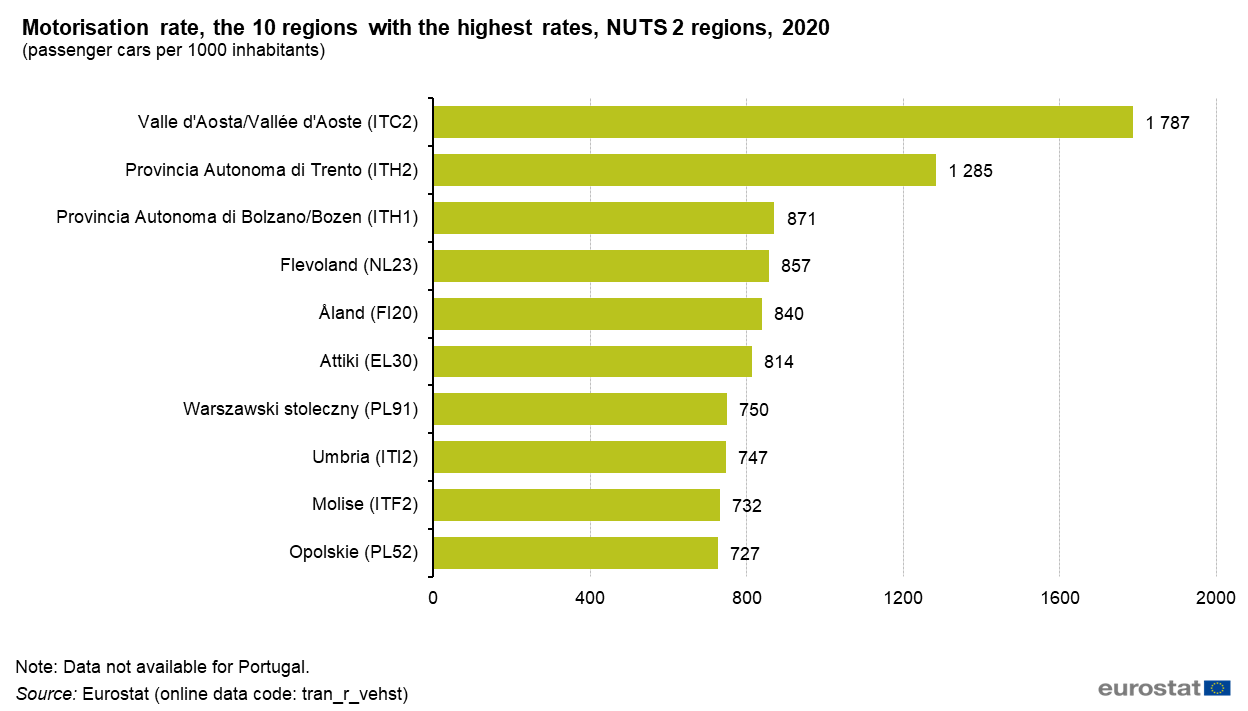
Motorisation rate, the 10 regions with the highest rates, NUTS 2 regions, 2020.png
(
file
)
41 KB
1
17:22, 21 July 2022
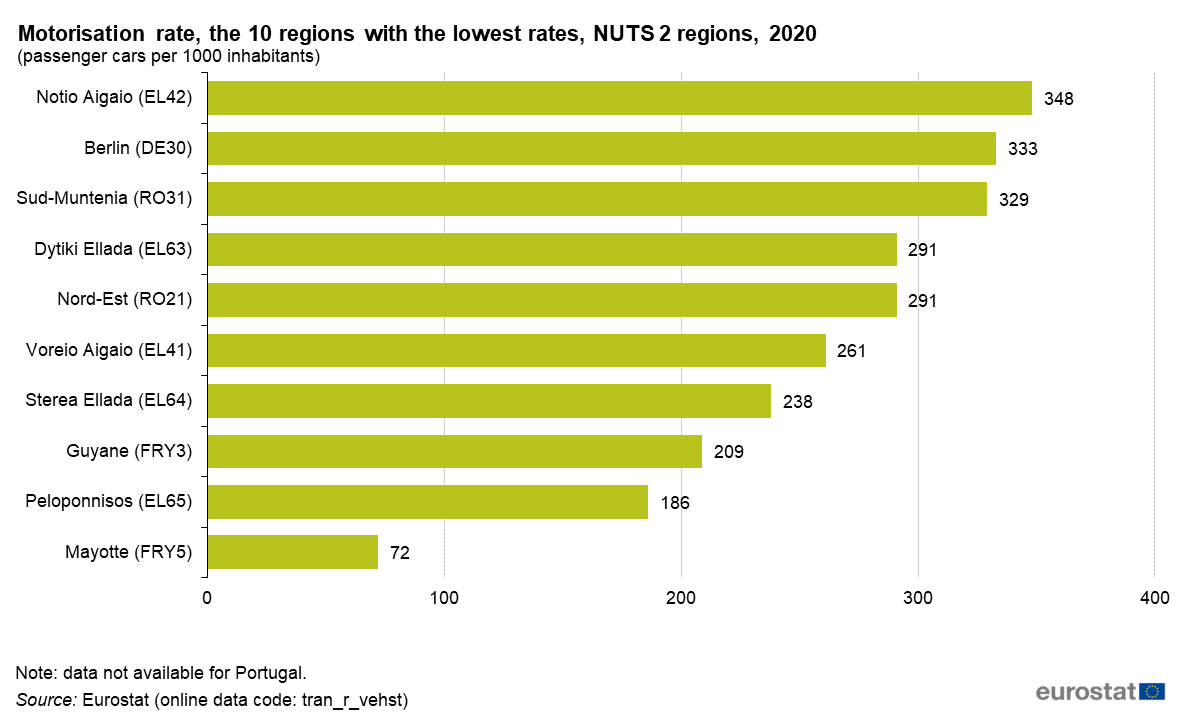
Motorisation rate, the 10 regions with the lowest rates, NUTS 2 regions, 2020 (passenger cars per 1000 inhabitants) .png
(
file
)
39 KB
1
16:57, 21 July 2022
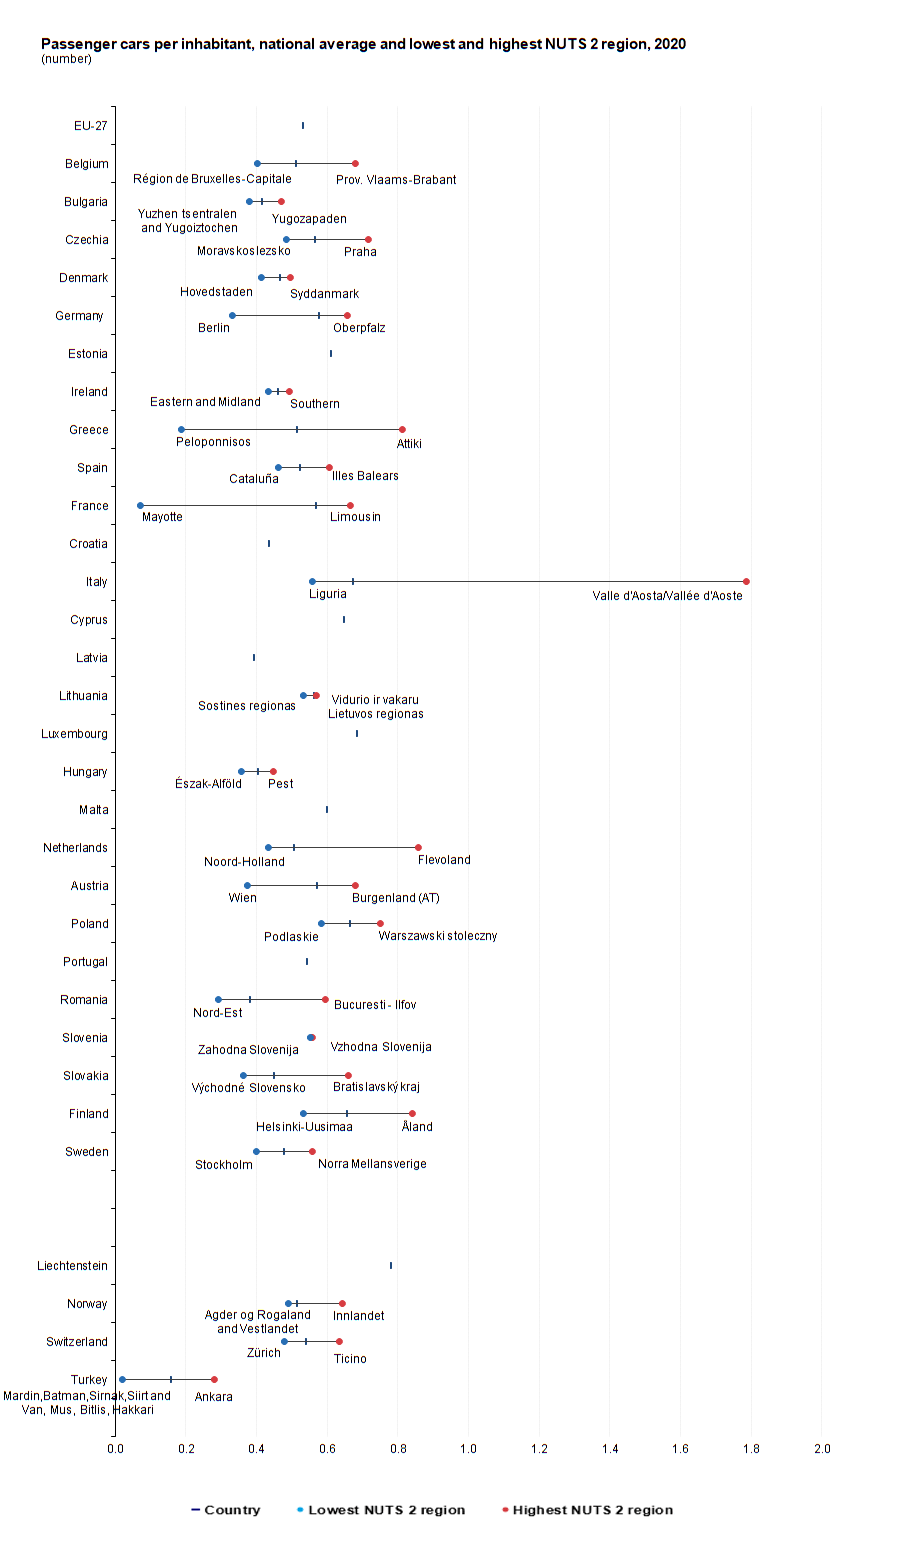
Passenger cars per inhabitant, national average and lowest and highest NUTS 2 region, 2020.png
(
file
)
90 KB
1
First page
Previous page
Next page
Last page
Special page
ISSN 2443-8219


.png)
.png)
.png)
.png)

.png)

.png)


.png)

.png)
.png)
.png)


.png)


,_by_NUTS_2_region,_2020.png)

_.png)
.png)


_.png)
