Tutorials
Log in
Statistics Explained
menu
search
search
Navigation
Main page
Statistical themes
Glossary
Categories
Statistics 4 beginners
Tutorials
Help
Eurostat home
Education corner
Online publications
Regional yearbook
Sustainable development
Full list
Tools
User contributions
Logs
View user groups
Special pages
search
Navigation
Main page
Statistical themes
Glossary
Categories
Statistics 4 beginners
Tutorials
Help
Eurostat home
Education corner
Online publications
Regional yearbook
Sustainable development
Full list
Tools
User contributions
Logs
View user groups
Special pages
Navigation
Main page
Statistical themes
Glossary
Categories
Statistics 4 beginners
Tutorials
Help
Eurostat home
Education corner
Online publications
Regional yearbook
Sustainable development
Full list
Tools
User contributions
Logs
View user groups
Special pages
Uploads by Martecr
This special page shows all uploaded files.
File list
Items per page:
20
50
100
250
500
Search for media name:
Username:
Include old versions of files
Go
Date
Name
Thumbnail
Size
Description
Versions
16:42, 14 October 2022
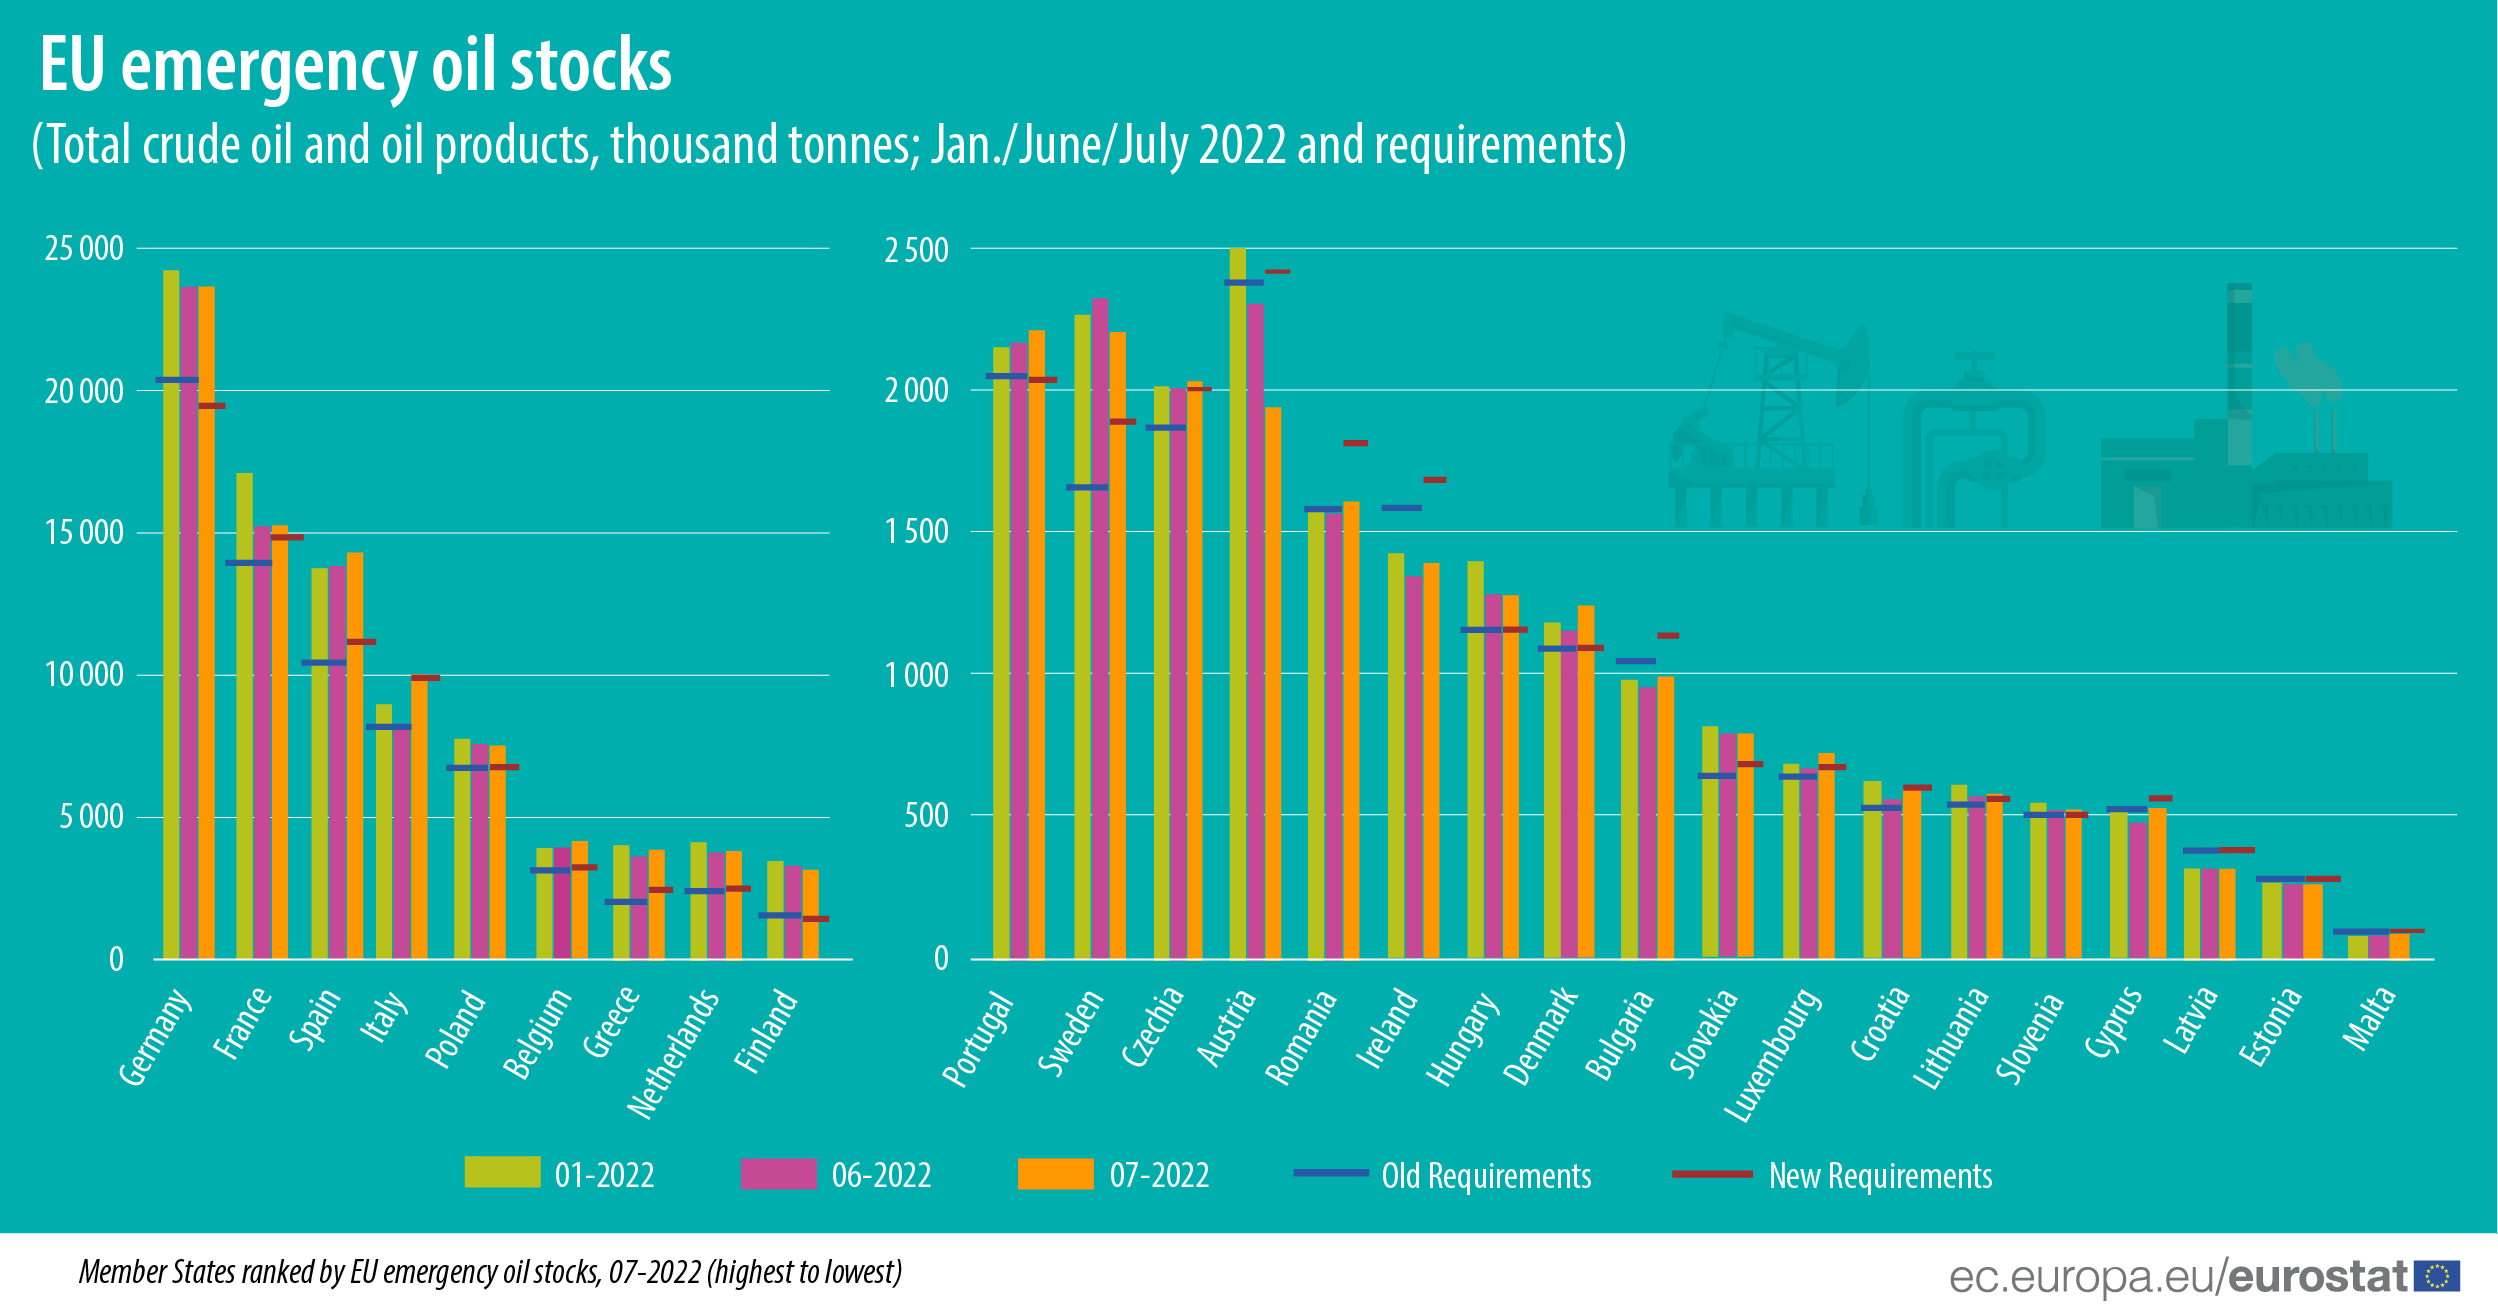
18-10-oil-stock-V1-web-comm.png
(
file
)
145 KB
1
16:40, 14 October 2022
18-10-oil-stock-V2-web-em.png
(
file
)
136 KB
1
16:34, 14 October 2022
Emergency and commercial oil stocks data - edition 2022.xls
(
file
)
85 KB
1
16:26, 14 October 2022
Emergency and commercial oil stocks - data edition 2022.xls
(
file
)
130 KB
1
11:30, 13 October 2022
Emergency oil stocks in days equivalent, Jan, Jun, Jul 2022 (Days equivalent for total crude oil and petroleum products).png
(
file
)
55 KB
1
10:43, 13 October 2022
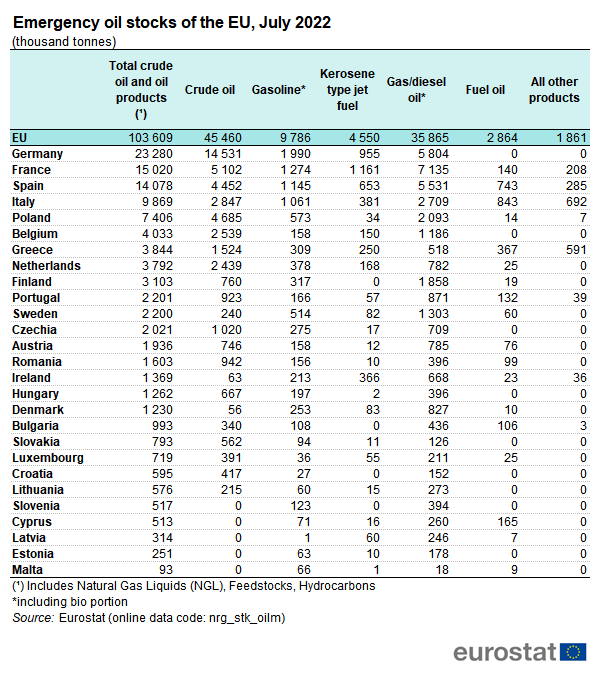
Emergency oil stocks of the EU, July 2022 (thousand tonnes).png
(
file
)
56 KB
1
13:24, 16 February 2022
Production of petroleum products, EU, 2020 (million tonnes of oil equivalent).png
(
file
)
90 KB
1
13:13, 16 February 2022
Import dependency, crude oil and total oil, 1990-2020 (% of net imports to gross available energy).png
(
file
)
105 KB
1
11:53, 16 February 2022
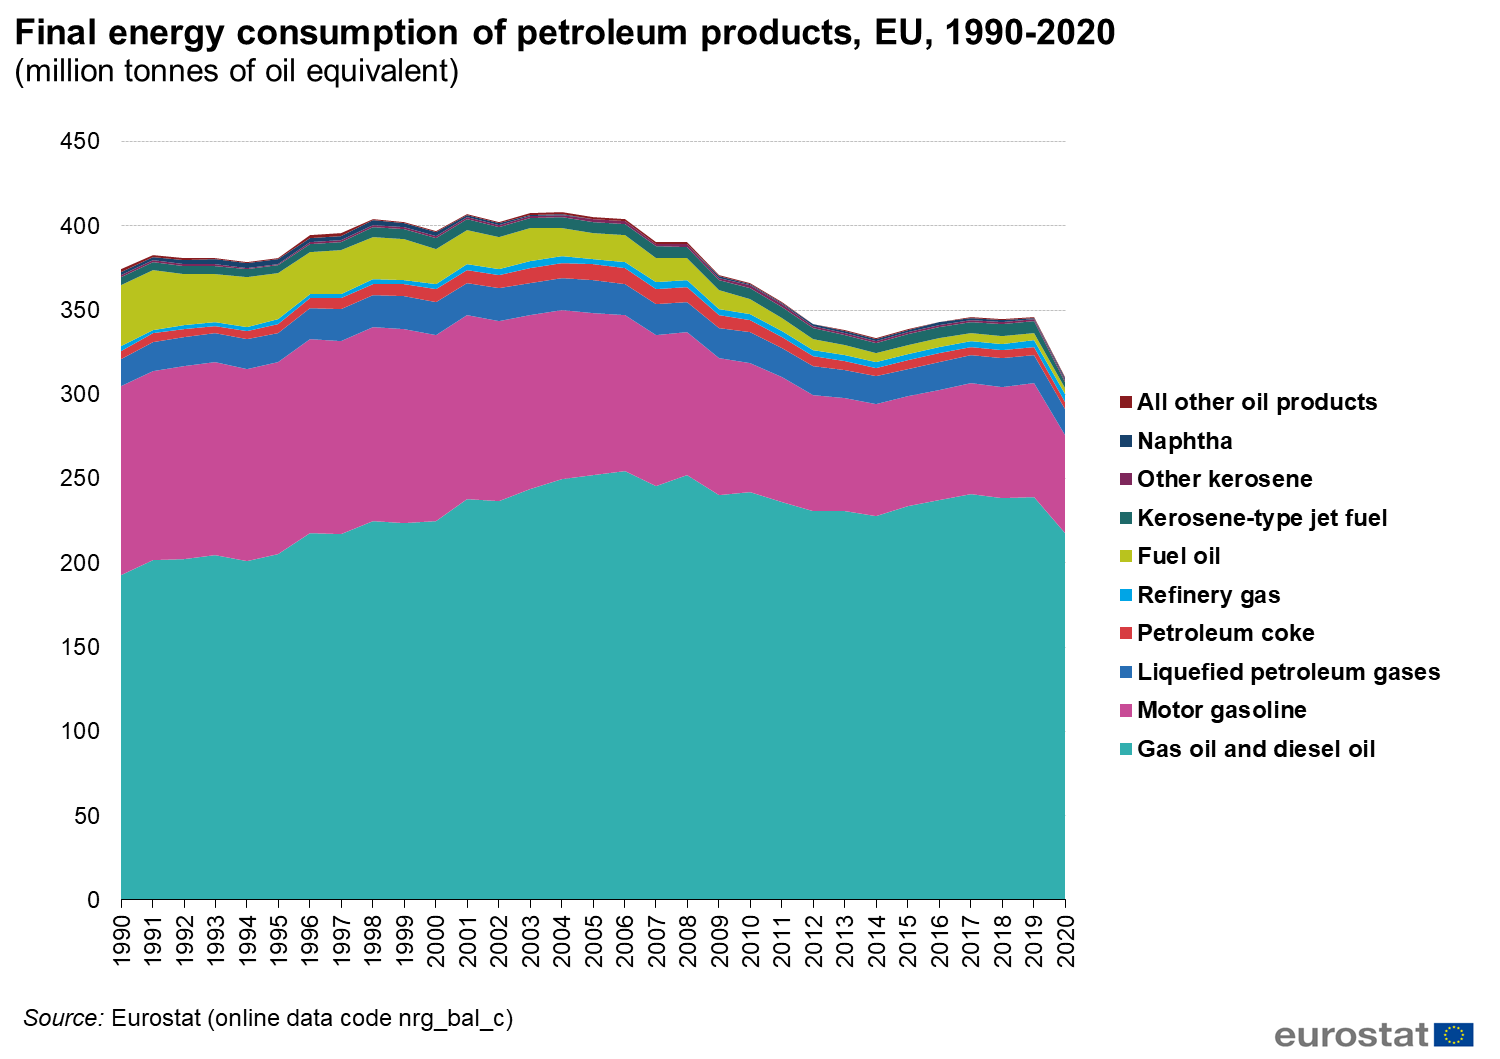
Final energy consumption of petroleum products, EU, 1990-2020 (million tonnes of oil equivalent).png
(
file
)
115 KB
1
11:37, 16 February 2022
Fig 6 Import dependency, crude oil and total oil, 1990-2020 (% of net imports to gross available energy).png
(
file
)
106 KB
1
15:10, 28 September 2021
Emergency and commercial oil stocks - Sept 2021.xls
(
file
)
188 KB
2
14:59, 28 September 2021
Emergency and commercial oil stocks of the EU, June 2021 (Total crude oil and oil products, thousand tonnes).png
(
file
)
132 KB
2
11:21, 28 September 2021
Emergency oil stocks of the EU, June 2021 (thousand tonnes).png
(
file
)
428 KB
3
16:20, 27 September 2021
Commercial oil stocks changes, EU, June 2020 and June 2021 (Total crude oil and oil products, % change from same month of previous year).png
(
file
)
132 KB
1
16:18, 27 September 2021
Commercial oil stocks changes, EU, June 2020 and June 2021 (Total crude oil and oil products, in thousand tonnes, from same month of previous year).png
(
file
)
145 KB
1
08:59, 24 September 2021
Fig 1 Emergency oil stocks by location, June 2021 (Total crude oil and petroleum products, thousand tonnes).png
(
file
)
126 KB
1
15:06, 21 September 2021
Emergency oil stocks in days equivalent, June 2021 (for total crude oil and petroleum products, based on requirements).png
(
file
)
185 KB
1
16:26, 30 August 2021
Table and figures on oil and petroleum products 2019.xlsx
(
file
)
153 KB
Reverted to version as of 16:21, 30 August 2021 (CEST)
4
16:11, 30 August 2021
Consumption of oil, EU, 2019 (%).png
(
file
)
77 KB
1
16:22, 26 August 2021
Sectoral oil dependency, EU, in selected years, 1990-2019 (%).png
(
file
)
352 KB
Reverted to version as of 16:16, 26 August 2021 (CEST)
4
15:38, 26 August 2021
Use of fuels in road transport, EU, 1990 and 2019 (%).png
(
file
)
254 KB
1
14:55, 26 August 2021
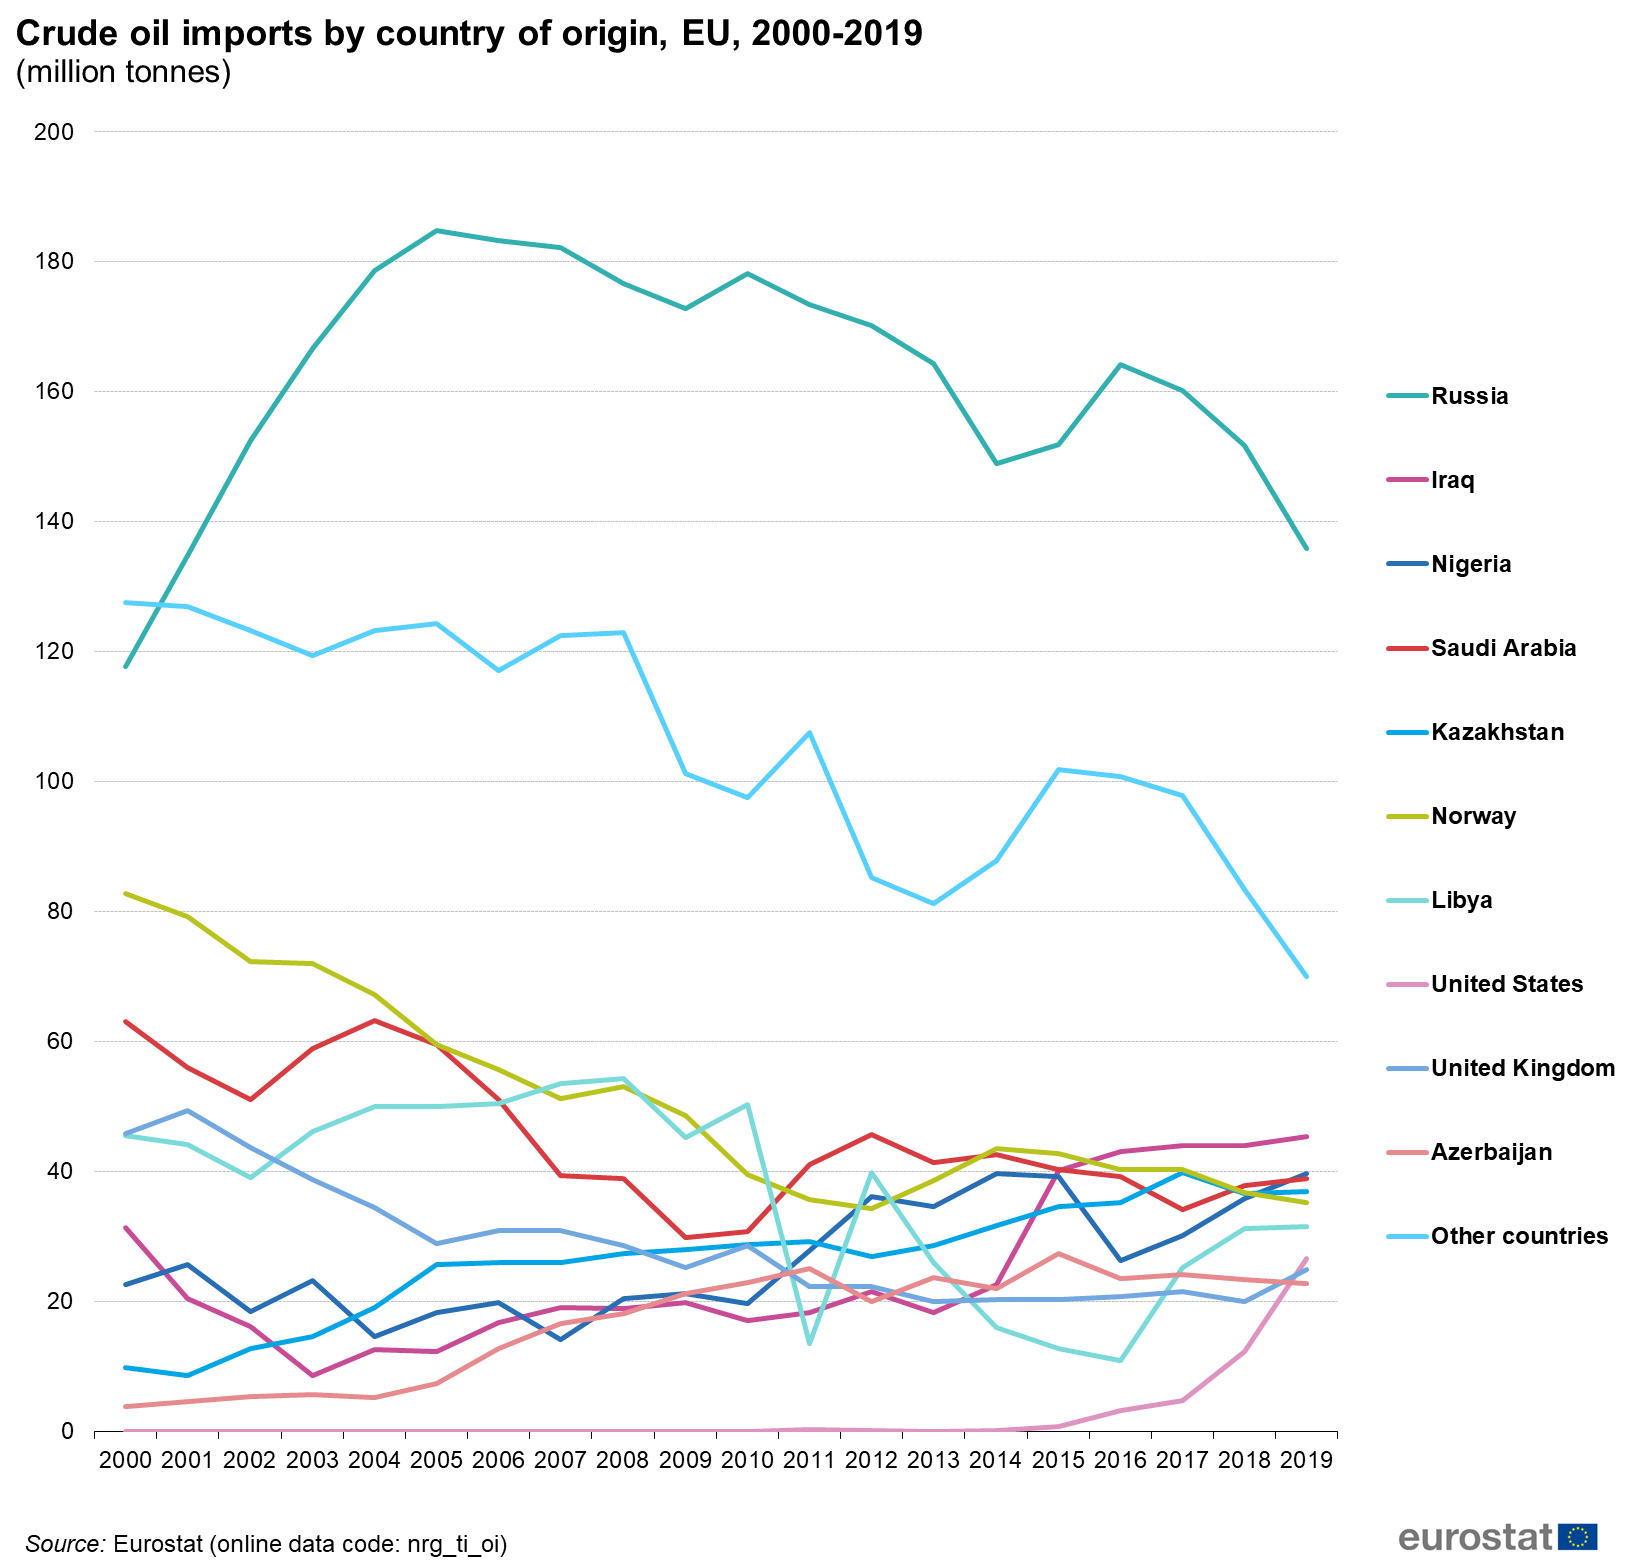
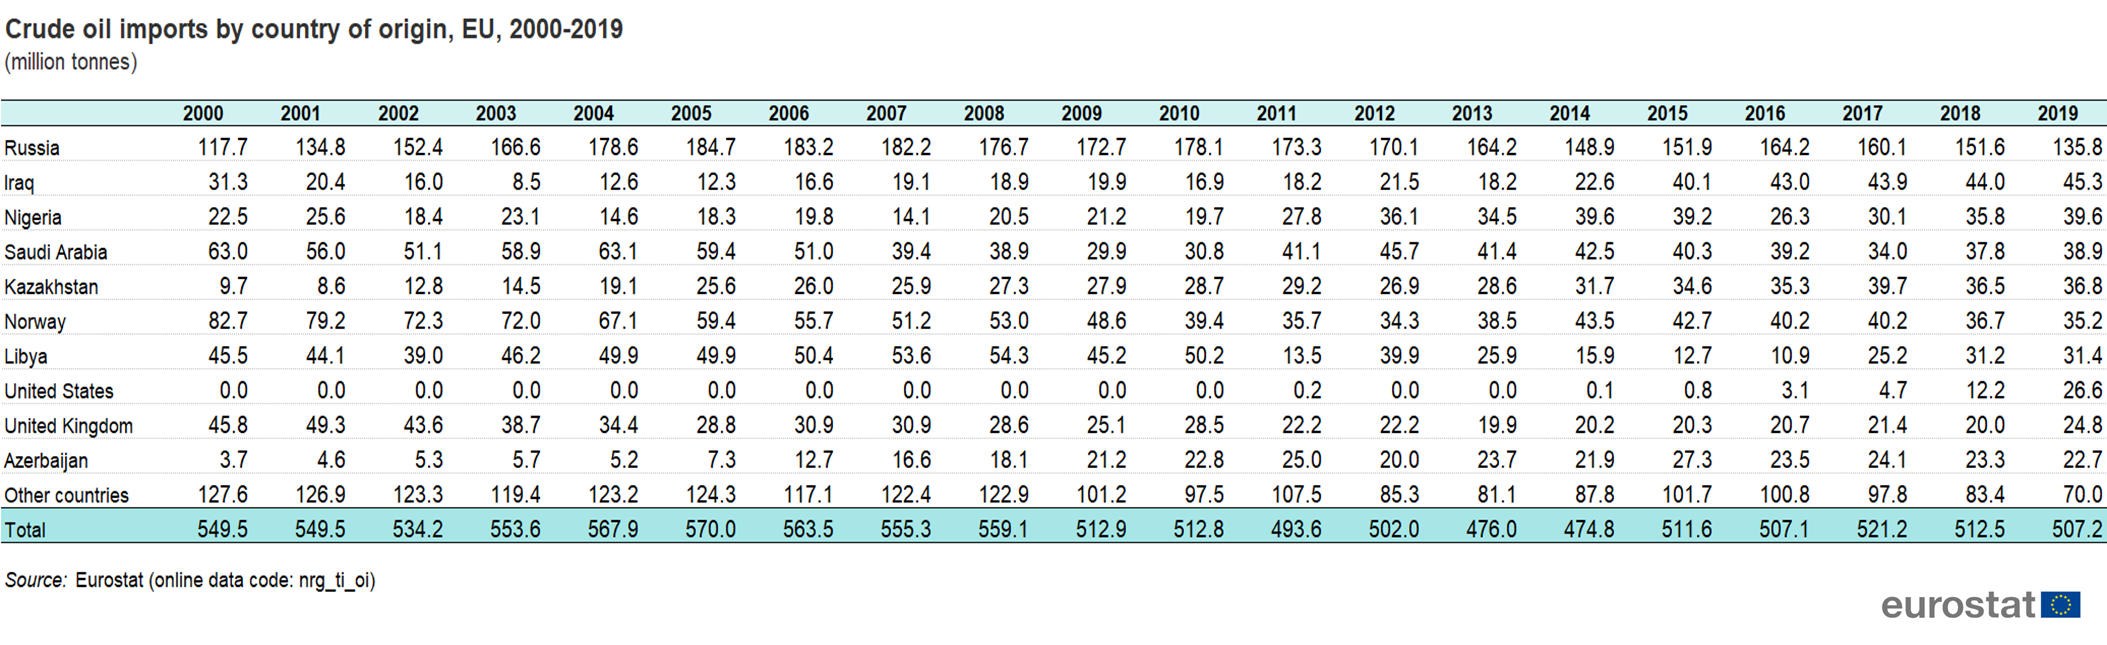
Imports of crude oil by country of origin, EU, 2000-2019 (million tonnes).png
(
file
)
177 KB
1
14:25, 26 August 2021
Consumption in international aviation and navigation, EU, 1990-2019 (million tonnes of oil equivalent).png
(
file
)
81 KB
1
16:54, 25 August 2021
Use of fuels in road transport, EU-27, 1990 and 2019 (%).png
(
file
)
340 KB
1
15:21, 25 August 2021
Final energy consumption of petroleum products, EU, 1990-2019 (million tonnes of oil equivalent) .png
(
file
)
105 KB
1
17:12, 20 August 2021
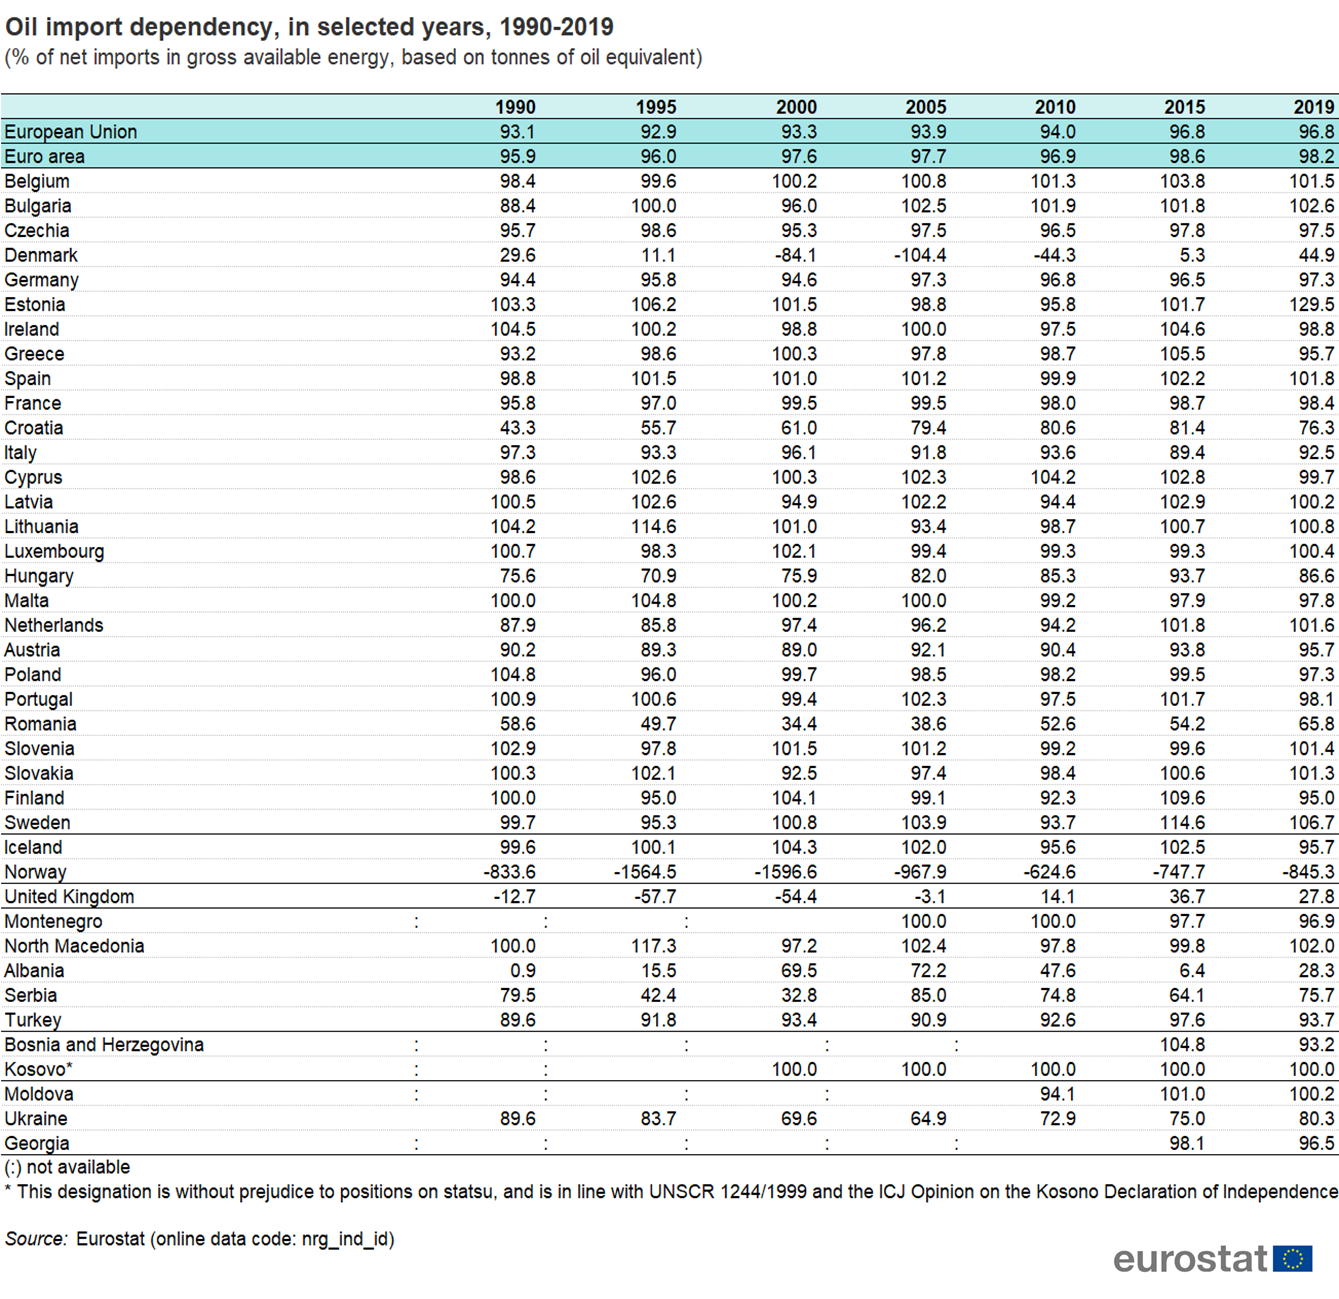
Oil import dependency, in selected years, 1990-2019 (% of net imports in gross available energy, based on tonnes of oil equivalent).png
(
file
)
682 KB
1
16:52, 20 August 2021
Net imports of selected petroleum products, EU, in selected years, 1990-2019 (million tonnes of oil equivalent) .png
(
file
)
225 KB
1
16:05, 20 August 2021
Crude oil imports by country of origin, EU, 2000-2019 (million tonnes).png
(
file
)
535 KB
3
Special page
ISSN 2443-8219


.png)
.png)
.png)
.png)
.png)
.png)
.png)
.png)
.png)
.png)
.png)
.png)
.png)
.png)
.png)
.png)
.png)
.png)
_.png)
.png)
_.png)
.png)