Tutorials
Log in
Statistics Explained
menu
search
search
Navigation
Main page
Statistical themes
Glossary
Categories
Statistics 4 beginners
Tutorials
Help
Eurostat home
Education corner
Online publications
Regional yearbook
Sustainable development
Full list
Tools
User contributions
Logs
View user groups
Special pages
search
Navigation
Main page
Statistical themes
Glossary
Categories
Statistics 4 beginners
Tutorials
Help
Eurostat home
Education corner
Online publications
Regional yearbook
Sustainable development
Full list
Tools
User contributions
Logs
View user groups
Special pages
Navigation
Main page
Statistical themes
Glossary
Categories
Statistics 4 beginners
Tutorials
Help
Eurostat home
Education corner
Online publications
Regional yearbook
Sustainable development
Full list
Tools
User contributions
Logs
View user groups
Special pages
Uploads by Maphoto
This special page shows all uploaded files.
File list
Items per page:
20
50
100
250
500
Search for media name:
Username:
Include old versions of files
Go
First page
Previous page
Next page
Last page
Date
Name
Thumbnail
Size
Description
Versions
09:08, 15 July 2024
F1Share of external inflow from neighbouring territories in renewable freshwater resources - long-term average.png
(
file
)
61 KB
1
14:48, 12 July 2024
Water statistics 15-07-2024.xlsx
(
file
)
56 KB
1
14:44, 12 July 2024
Water statistics 12-07-2024.xlsx
(
file
)
57 KB
1
14:07, 10 July 2024
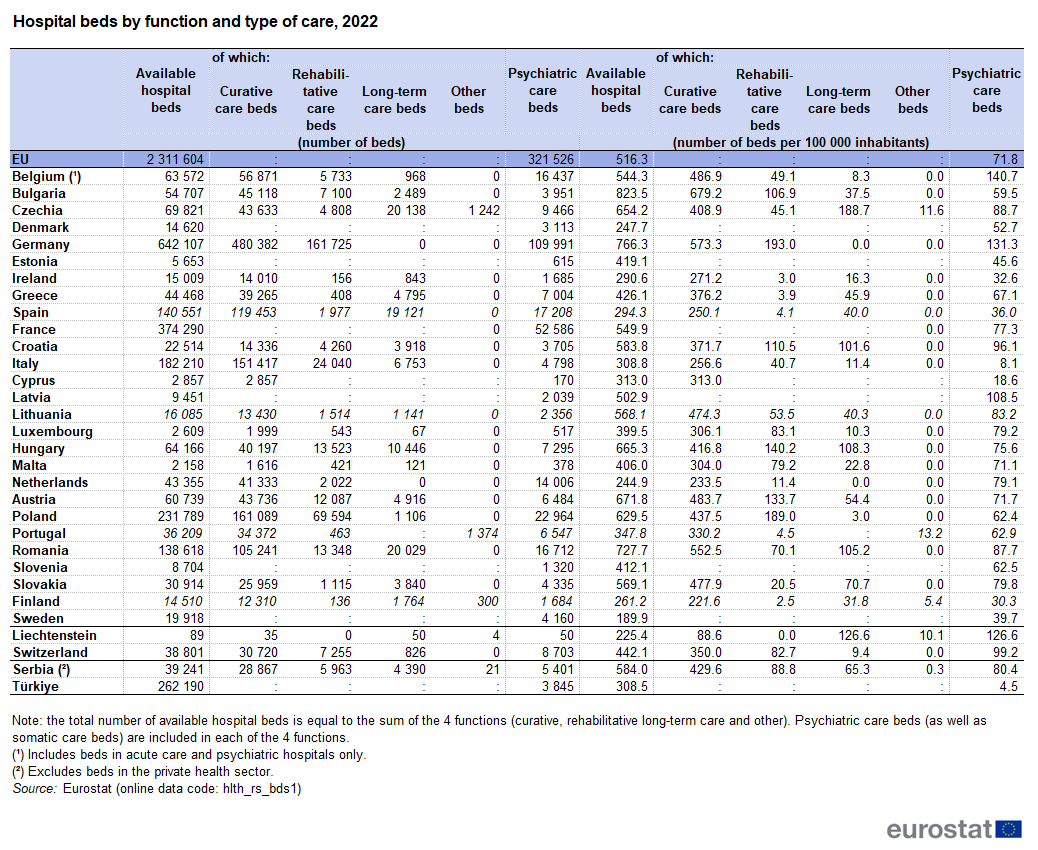
T1Hospital beds by function and type of care, 2022.png
(
file
)
83 KB
1
11:23, 5 July 2024
F4Total market production and gross domestic product, EU, 2015-24.png
(
file
)
45 KB
null
1
11:23, 5 July 2024
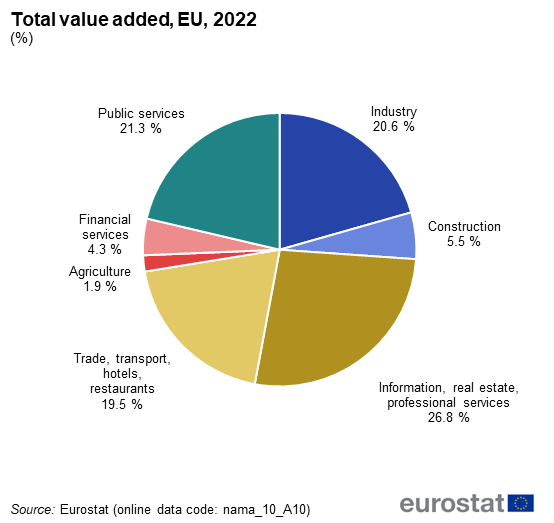
F3Total value added, EU, 2022.png
(
file
)
24 KB
null
1
11:23, 5 July 2024
F1Total market production, EU, EA, 2015-24.png
(
file
)
40 KB
null
1
11:23, 5 July 2024
STS Total Market Production Index July 2024.xlsx
(
file
)
65 KB
null
1
11:23, 5 July 2024
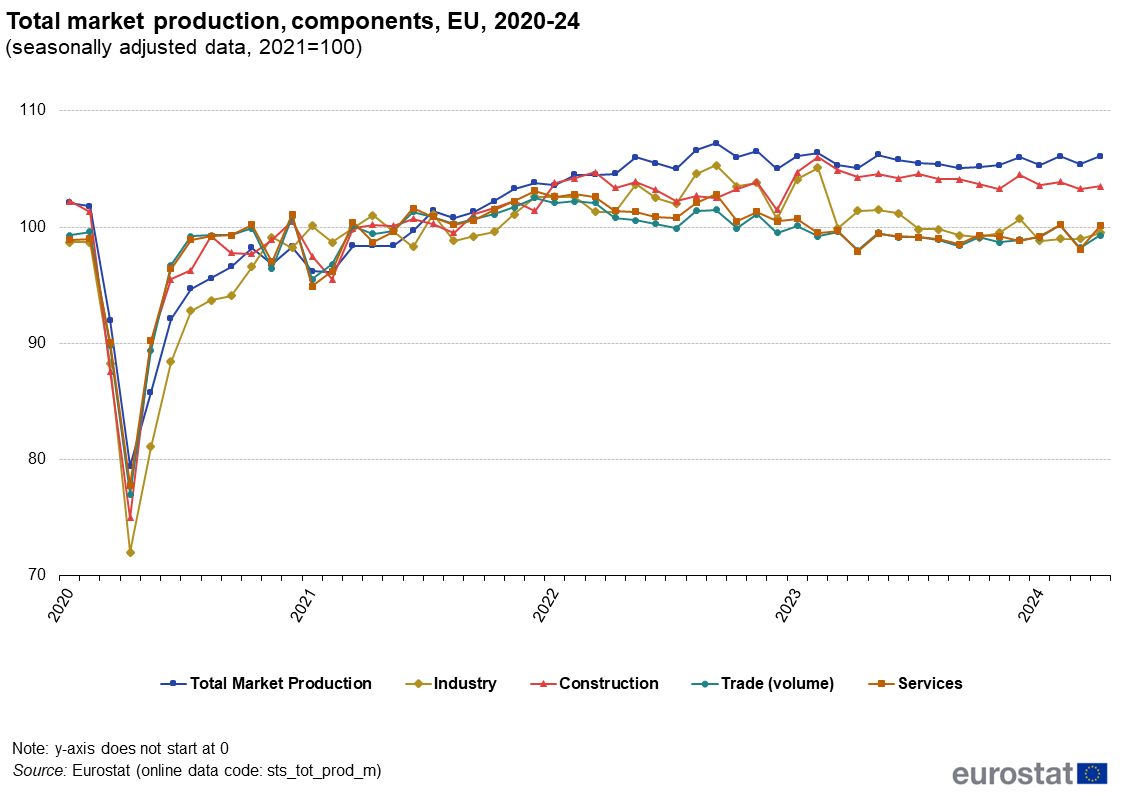
F2Total market production, components, EU, 2020-24.png
(
file
)
73 KB
null
1
11:37, 3 July 2024
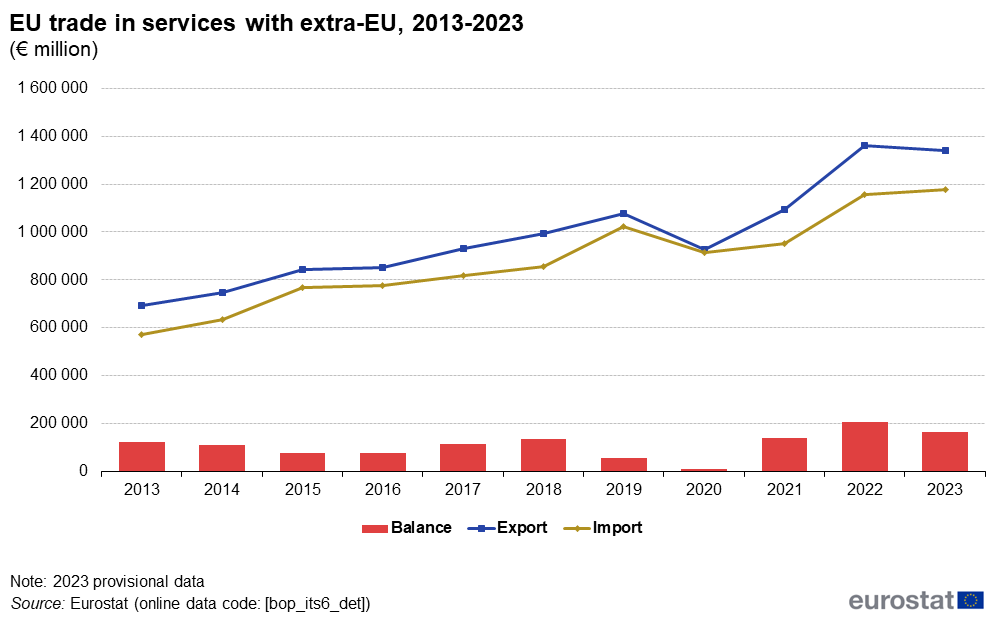
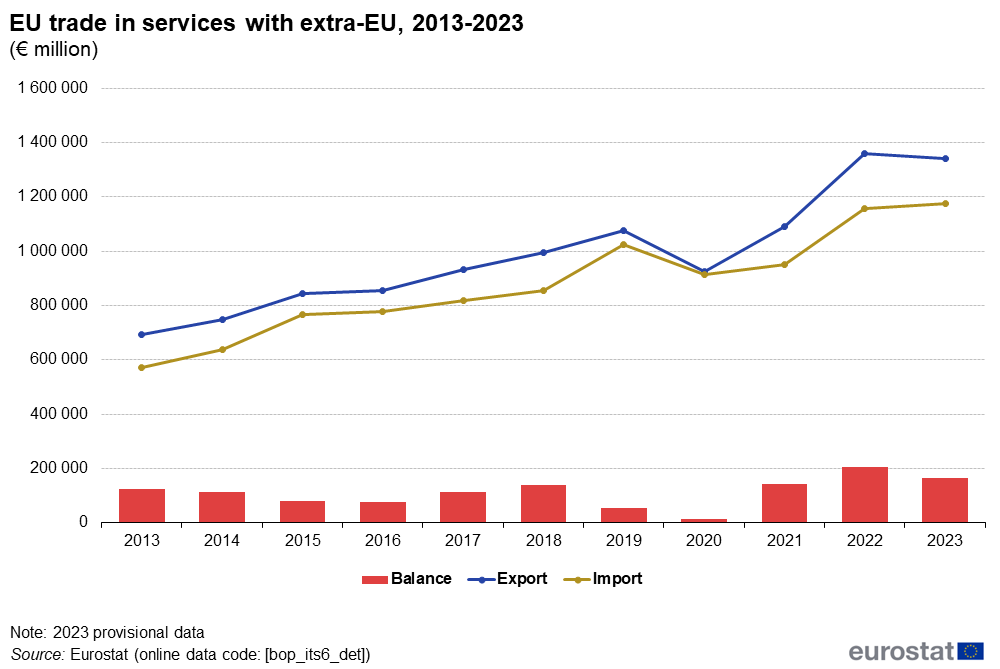
F1EU trade in services with extra-EU, 2013-2023v2.png
(
file
)
29 KB
null
1
11:37, 3 July 2024
BEC services June 2024 v4.xlsx
(
file
)
248 KB
null
1
10:52, 3 July 2024
International trade in services statistics by broad economic categories 03-07-2024v2.xlsx
(
file
)
13 KB
null
1
10:44, 3 July 2024
International trade in services statistics by broad economic categories 03-07-2024.xlsx
(
file
)
13 KB
null
1
10:44, 3 July 2024
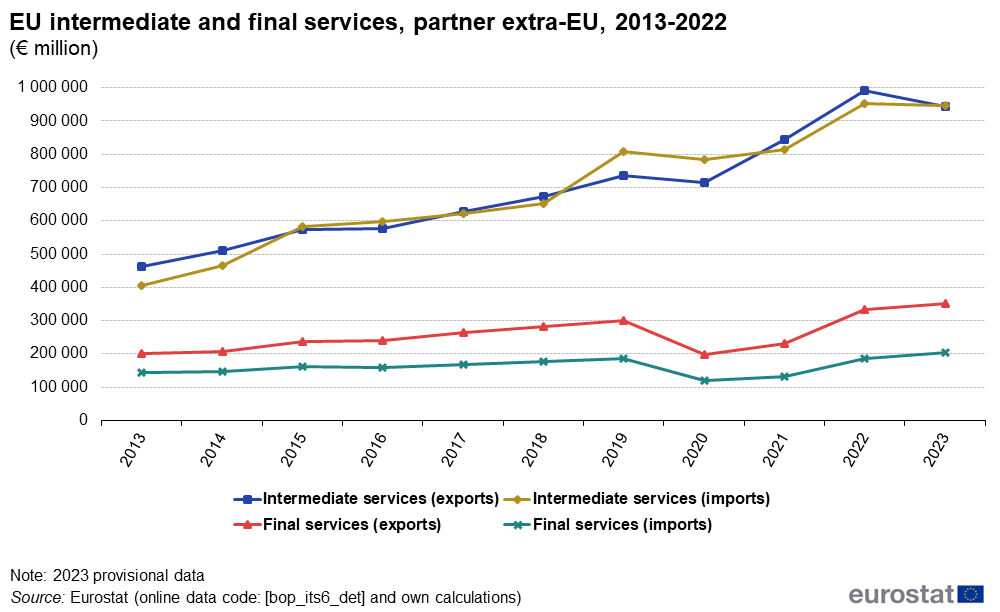
F2EU intermediate and final services, partner extra-EU, 2013-2023v2.png
(
file
)
40 KB
null
1
13:05, 2 July 2024
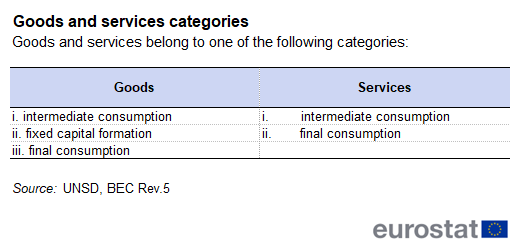
T1Goods and services categories.png
(
file
)
12 KB
null
1
13:05, 2 July 2024
BEC services June 2024 v3.xlsx
(
file
)
255 KB
null
1
12:52, 2 July 2024
F3bEU intermediate and final services, partner extra-EU, imports, 2013-2023 (%).png
(
file
)
45 KB
null
1
12:52, 2 July 2024
F3aEU intermediate and final services, partner extra-EU, exports, 2013-2023 (%).png
(
file
)
46 KB
null
1
12:52, 2 July 2024
F2EU intermediate and final services, partner extra-EU, 2013-2022.png
(
file
)
40 KB
null
1
12:52, 2 July 2024
F1EU trade in services with extra-EU, 2013-2023.png
(
file
)
31 KB
null
1
12:52, 2 July 2024
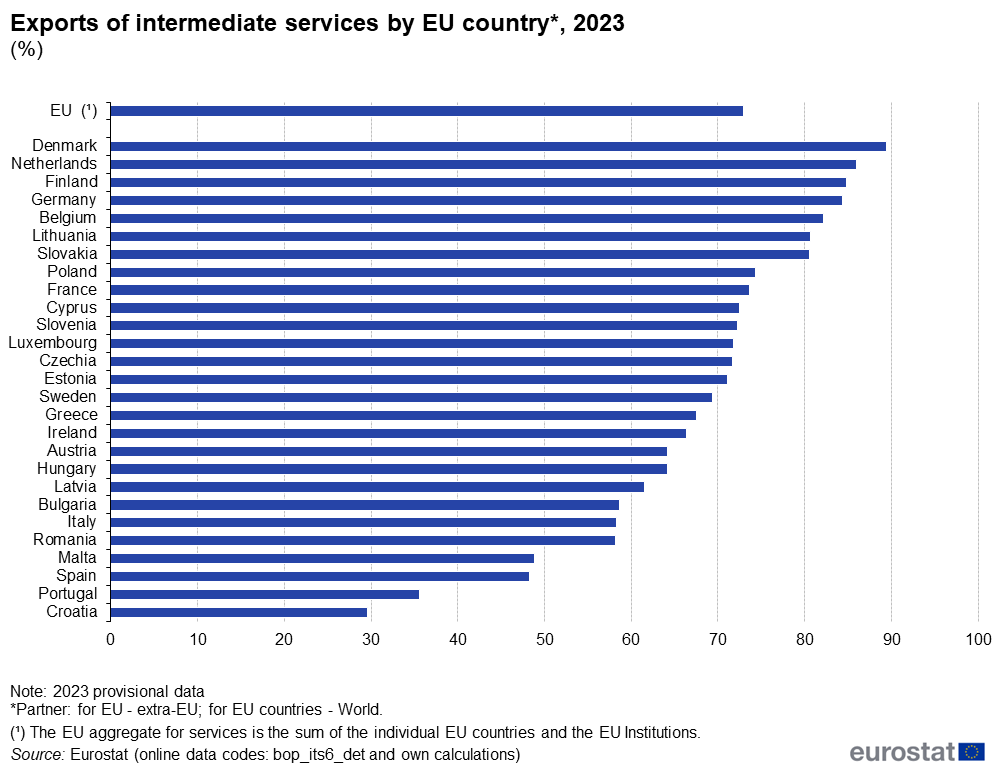
F5Exports of intermediate services by EU country 2023 (%).png
(
file
)
44 KB
null
1
12:52, 2 July 2024
F4dEU final services by BEC items, partner extra-EU, imports, 2023 (%).png
(
file
)
39 KB
null
1
12:52, 2 July 2024
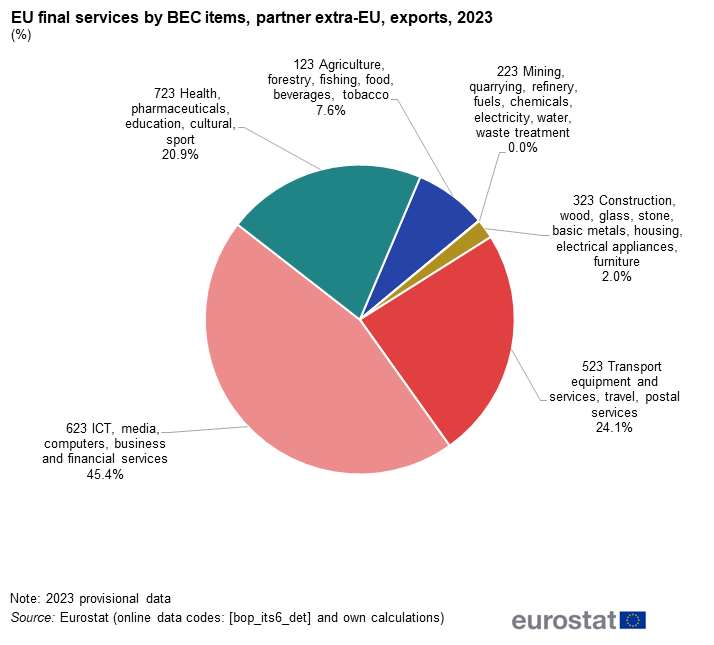
F4cEU final services by BEC items, partner extra-EU, exports, 2023 (%).png
(
file
)
38 KB
null
1
12:52, 2 July 2024
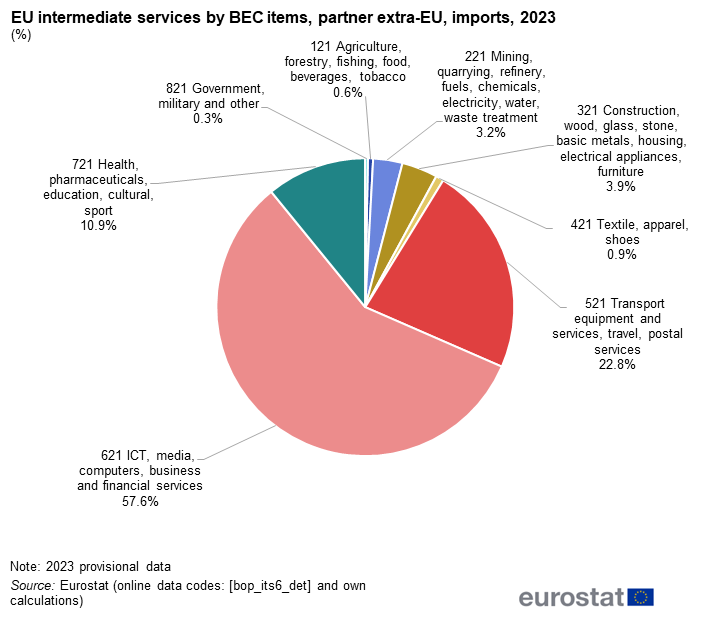
F4bEU intermediate services by BEC items, partner extra-EU, imports, 2023 (%).png
(
file
)
43 KB
null
1
12:52, 2 July 2024
F4aEU intermediate services by BEC items, partner extra-EU, exports, 2023 (%).png
(
file
)
45 KB
null
1
12:52, 2 July 2024
T1Goods and services belong to one of the following categories.png
(
file
)
12 KB
null
1
12:52, 2 July 2024
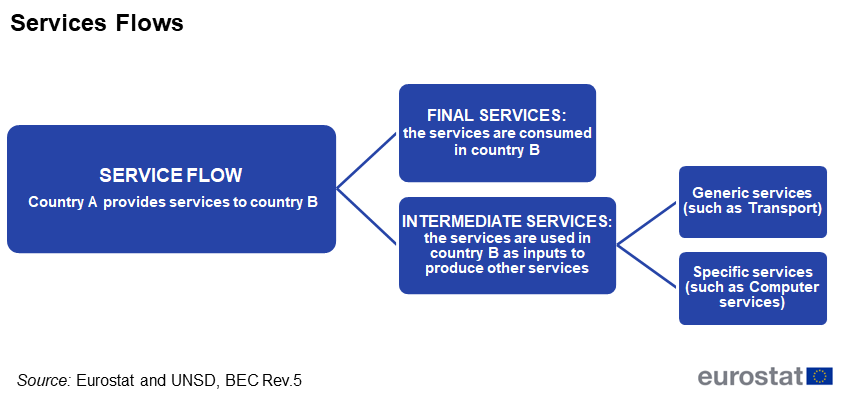
Services Flows.png
(
file
)
32 KB
null
1
12:52, 2 July 2024
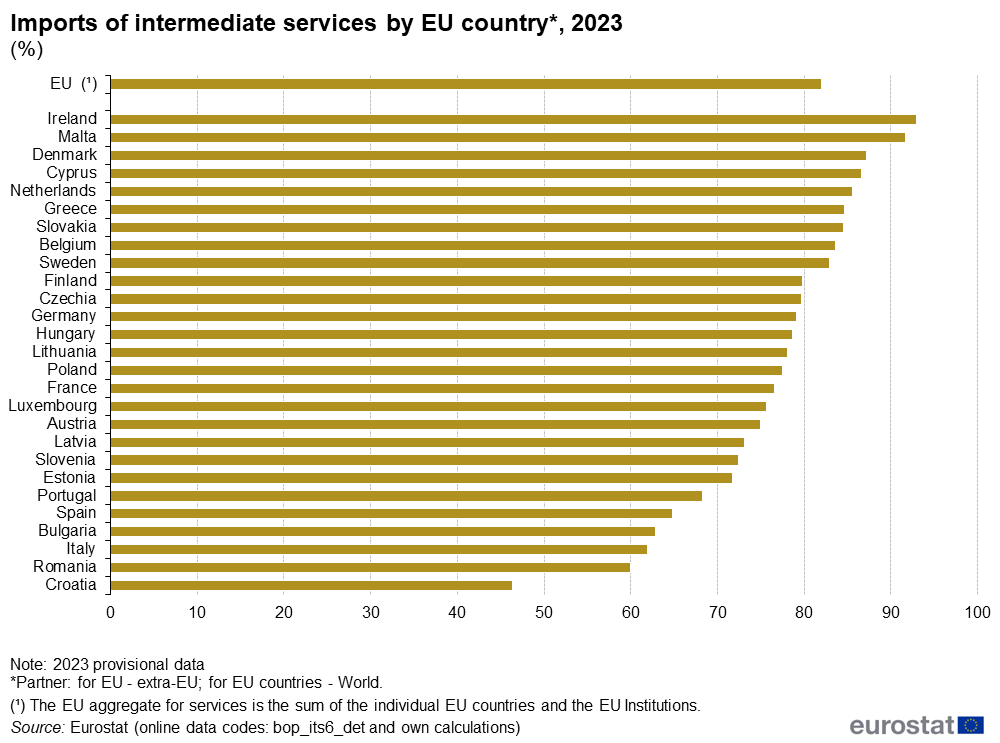
F6Imports of intermediate services by EU country 2023 (%).png
(
file
)
42 KB
null
1
12:52, 2 July 2024
BEC services June 2024 v2.xlsx
(
file
)
255 KB
null
1
10:10, 2 July 2024
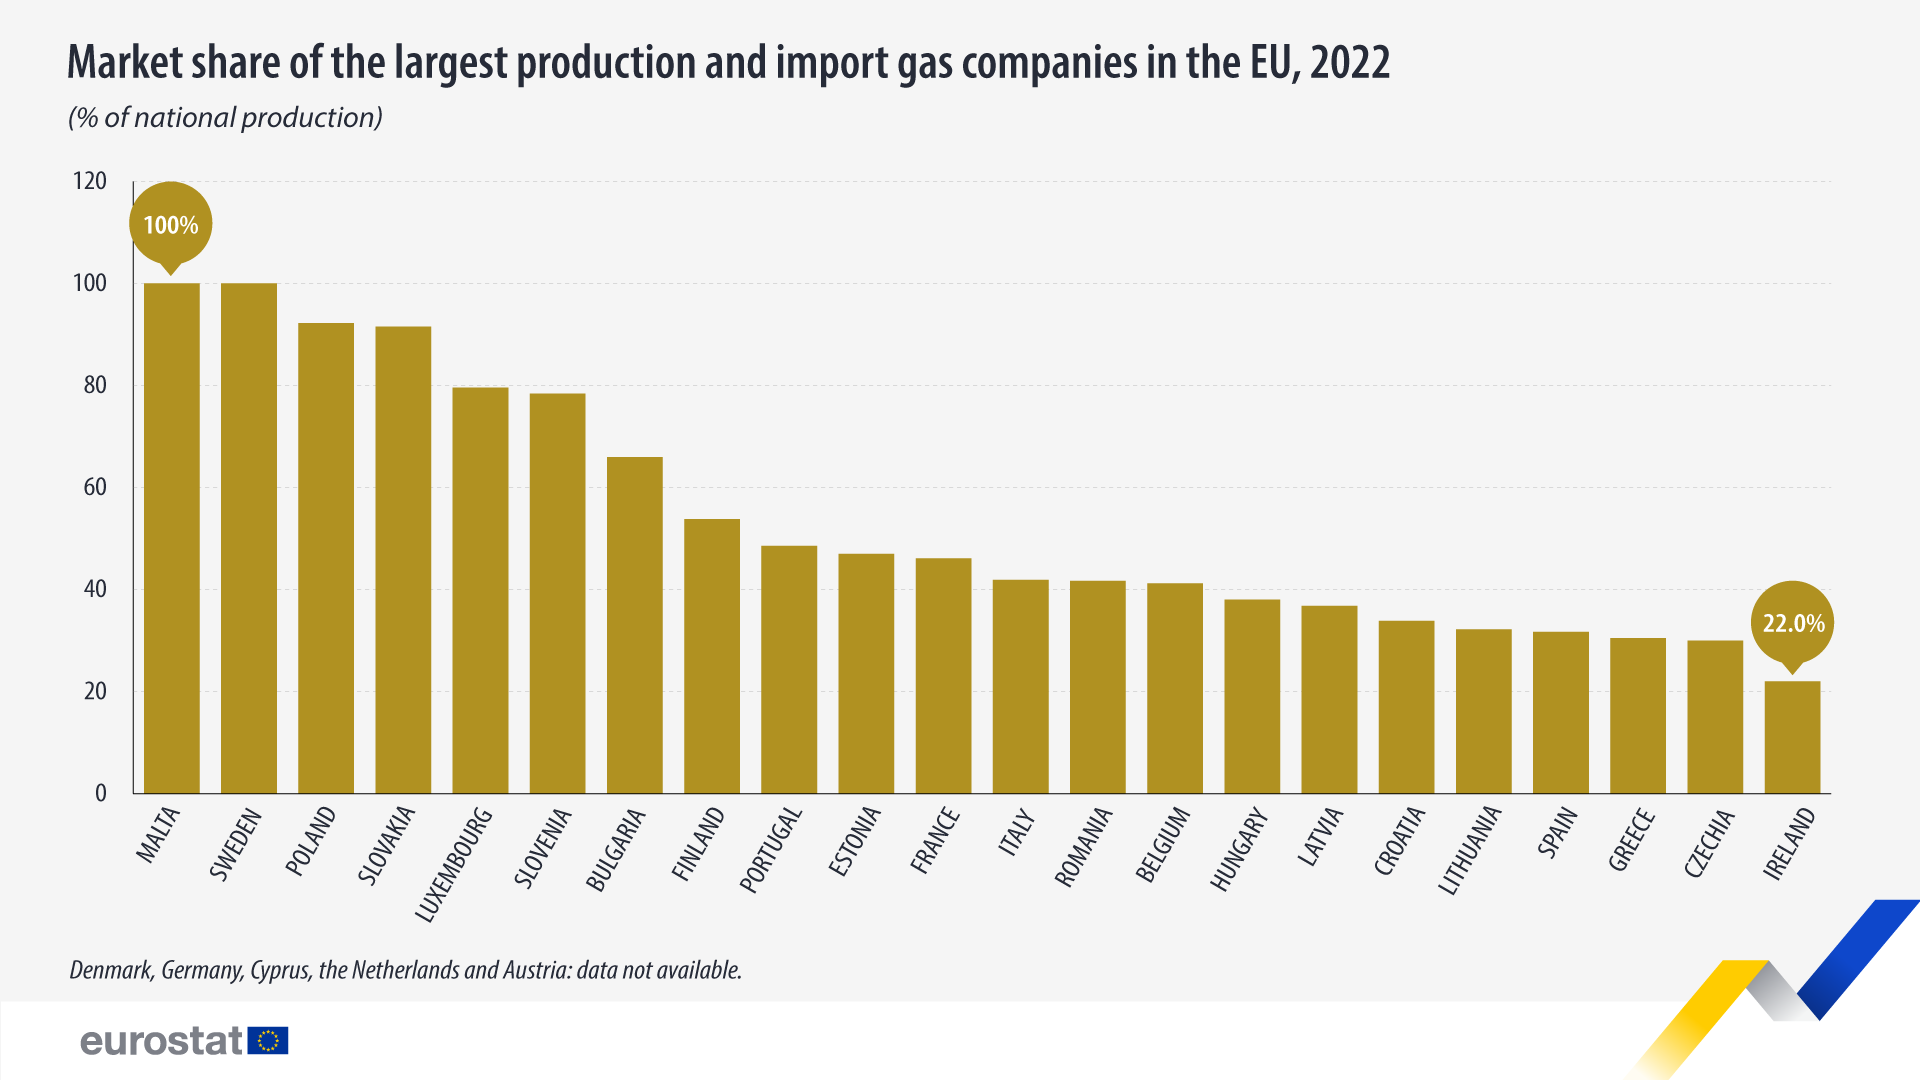
Market-share-largest-gas-companies-2022.png
(
file
)
89 KB
1
11:11, 28 June 2024
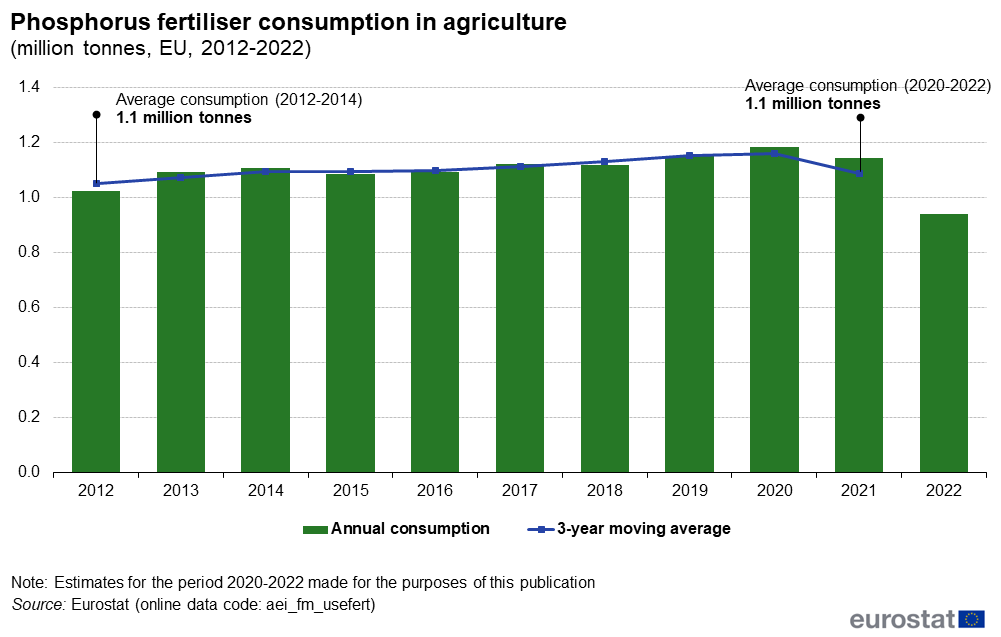
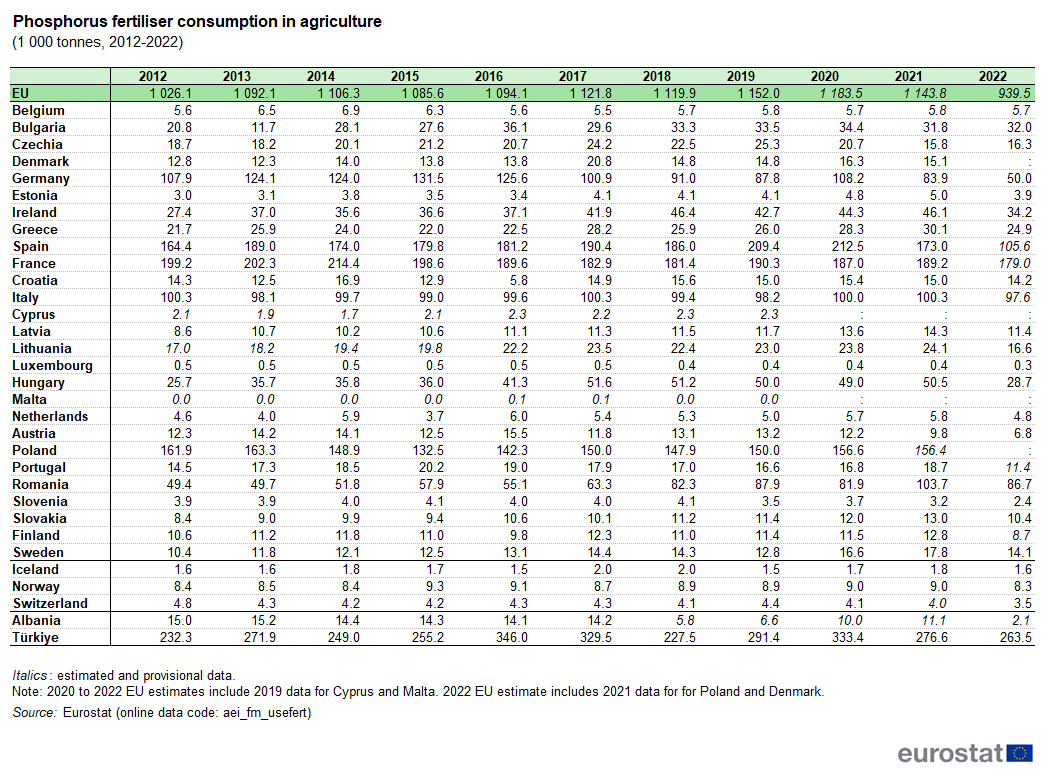
F3 Phosphorus fertiliser consumption in agriculture.png
(
file
)
47 KB
1
11:02, 28 June 2024
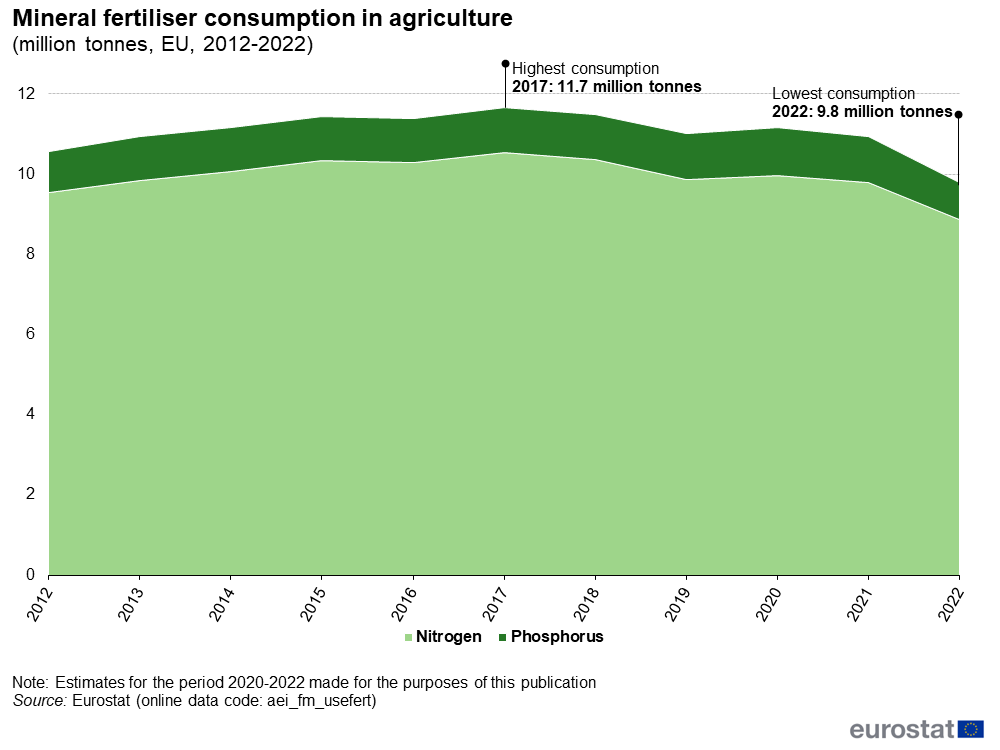
F1Mineral fertiliser consumption in agriculture.png
(
file
)
36 KB
null
1
11:02, 28 June 2024
F3Phosphorus fertiliser consumption in agriculture.png
(
file
)
43 KB
null
1
11:02, 28 June 2024
F2Nitrogen fertiliser consumption in agriculture.png
(
file
)
45 KB
null
1
11:02, 28 June 2024
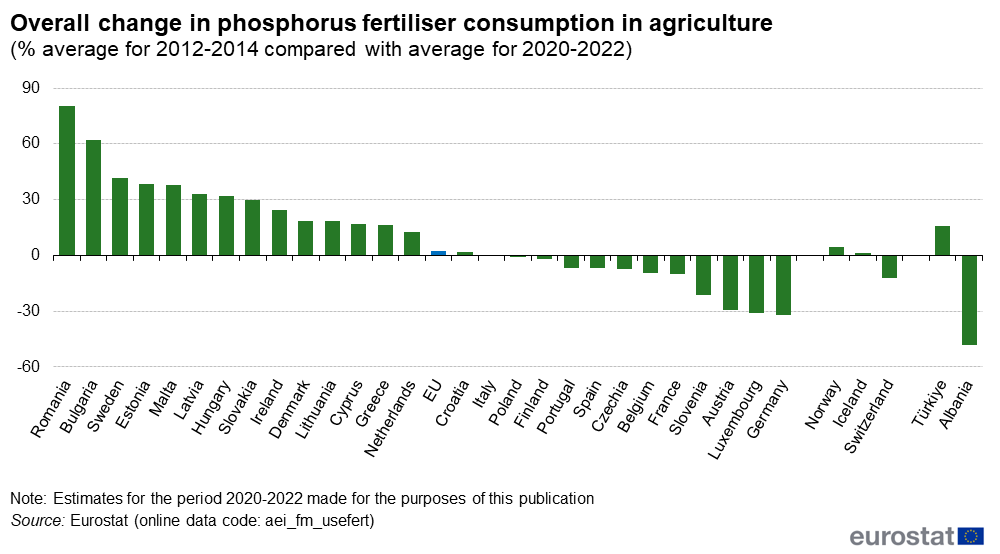
F5Overall change in phosphorus fertiliser consumption in agriculture.png
(
file
)
48 KB
null
1
11:02, 28 June 2024
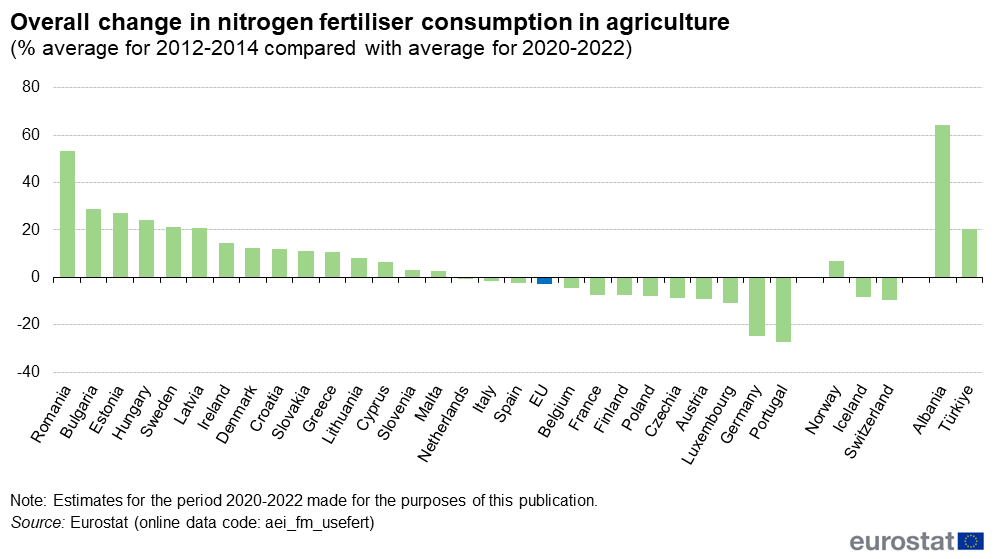
F4Overall change in nitrogen fertiliser consumption in agriculture.png
(
file
)
47 KB
null
1
11:02, 28 June 2024
T1Nitrogen fertiliser consumption in agriculture.png
(
file
)
74 KB
null
1
11:02, 28 June 2024
T2Phosphorus fertiliser consumption in agriculture.png
(
file
)
66 KB
null
1
11:02, 28 June 2024
Charts and tables Mineral Fertiliser Consumption 2022 20240621 v2.xlsx
(
file
)
92 KB
null
1
10:38, 28 June 2024
AgriMF2022.png
(
file
)
345 KB
1
12:35, 27 June 2024
F4Average number of foreign languages studied per pupil in secondary education, 2022.png
(
file
)
74 KB
1
12:18, 27 June 2024
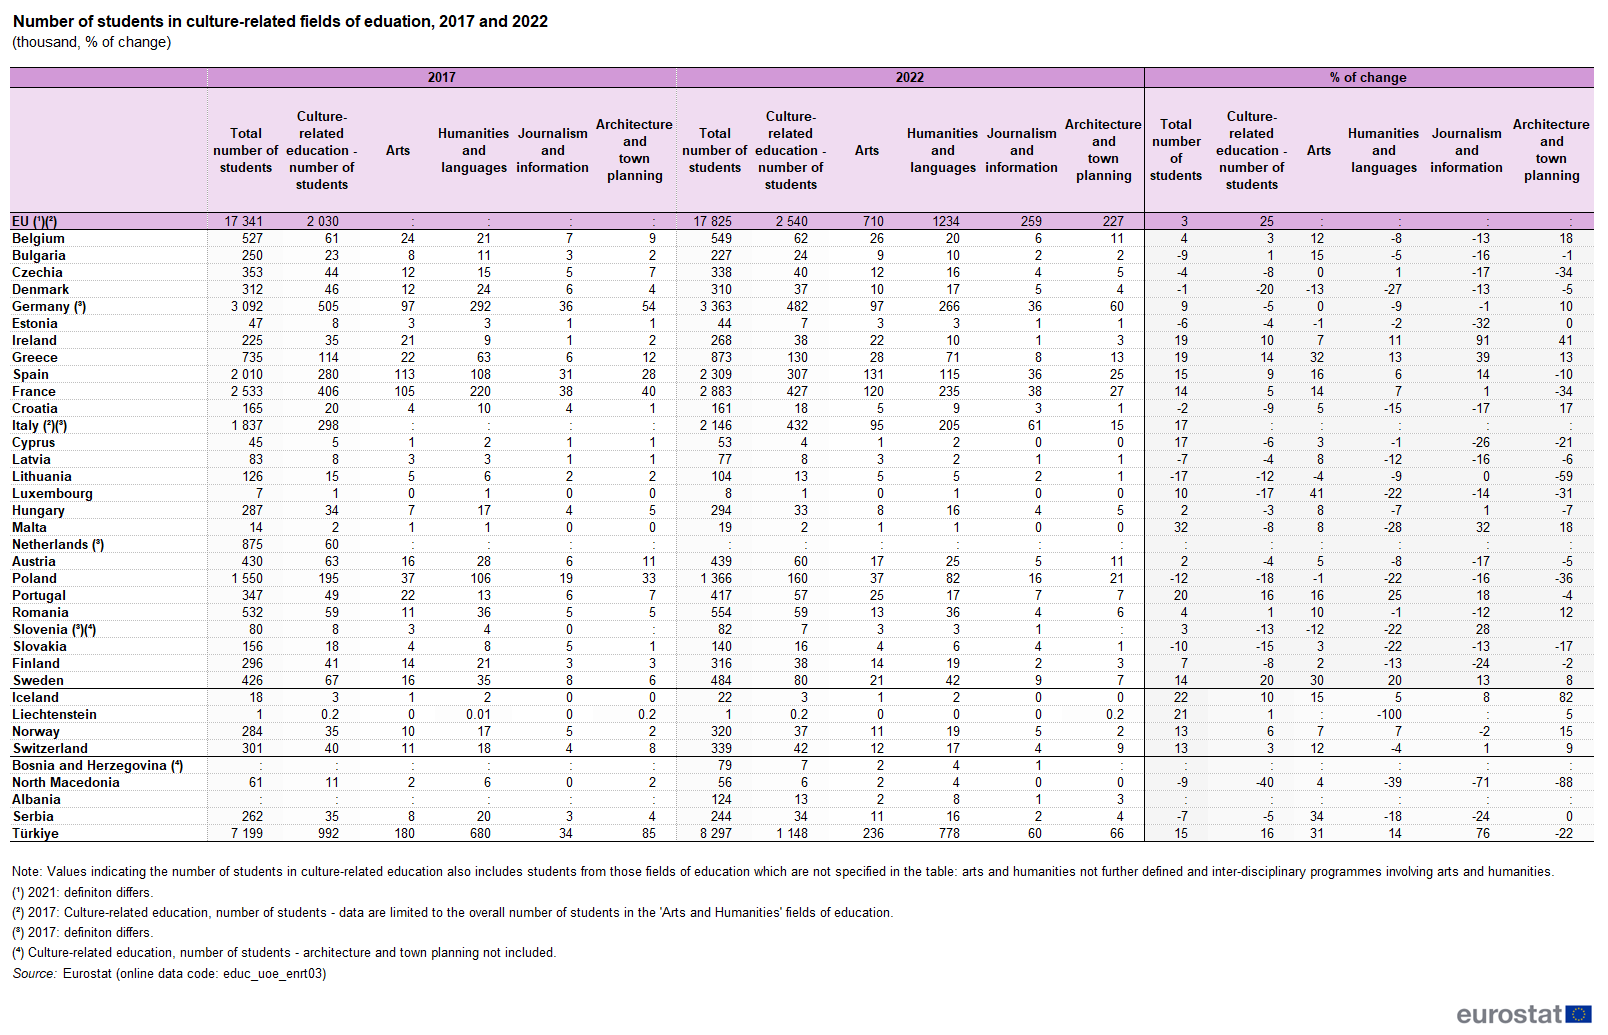
T1Number of students in culture-related fields of education, 2017 and 2022 (thousand, % of change).png
(
file
)
122 KB
1
12:16, 27 June 2024
T1Number of students in culture-related fields of eduation, 2017 and 2022.png
(
file
)
122 KB
1
16:27, 26 June 2024
Tertiary students in culture-related fields of education 2022 graph.xlsx
(
file
)
55 KB
1
13:31, 26 June 2024
F2 Supply of coal and coal products, EU (kilotonnes (kt)).png
(
file
)
46 KB
null
1
13:25, 26 June 2024
HighlightSupply of fossil fuels and nuclear, EUv2.png
(
file
)
60 KB
null
1
13:13, 26 June 2024
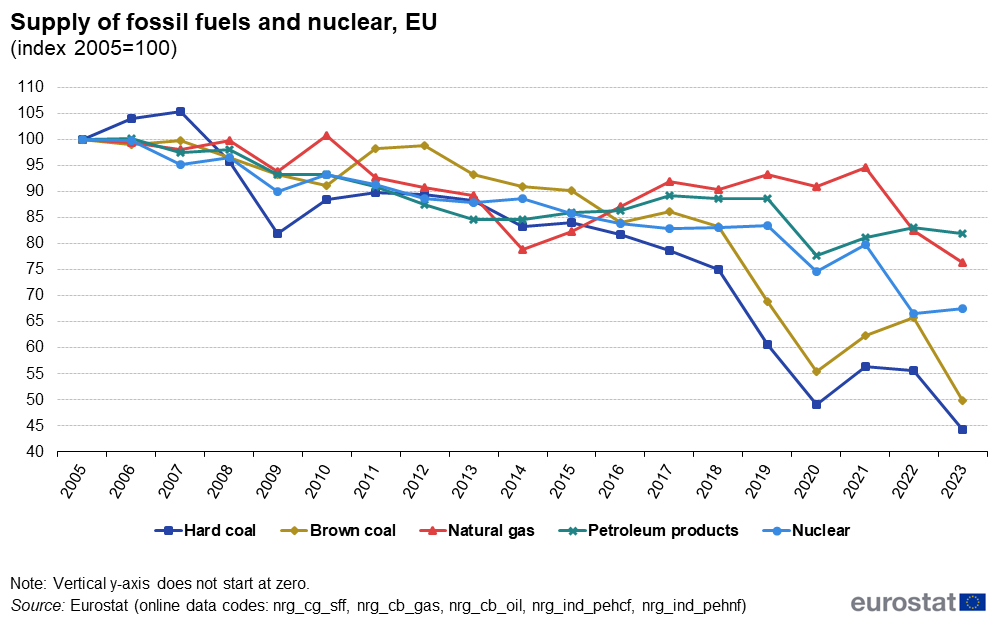
Highlight Supply of fossil fuels and nuclear, EU (index 2005=100).png
(
file
)
60 KB
null
1
13:05, 26 June 2024
Highlight Supply of fossil fuels and nuclear, EU.png
(
file
)
59 KB
null
1
13:05, 26 June 2024
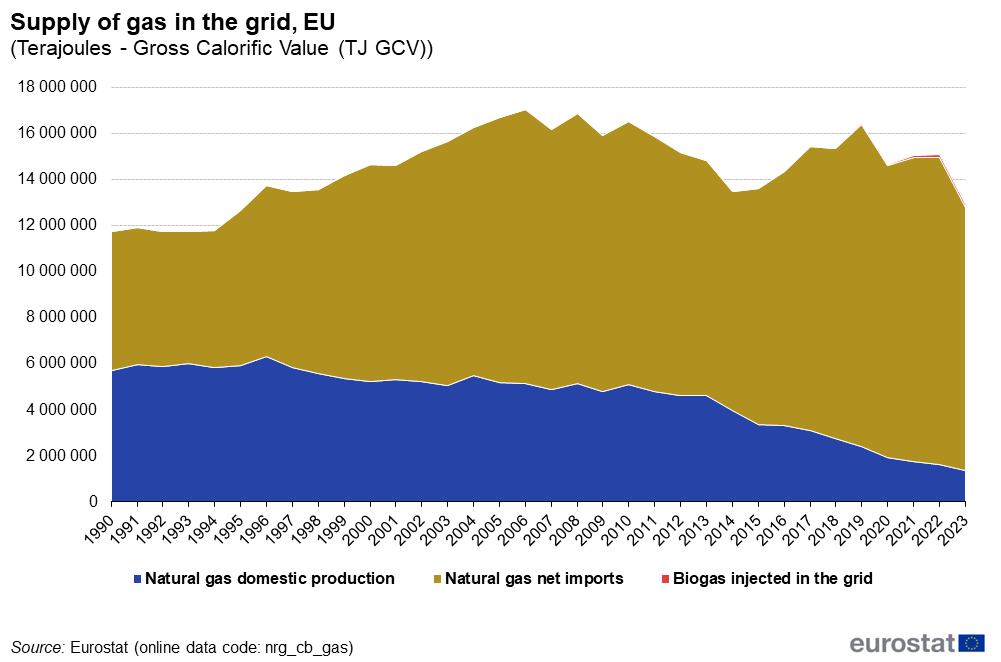
F1Supply of gas in the grid, EU.png
(
file
)
46 KB
null
1
13:05, 26 June 2024
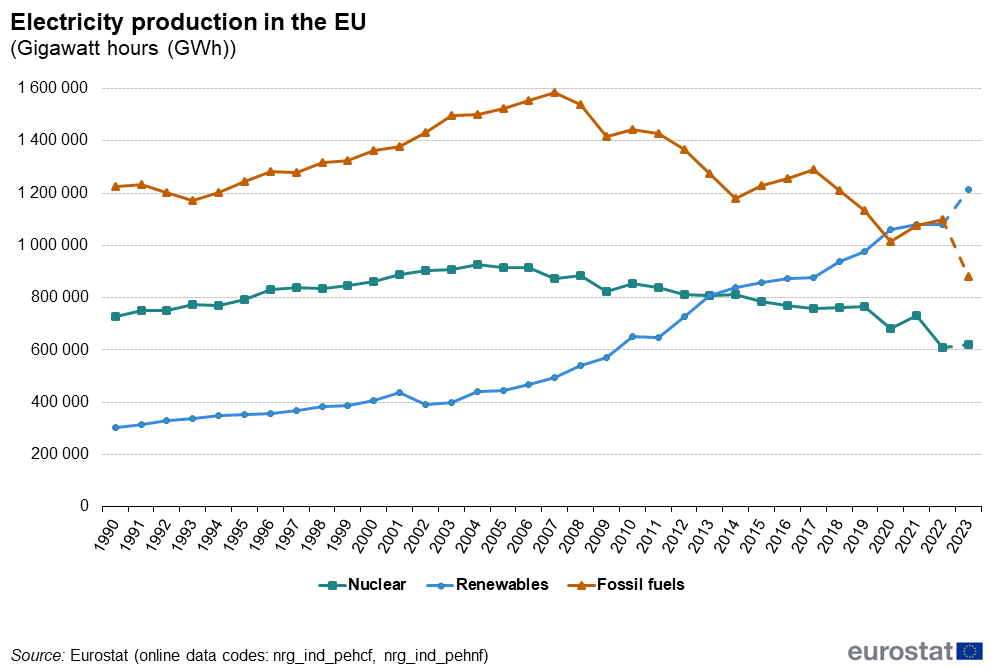
F4Electricity production in the EU.png
(
file
)
49 KB
null
1
First page
Previous page
Next page
Last page
Special page
ISSN 2443-8219


.png)
.png)


.png)
.png)
.png)
.png)
.png)


.png)


.png)

).png)

.png)


