Tutorials
Log in
Statistics Explained
menu
search
search
Navigation
Main page
Statistical themes
Glossary
Categories
Statistics 4 beginners
Tutorials
Help
Eurostat home
Education corner
Online publications
Regional yearbook
Sustainable development
Full list
Tools
User contributions
Logs
View user groups
Special pages
search
Navigation
Main page
Statistical themes
Glossary
Categories
Statistics 4 beginners
Tutorials
Help
Eurostat home
Education corner
Online publications
Regional yearbook
Sustainable development
Full list
Tools
User contributions
Logs
View user groups
Special pages
Navigation
Main page
Statistical themes
Glossary
Categories
Statistics 4 beginners
Tutorials
Help
Eurostat home
Education corner
Online publications
Regional yearbook
Sustainable development
Full list
Tools
User contributions
Logs
View user groups
Special pages
Uploads by Lienhav
This special page shows all uploaded files.
File list
Items per page:
20
50
100
250
500
Search for media name:
Username:
Include old versions of files
Go
First page
Previous page
Next page
Last page
Date
Name
Thumbnail
Size
Description
Versions
16:06, 1 June 2018
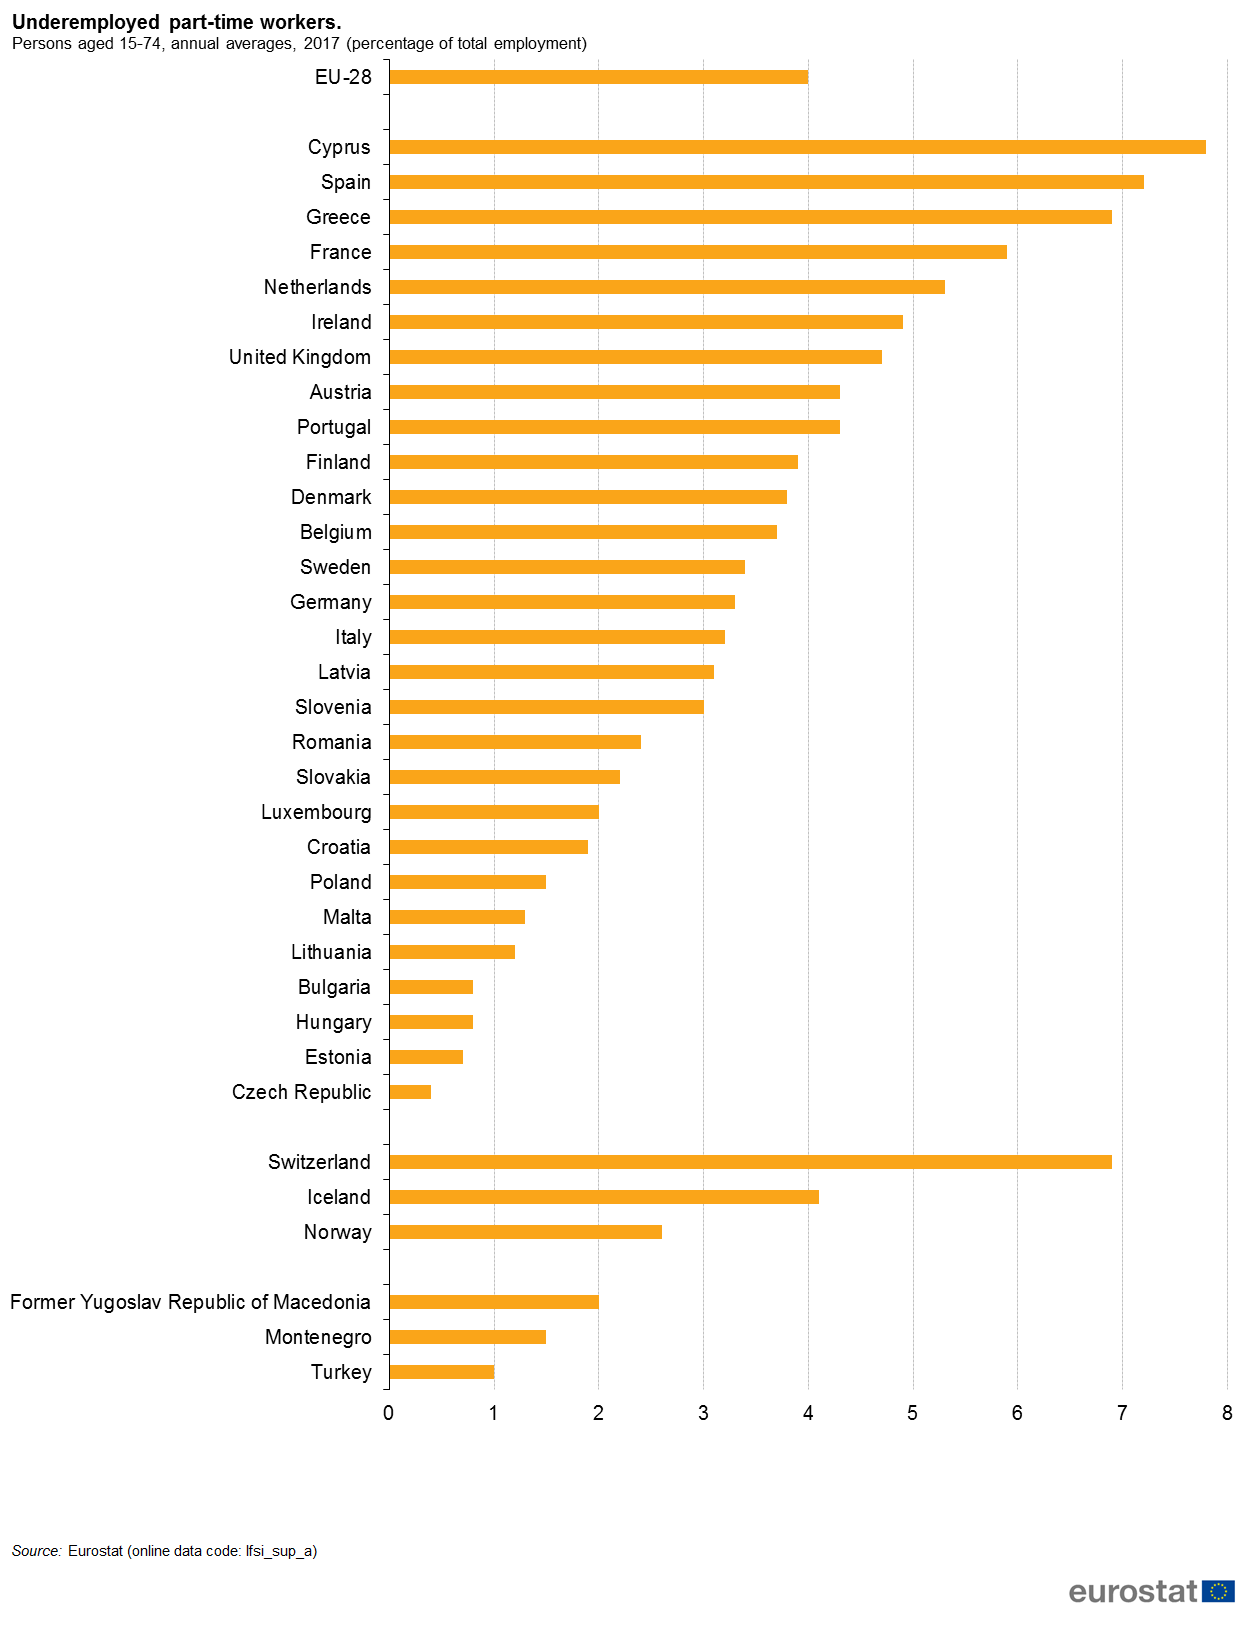
Underemployed part-time workers persons aged 15-74 all countries and EU-28 annual average 2017 (% of total employment).png
(
file
)
71 KB
1
16:05, 1 June 2018
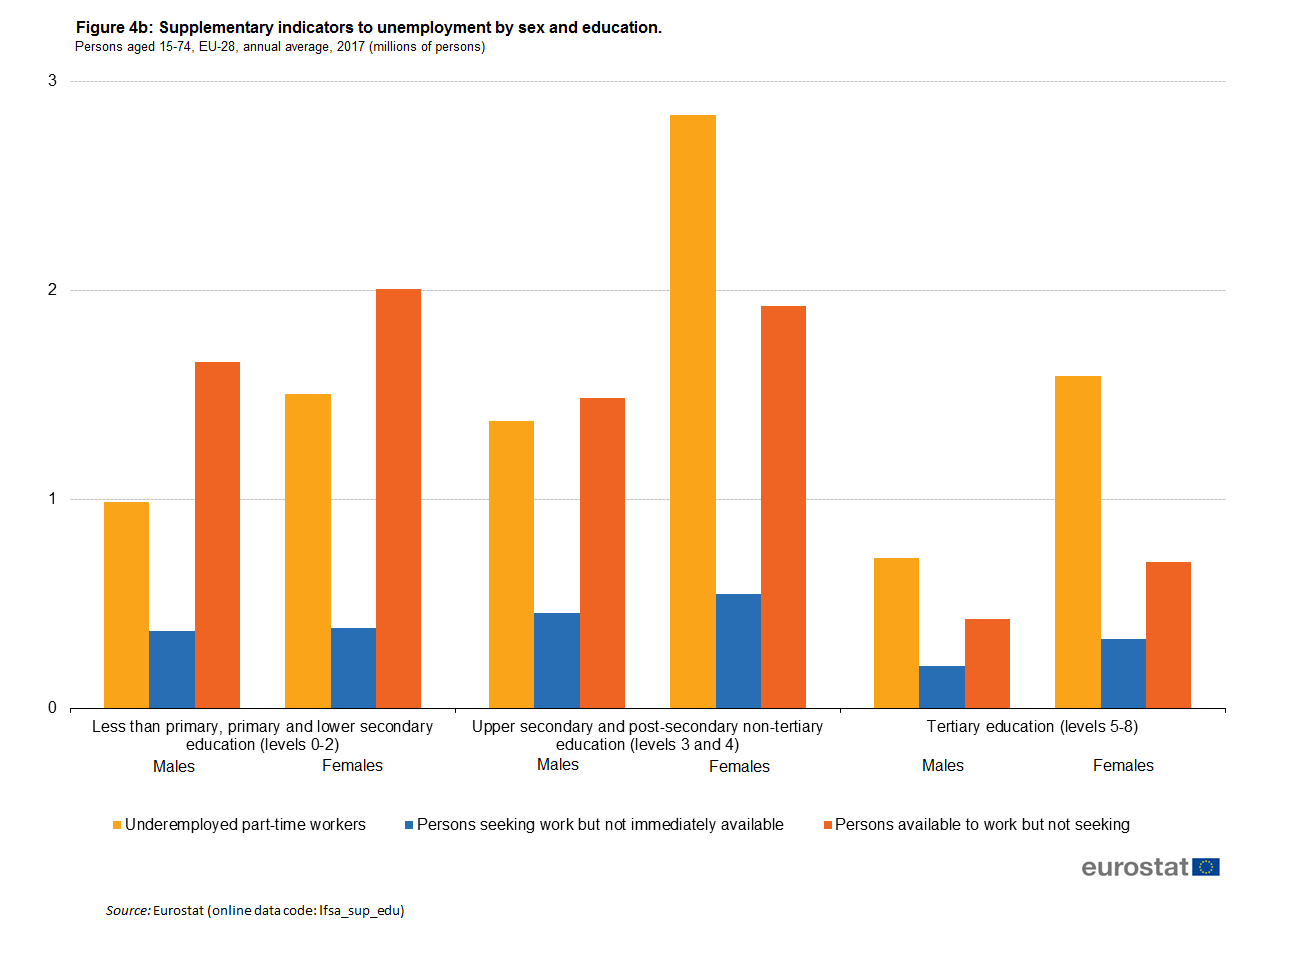
Supplementary indicators to unemployment by sex and educational attainment level, persons aged 15-74, EU-28, annual average, 2017 (million persons).png
(
file
)
48 KB
1
16:03, 1 June 2018
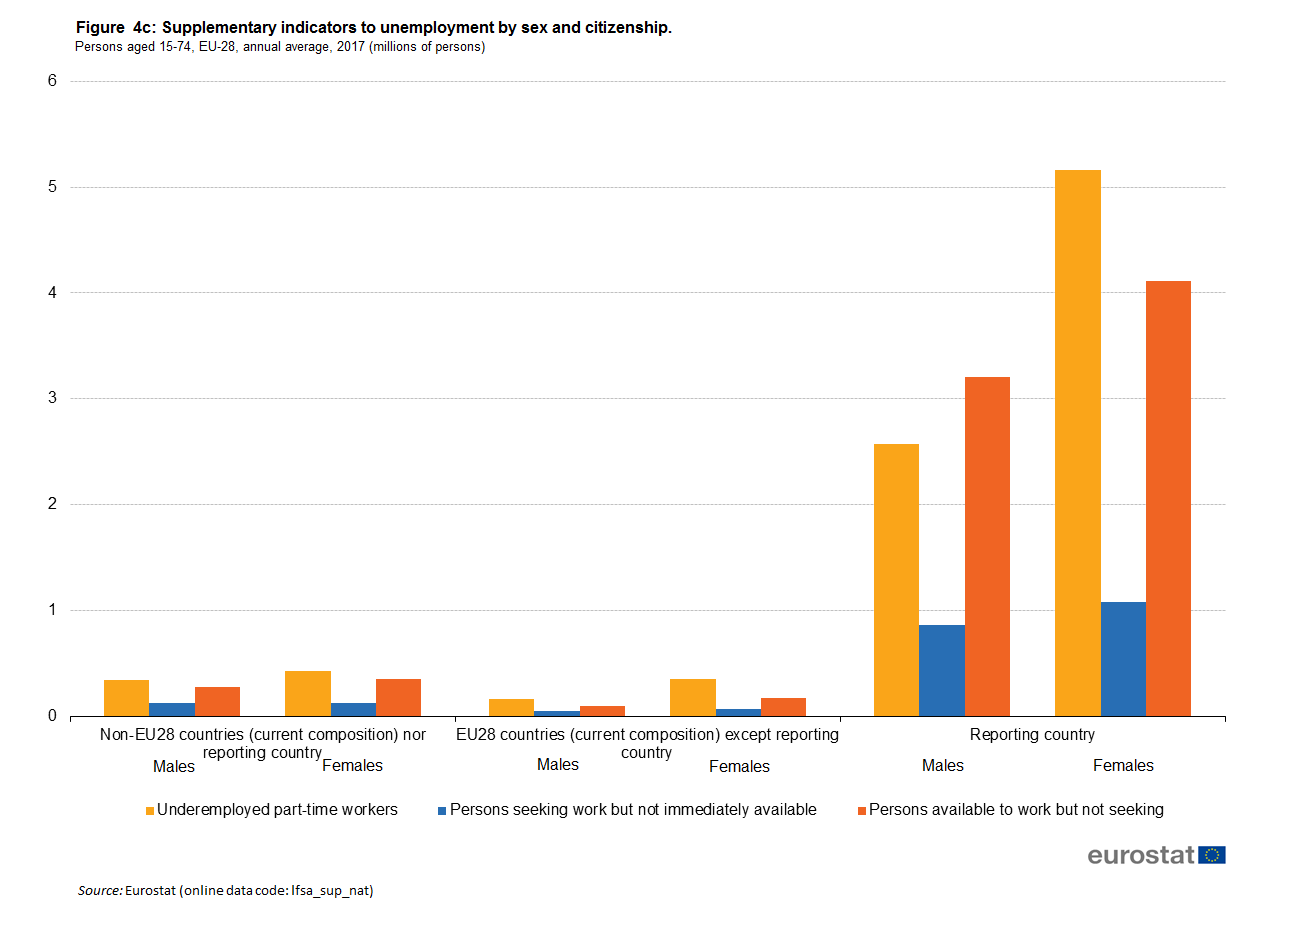
Supplementary indicators to unemployment by sex and citizenship, persons aged 15-74, EU-28, annual average, 2017 (million persons).png
(
file
)
28 KB
1
16:02, 1 June 2018
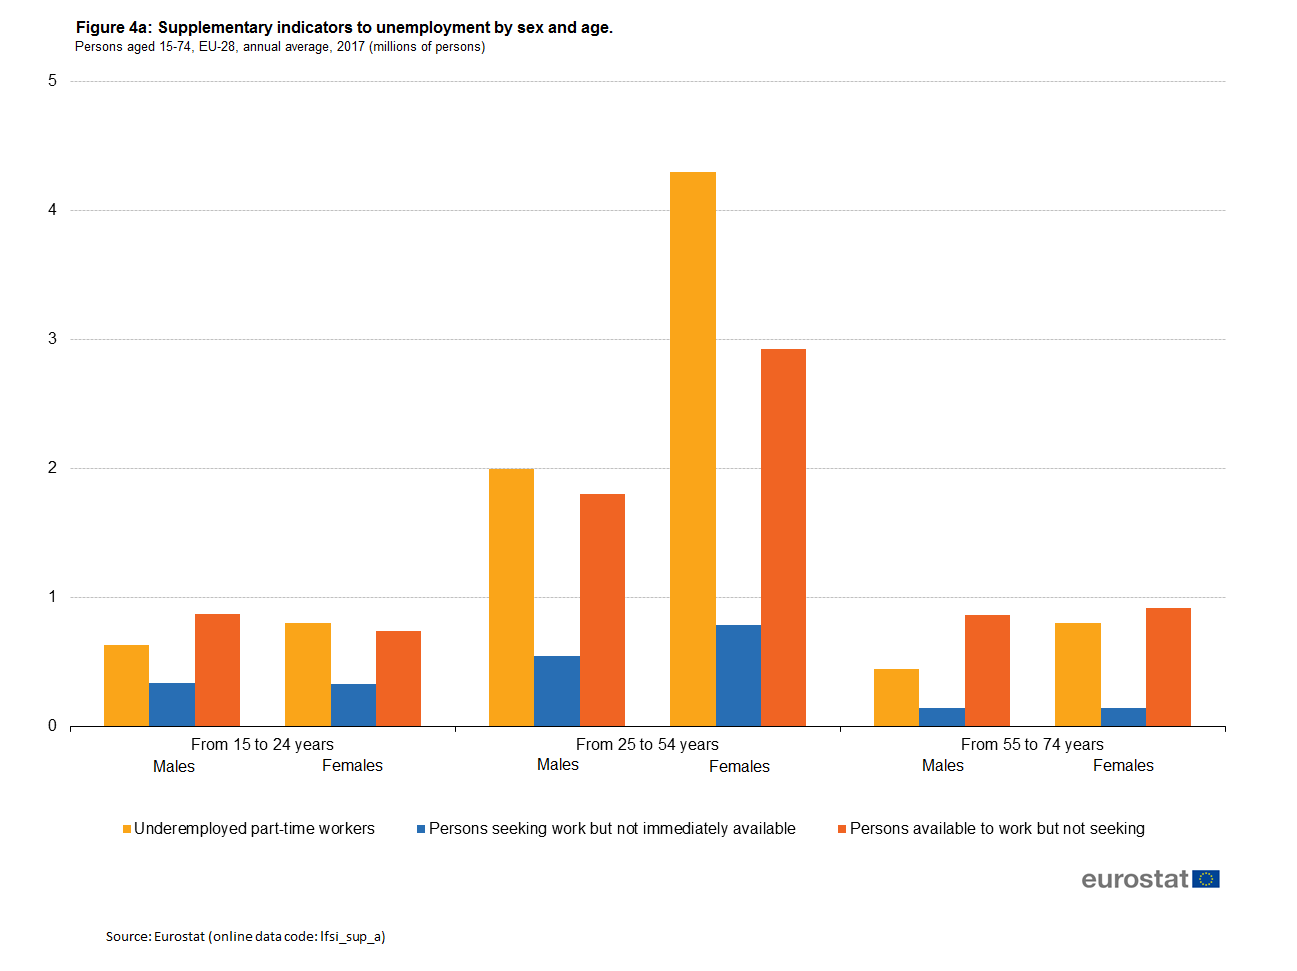
Supplementary indicators to unemployment by sex and age, persons aged 15-74, EU-28, annual average, 2017 (millions of persons).png
(
file
)
24 KB
1
16:00, 1 June 2018
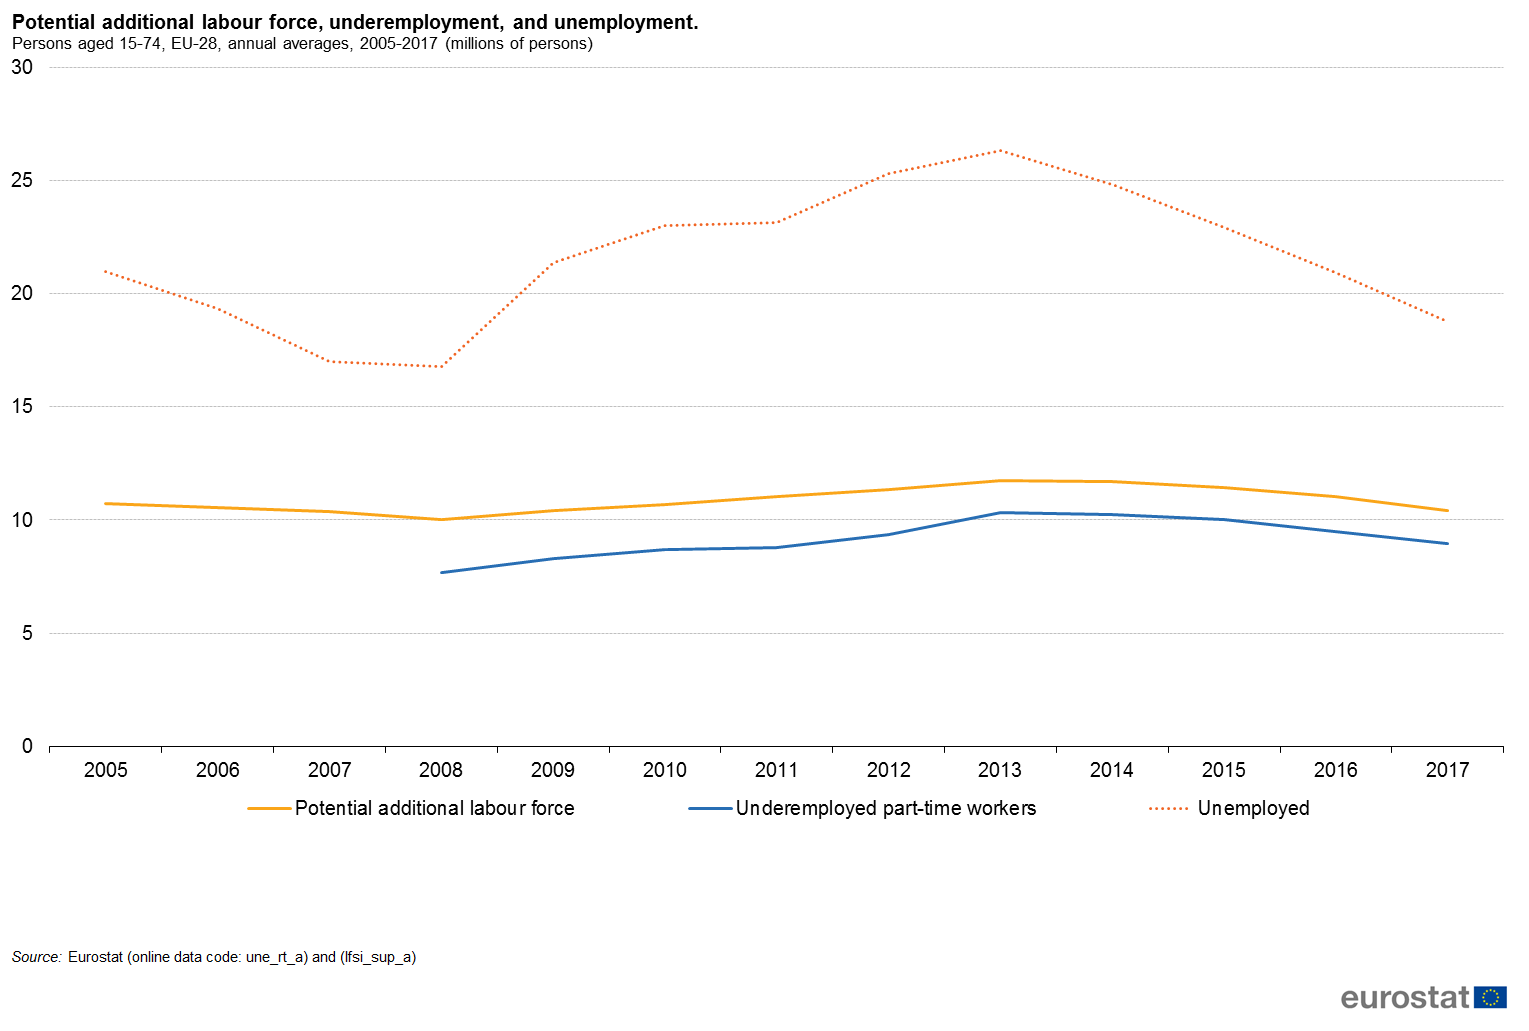
Potential additional labour force, underemployment and unemployment, persons aged 15-74, EU-28, annual averages, 2005 - 2017 (million persons).png
(
file
)
39 KB
1
15:58, 1 June 2018
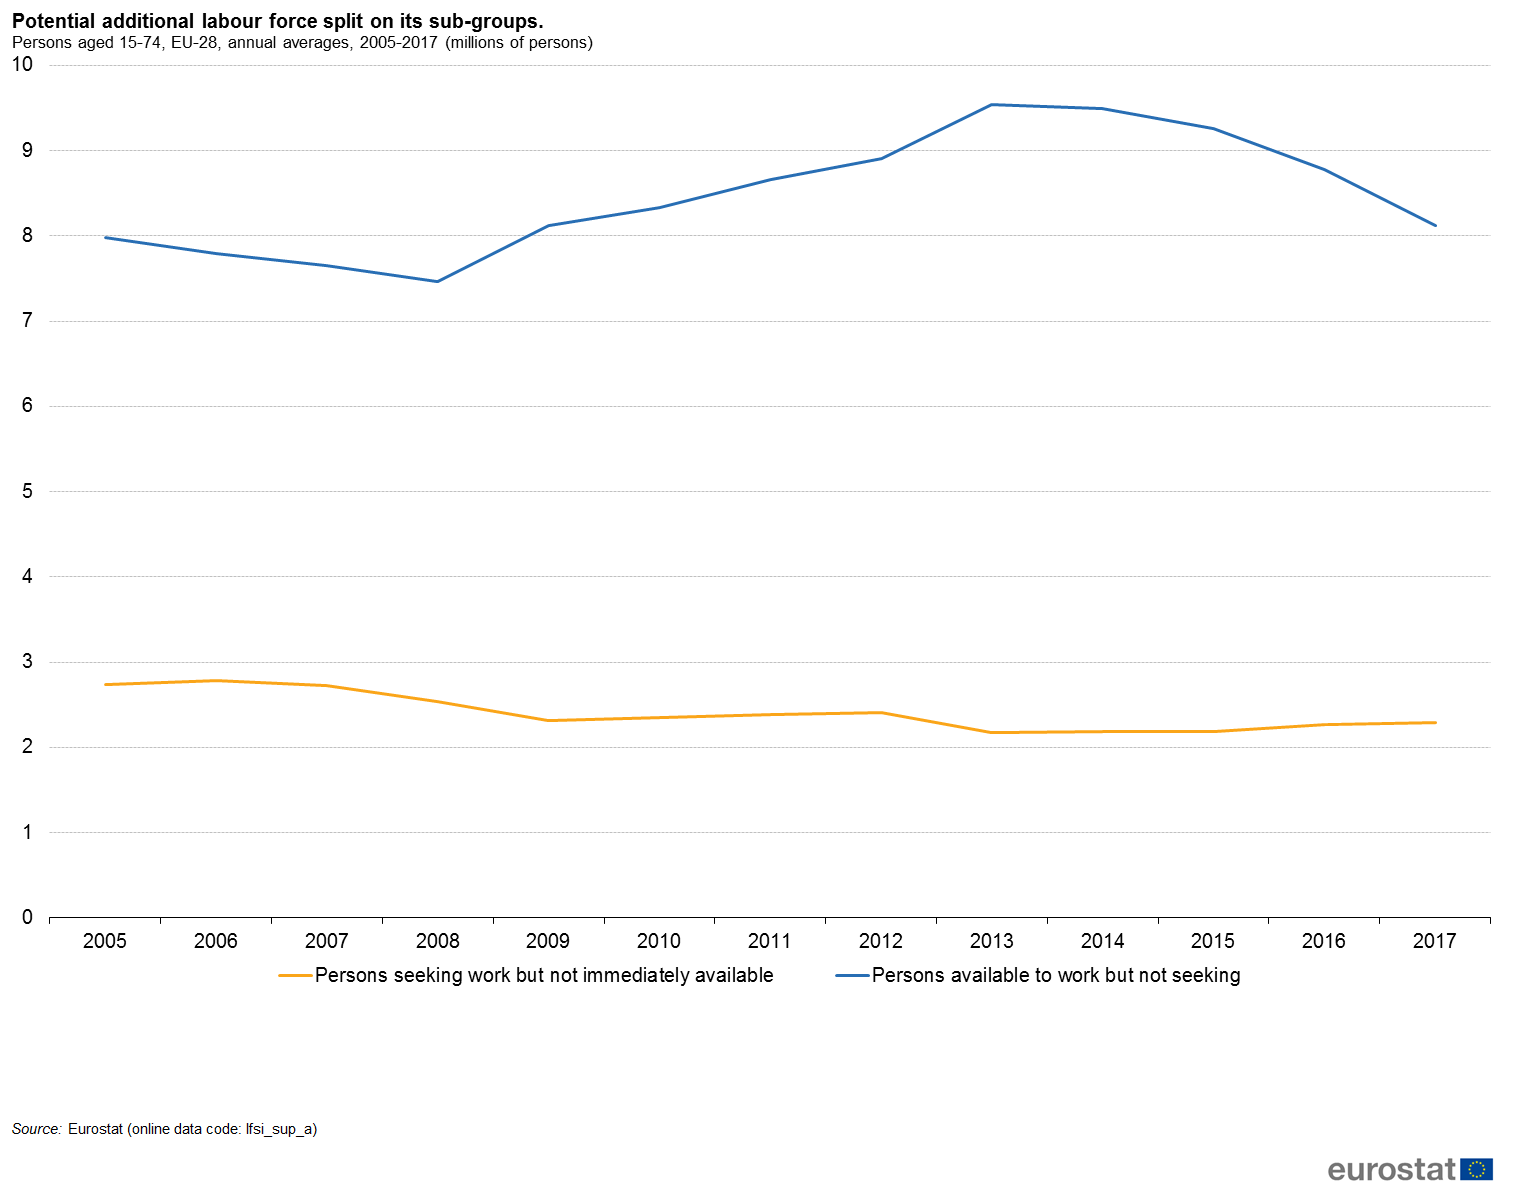
Potential additional labour force, split on its subgroups, persons aged 15-74, EU-28, annual averages, 2005 - 2017 (million persons).png
(
file
)
37 KB
1
15:56, 1 June 2018
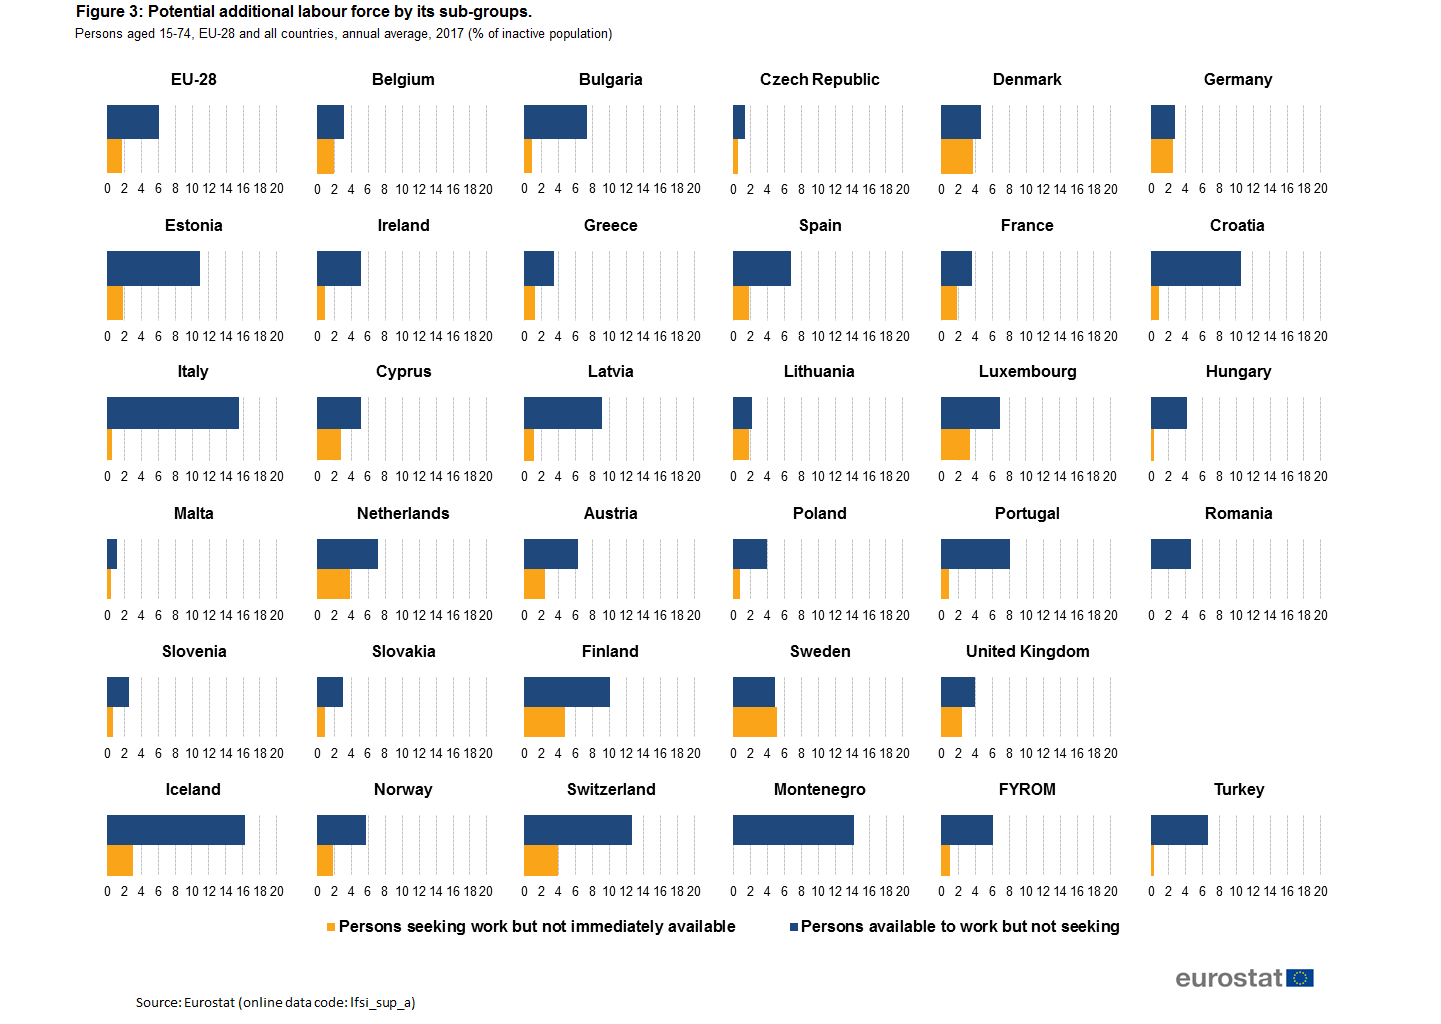
Potential additional labour force by its subgroups, persons aged 15-74, all countries and EU-28, annual average, 2017 (% of inactive population).png
(
file
)
70 KB
1
17:22, 18 April 2018
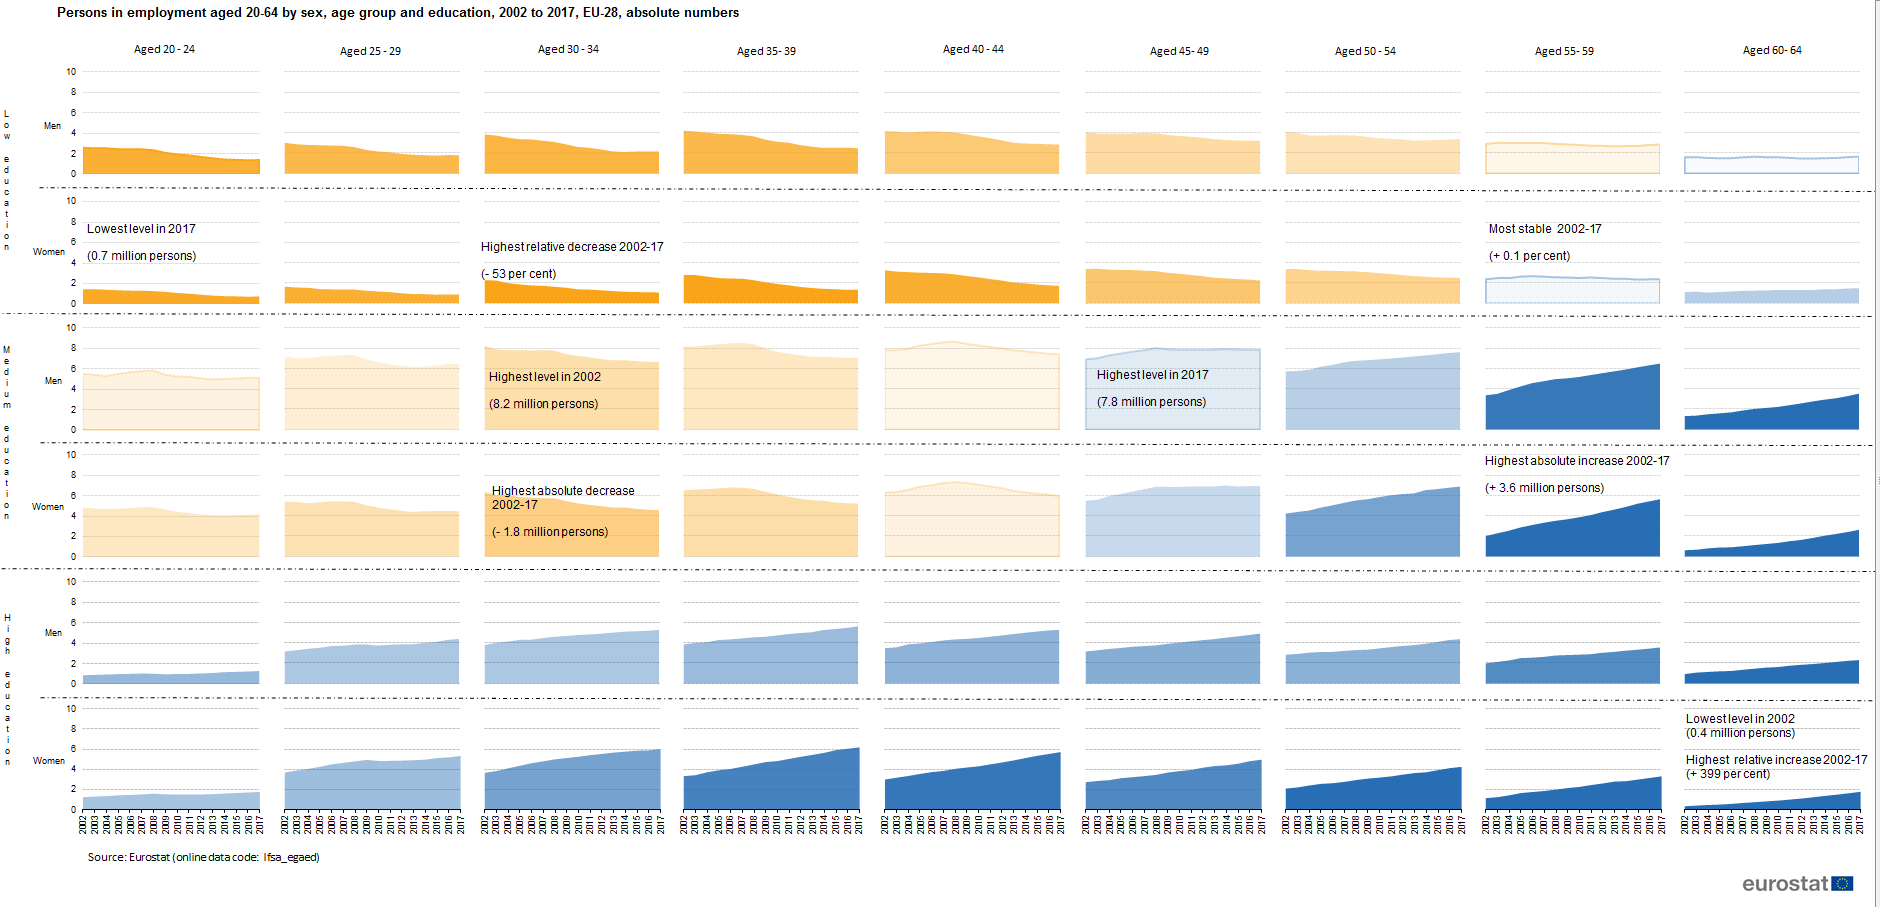
Persons in employment aged 20-64 by sex, age group and education, 2002 to 2017, EU-28, absolute numbers.png
(
file
)
72 KB
1
15:03, 18 April 2018
EU-LFS 2017 employment rates.xlsx
(
file
)
249 KB
1
17:56, 17 April 2018
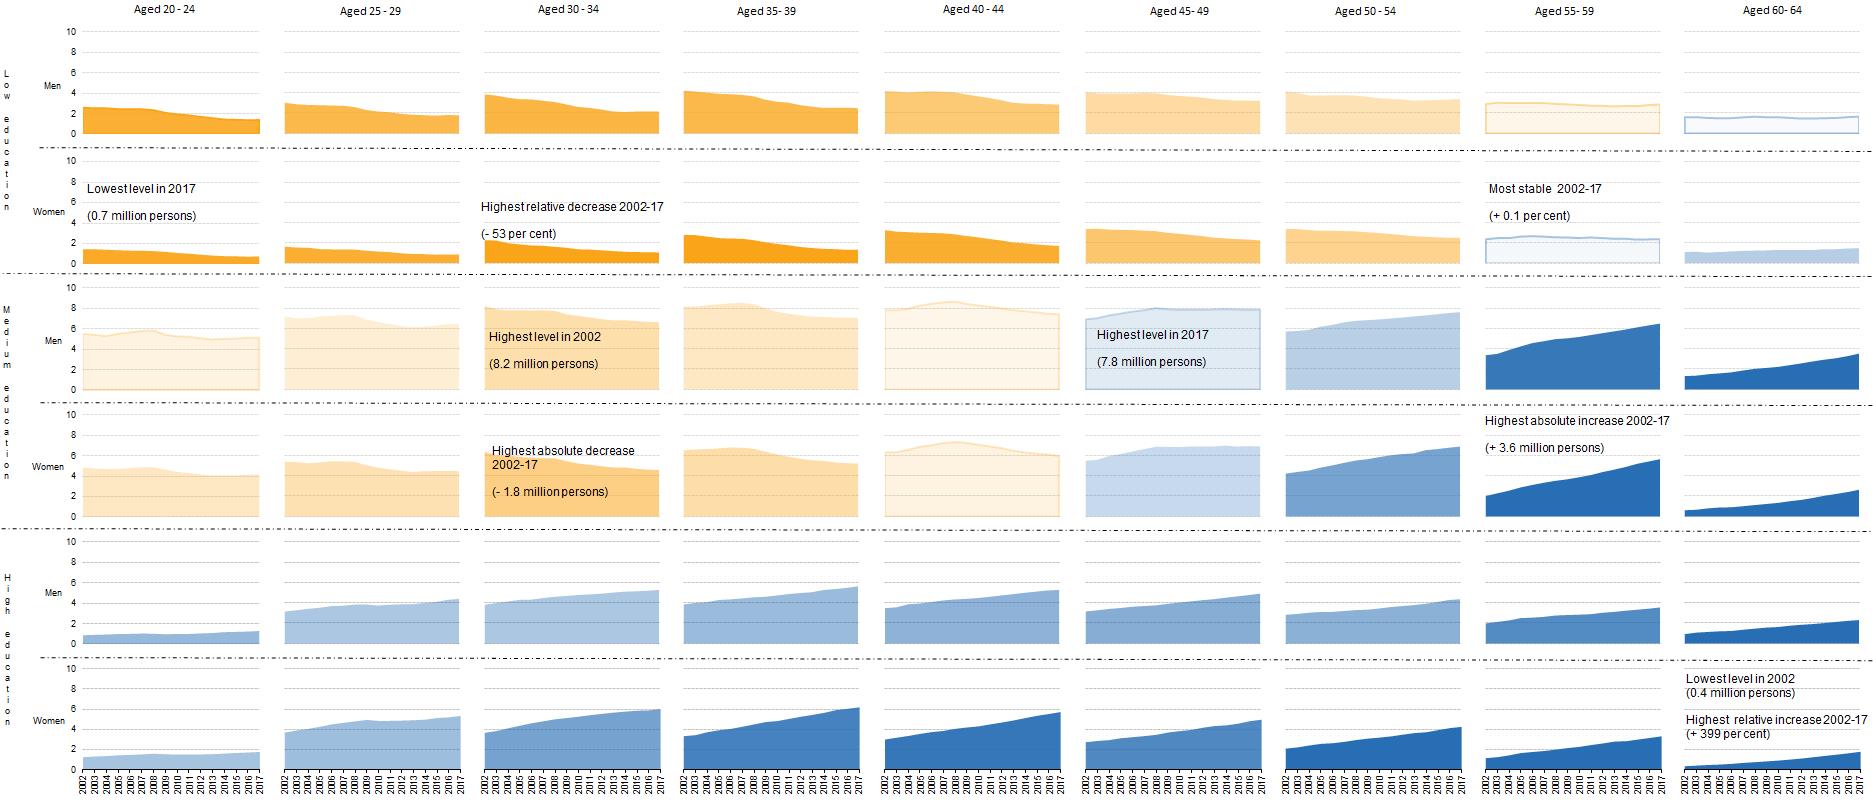
Persons in employment aged 20-64 by sex, age group and education, 2001 to 2017, EU-28, absolute numbers.png
(
file
)
71 KB
source correction
3
17:33, 17 April 2018
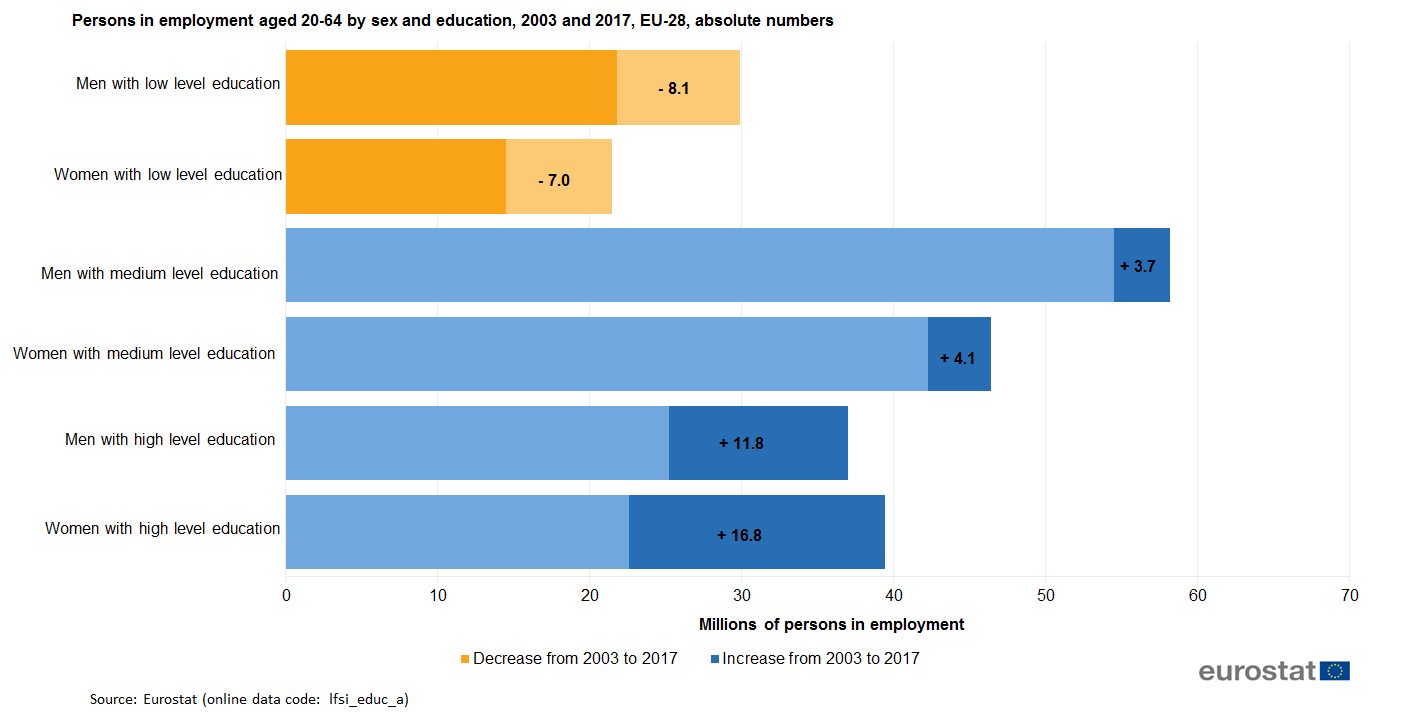
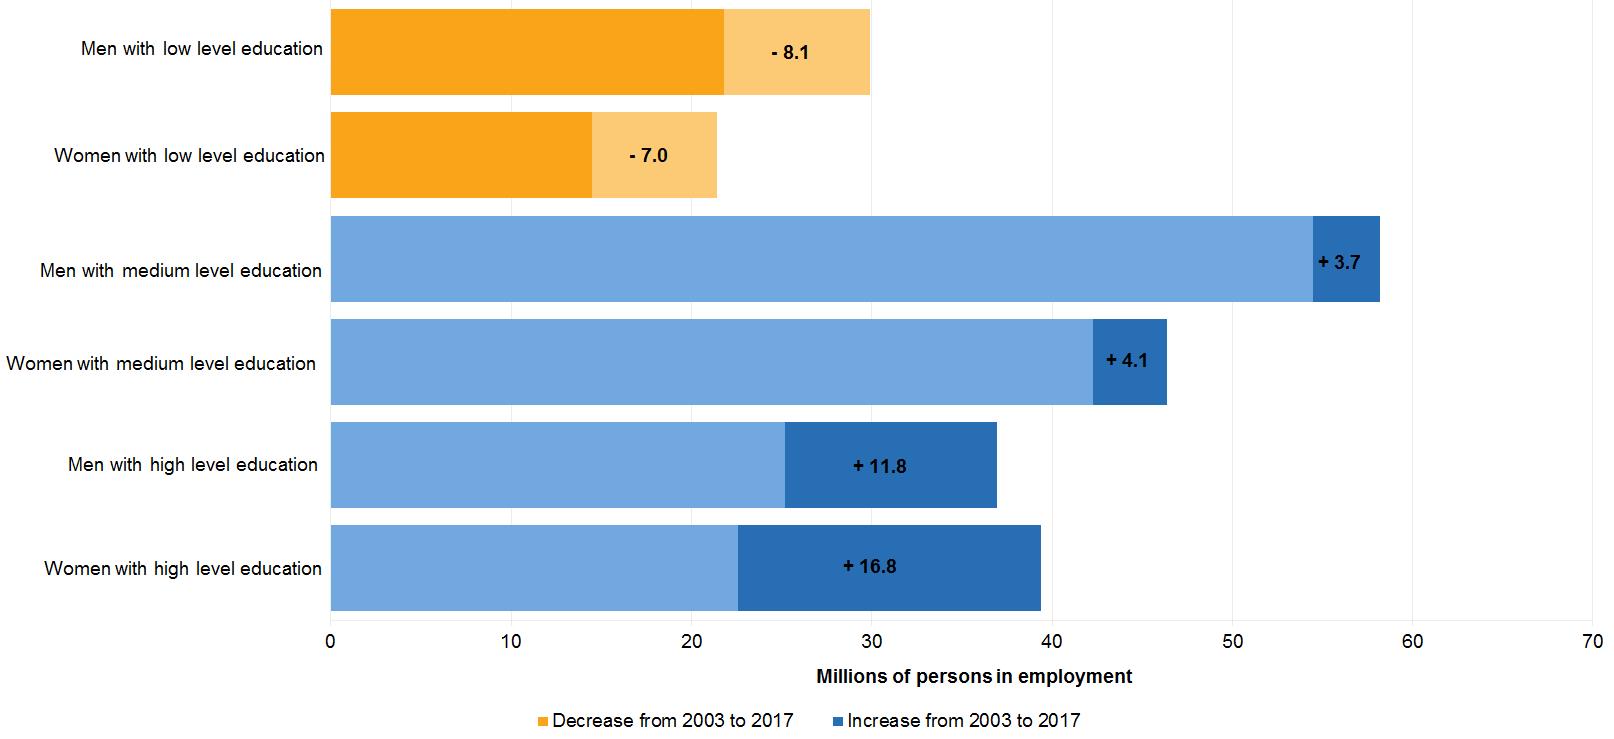
Persons in employment aged 20-64 by sex and education, 2003 and 2017, absolute numbers.png
(
file
)
36 KB
1
17:31, 17 April 2018
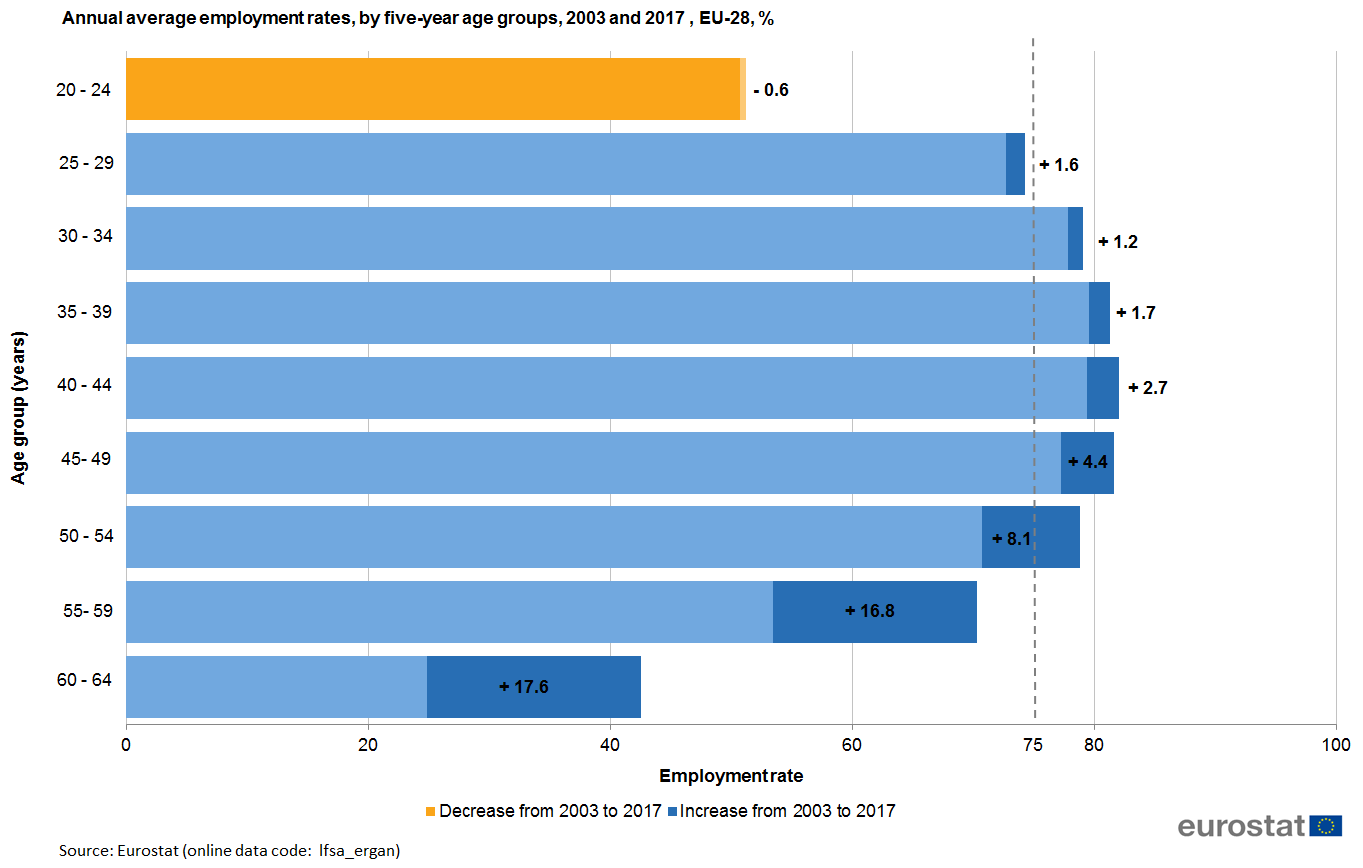
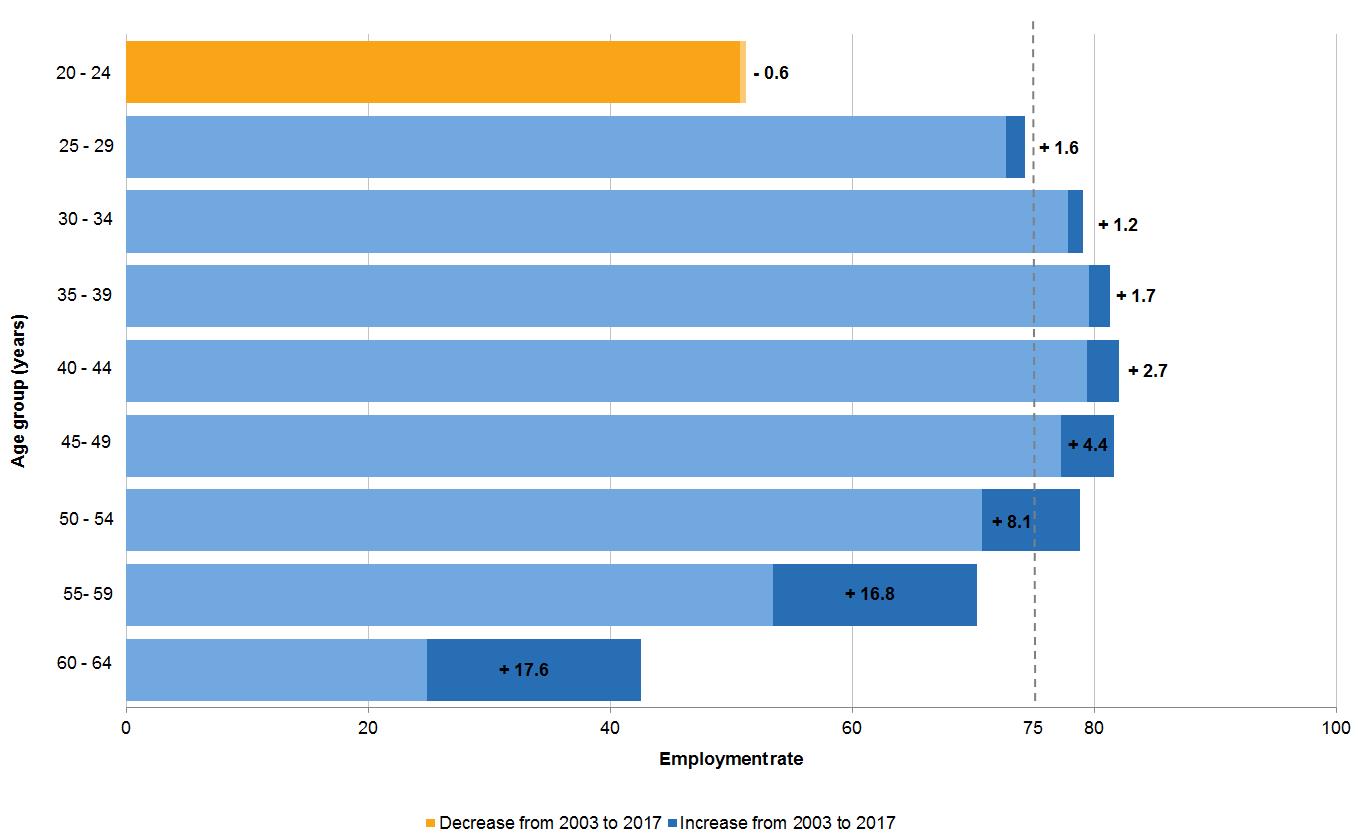
Annual average employment rates, by five-year age groups, 2003 and 2017, per cent.png
(
file
)
35 KB
1
17:28, 17 April 2018
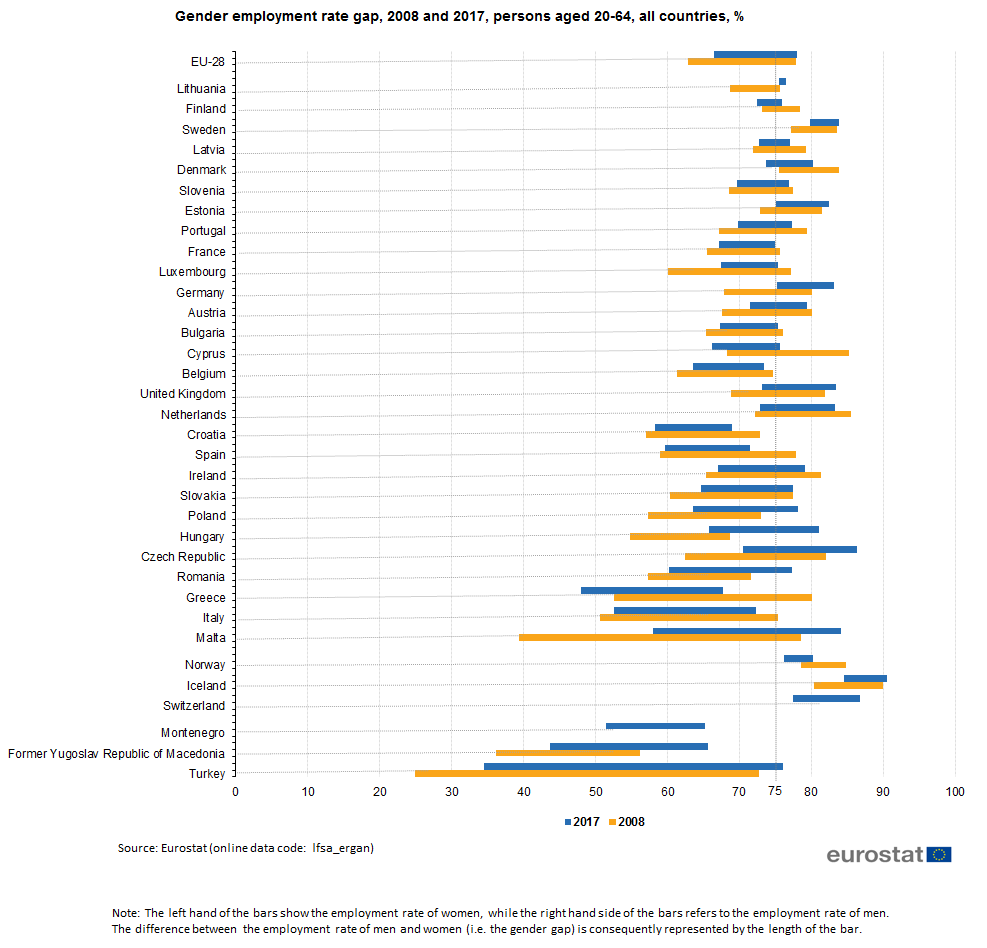
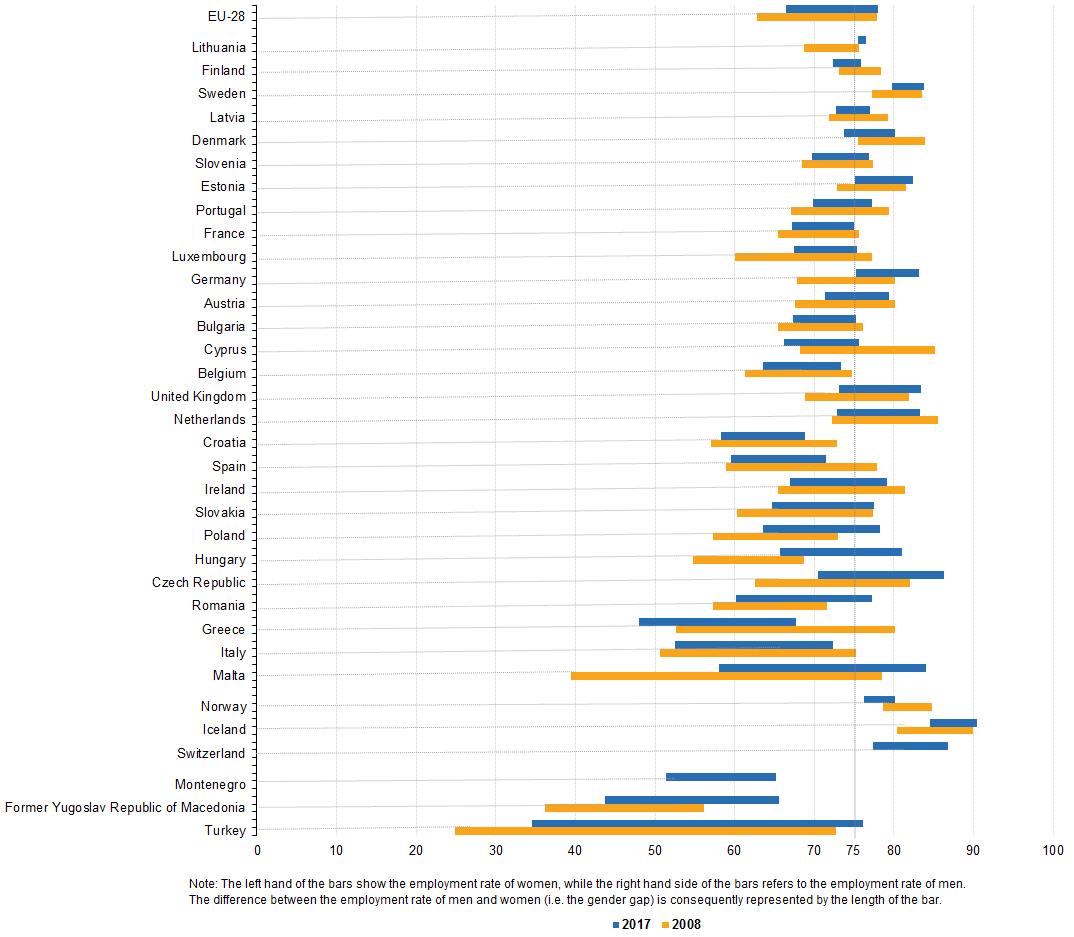
Gender employment rate gap, 2008 and 2017, persons aged 20-64, all countries %.png
(
file
)
53 KB
adding source
2
17:24, 17 April 2018
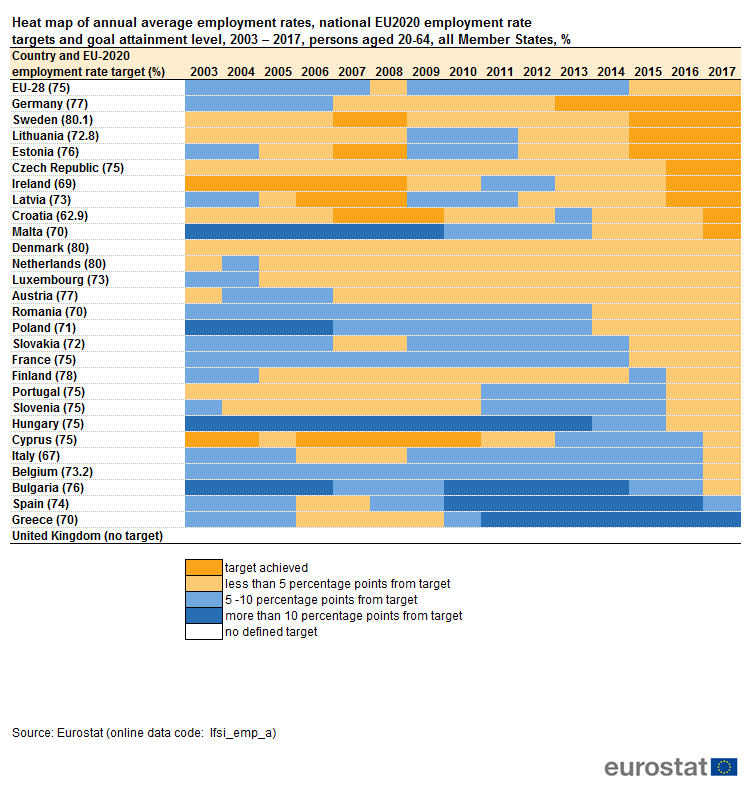
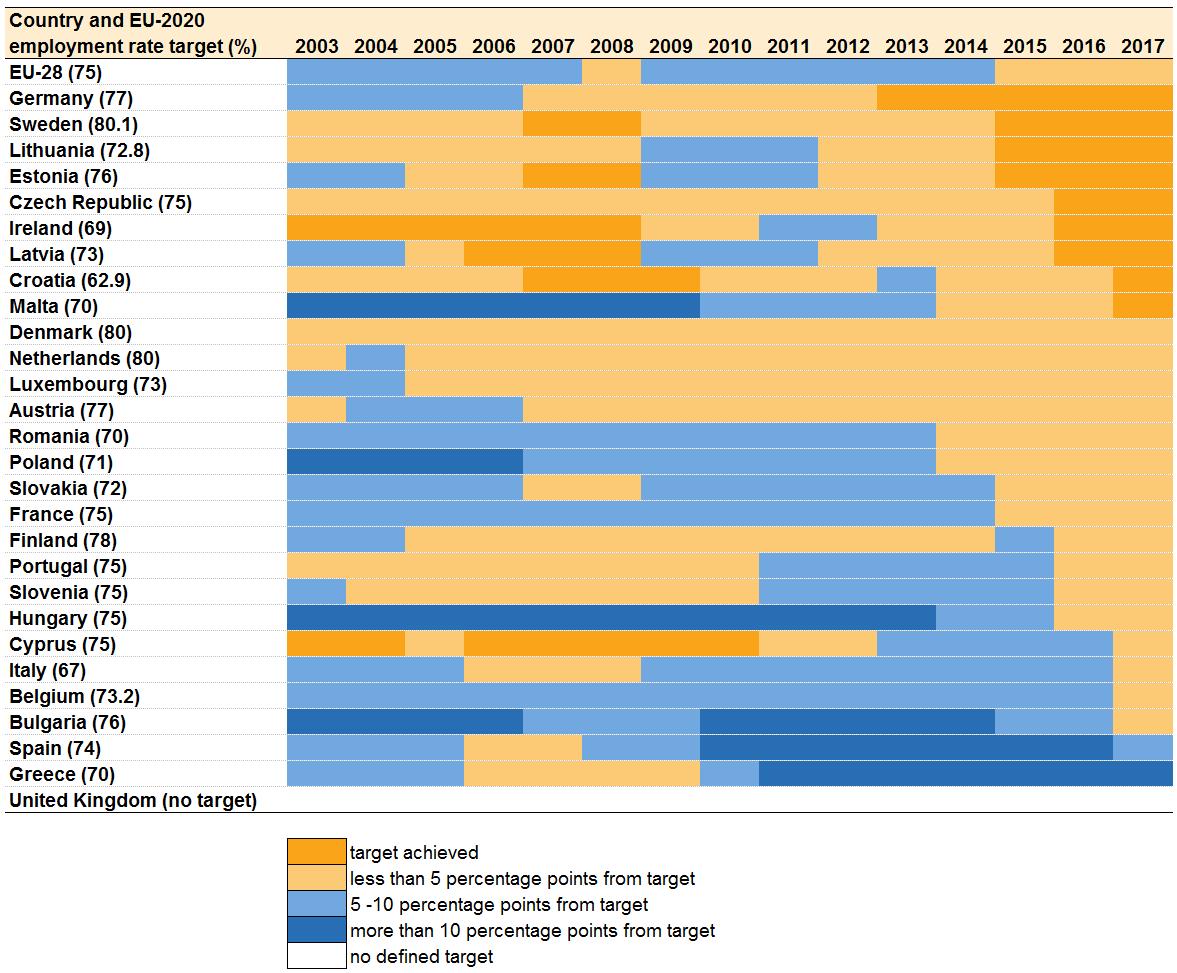
Heat map of annual average employment rates, national EU2020 employment rate targets and goal attainment level, 2003 – 2017.png
(
file
)
39 KB
1
17:21, 17 April 2018
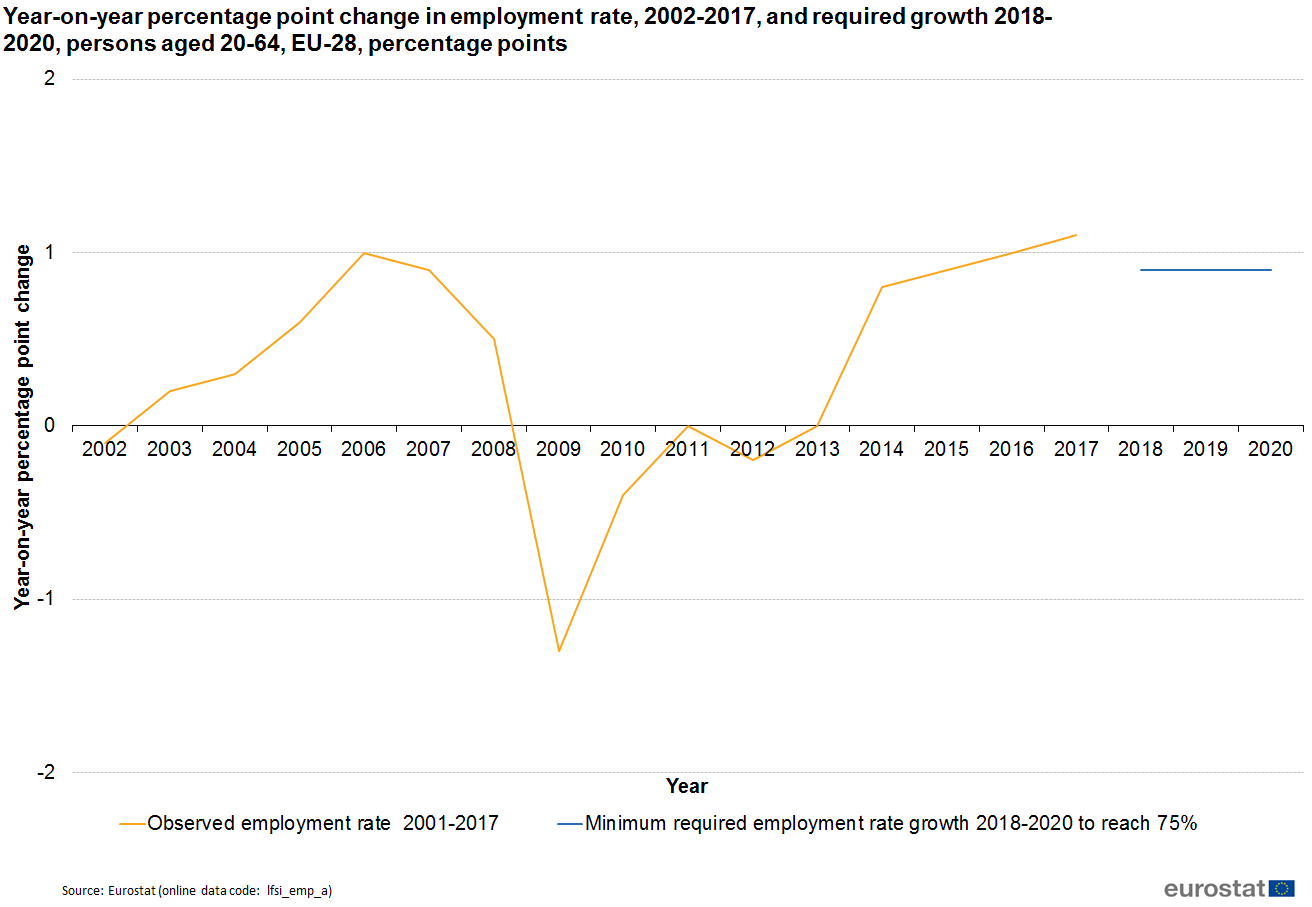
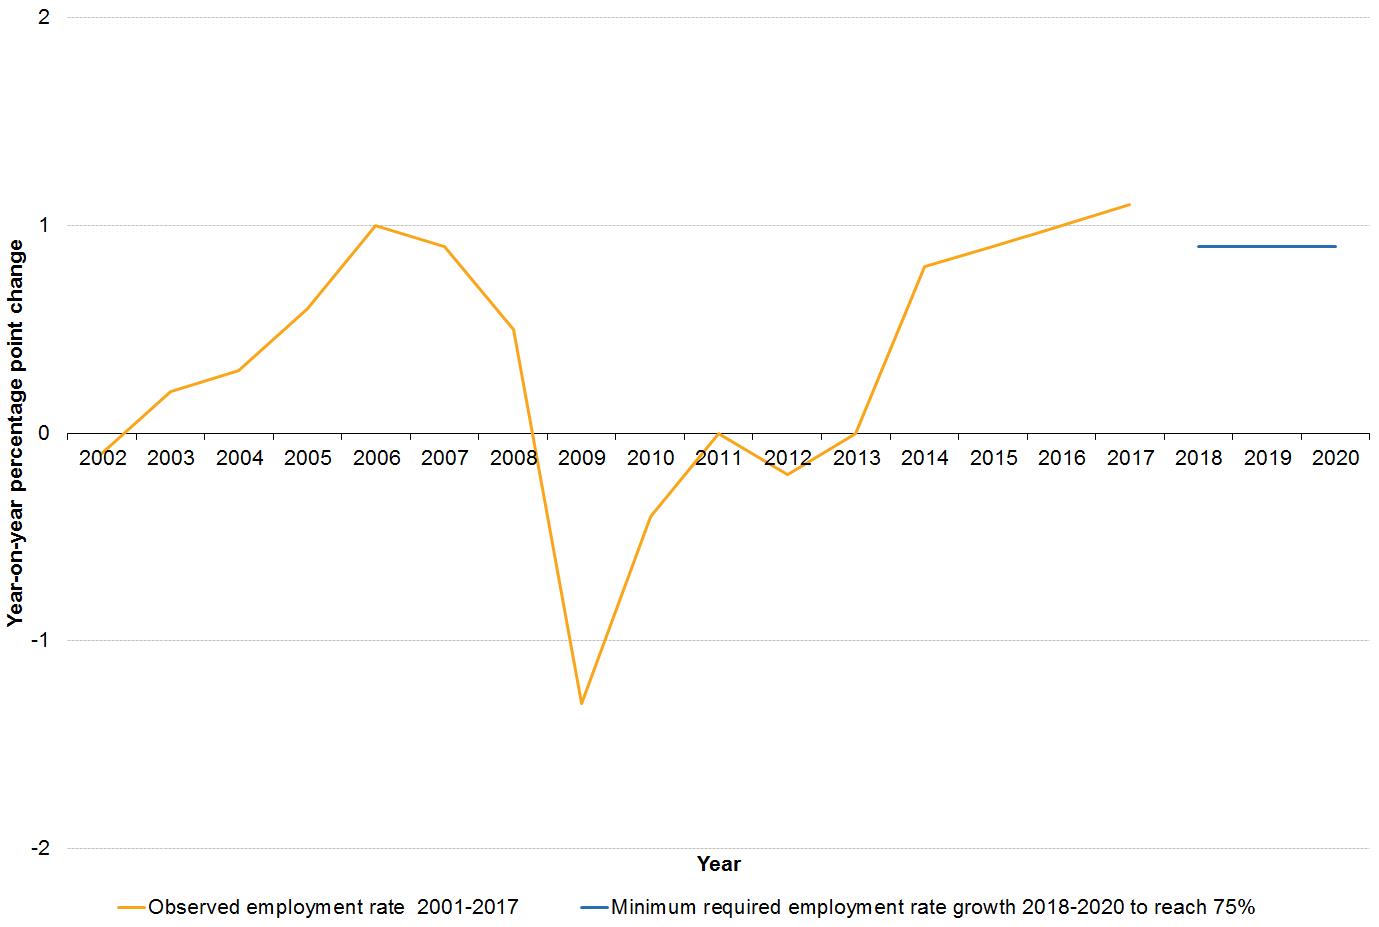
Year-on-year percentage point change in employment rate, 2002-2017, persons aged 20-64, EU-28, percentage points.png
(
file
)
38 KB
1
17:18, 17 April 2018
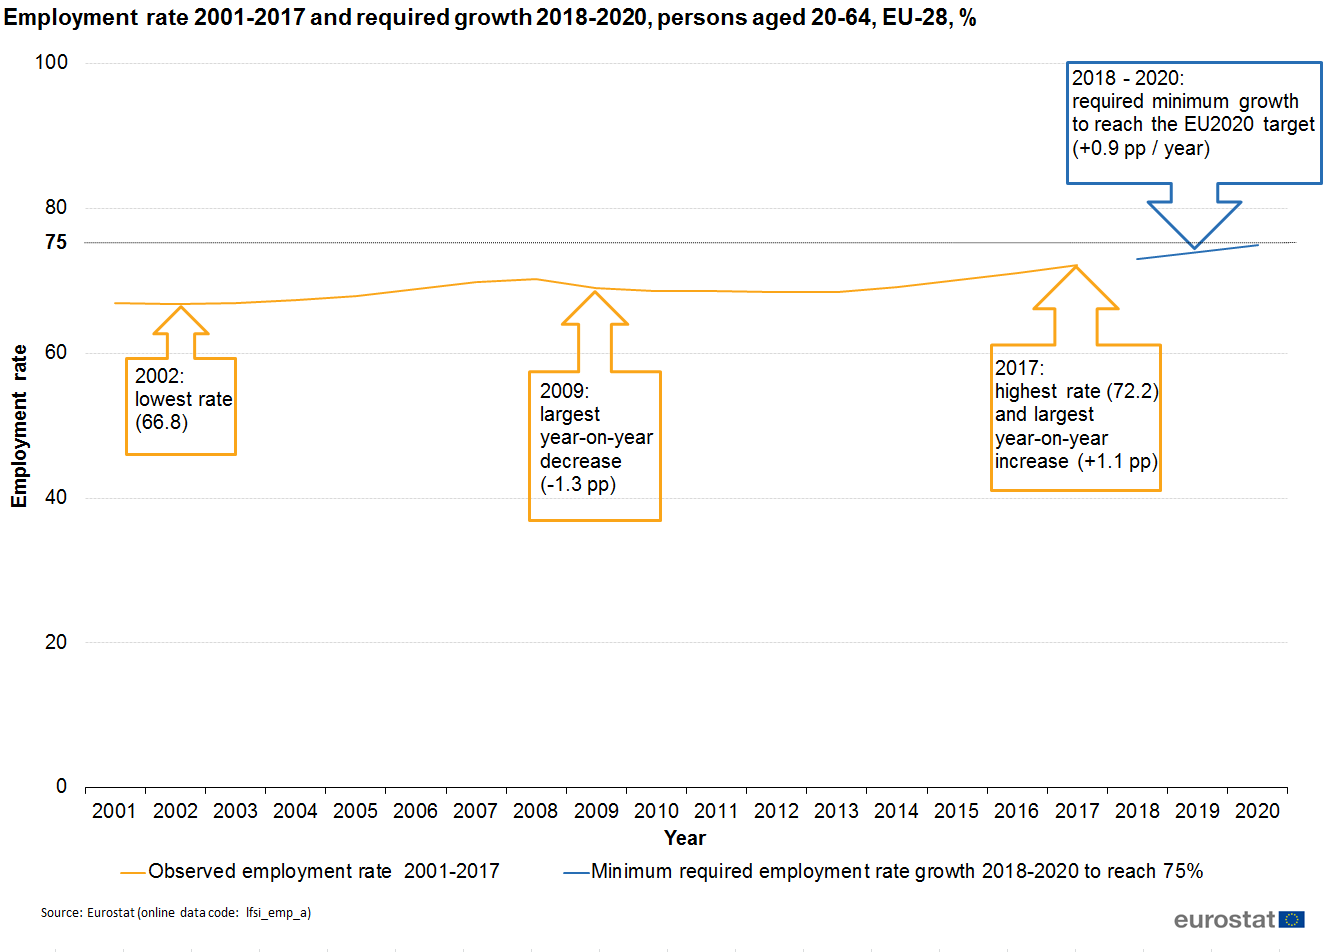
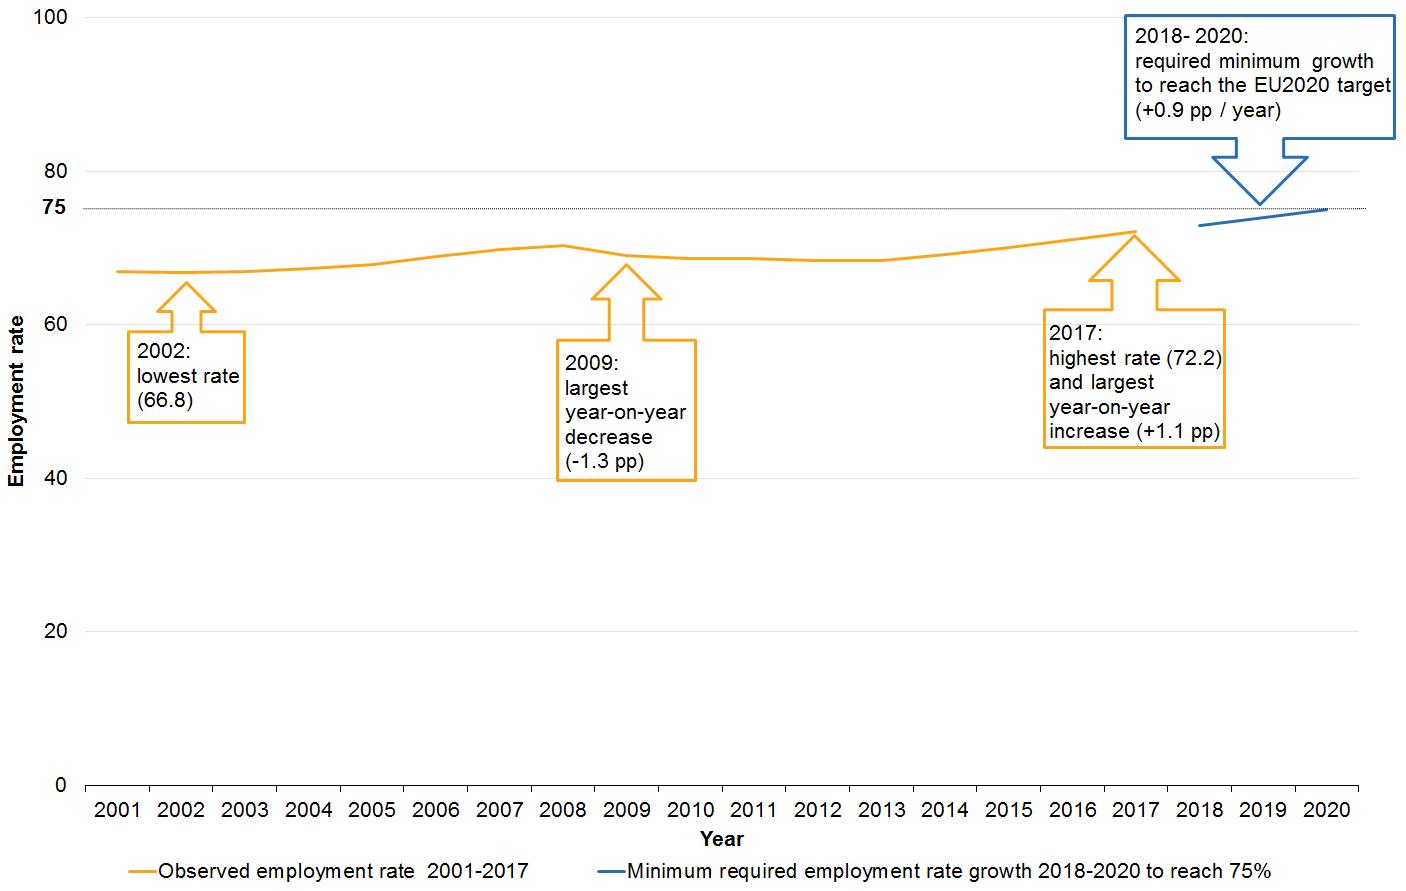
Employment rate 2001-2017 and required growth 2018-2020, persons aged 20-64, EU-28, per cent.png
(
file
)
41 KB
1
17:09, 10 April 2018
Figure 7 Persons in employment aged 20-64 by sex, age group and education, 2001 to 2017, absolute numbers.jpg
(
file
)
201 KB
1
17:08, 10 April 2018
Figure 6 Persons in employment aged 20-64 by sex and education, 2003 and 2017, absolute numbers.jpg
(
file
)
70 KB
1
17:07, 10 April 2018
Figure 5 Annual average employment rates, by five-year age groups, 2003 and 2017, per cent.jpg
(
file
)
76 KB
1
17:06, 10 April 2018
Figure 4 Gender employment rate gap, 2008 and 2017, persons aged 20-64, all countries, per cent.jpg
(
file
)
112 KB
1
17:05, 10 April 2018
Figure 3 Heat map of annual average employment rates, national EU2020 employment rate targets and goal attainment level, 2003 – 2017.jpg
(
file
)
172 KB
1
17:04, 10 April 2018
Figure 2 Year-on-year percentage point change in employment rate, 2002-2017, persons aged 20-64, EU-28, percentage points.jpg
(
file
)
68 KB
1
17:02, 10 April 2018
Figure 1 Employment rate 2001-2017 and required growth 2018-2020, persons aged 20-64, EU-28, per cent.jpg
(
file
)
96 KB
1
17:37, 21 March 2018
Incidence of job mismatch by country, 2016 (% of people aged 15-34 reporting that their current main job does not correspond at all to their level of education) .png
(
file
)
76 KB
corrected spelling mistake
3
17:36, 21 March 2018
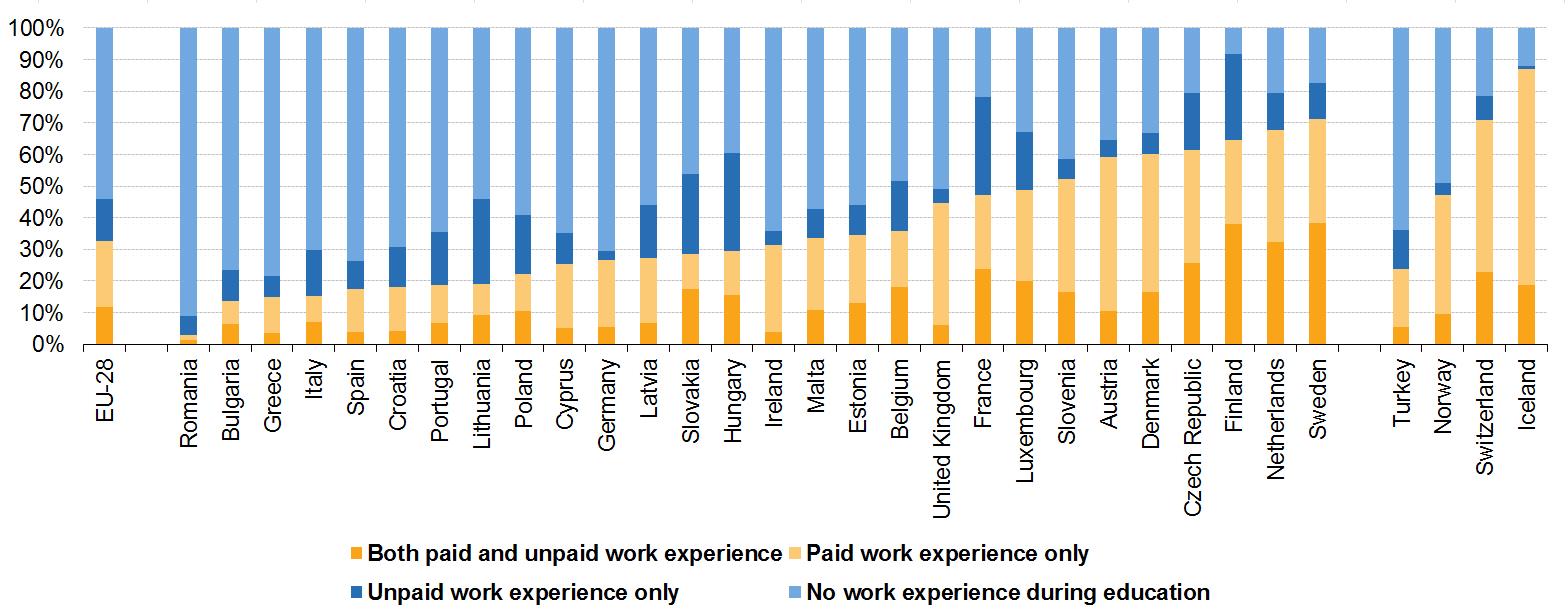
Distribution of people aged 15-34 by work experience during studies, 2016 (% of people aged 15-34 who had any form of completed formal education) .png
(
file
)
133 KB
corrected spelling mistake
3
17:35, 21 March 2018
Proportion of people aged 15-34 with some form of education who did not work during their studies in 2009 and 2016 .png
(
file
)
115 KB
corrected spelling mistake
6
11:25, 15 March 2018
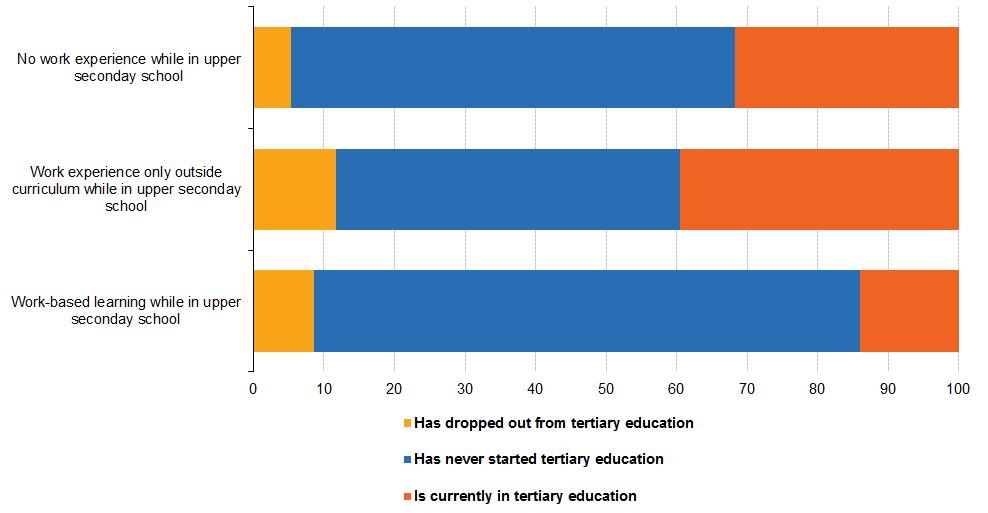
Tertiary education decisions by work experience while in secondary education.jpg
(
file
)
41 KB
1
15:16, 14 March 2018
Labour force survey ad hoc module 2016 precarious work.jpg
(
file
)
69 KB
layout change
2
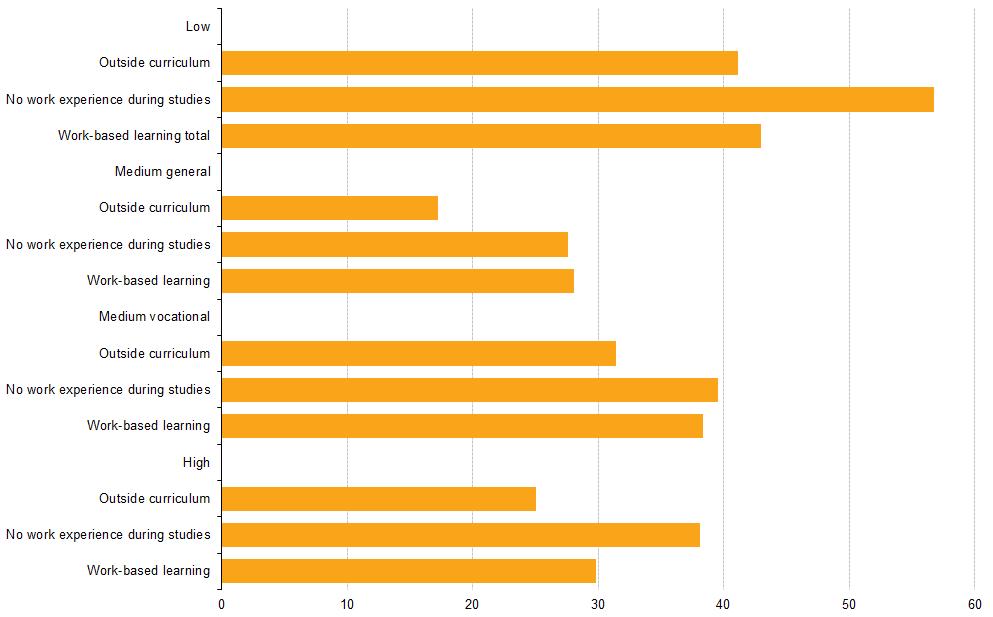
15:14, 14 March 2018
Employed persons working on weekends by education level and work while studying, persons aged 20-34, EU-28, 2016.jpg
(
file
)
78 KB
1
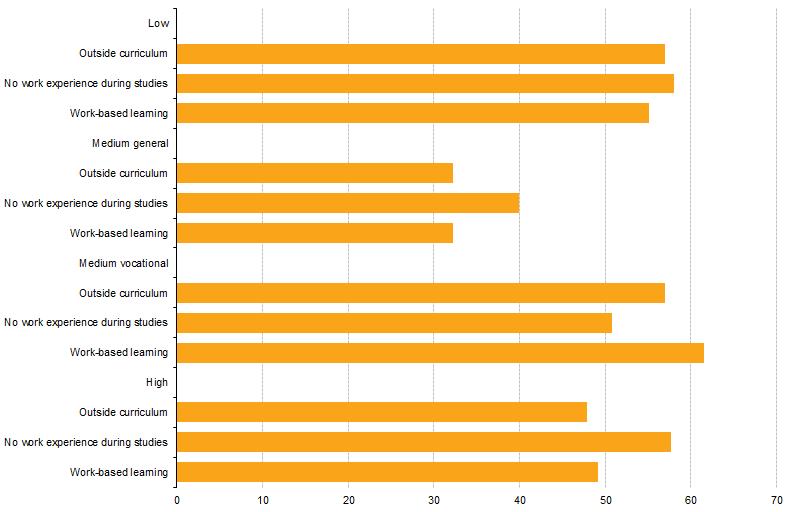
15:12, 14 March 2018
Employed persons with job tenure less than one year by education level and work while studying, persons aged 20-34, EU-28, 2016.jpg
(
file
)
80 KB
1
19:03, 13 March 2018
Willingness to move to find a job by education level and employment status, EU-28, 2016 ( % of concerned employment status and education level).png
(
file
)
27 KB
label correction (verb tense)
3
10:26, 13 February 2018
Labour force survey ad hoc module 2016 involuntary temporary contracts.jpg
(
file
)
46 KB
1
19:32, 12 February 2018
Labour force survey ad hoc module 2016 involuntary part-time workers.jpg
(
file
)
57 KB
1
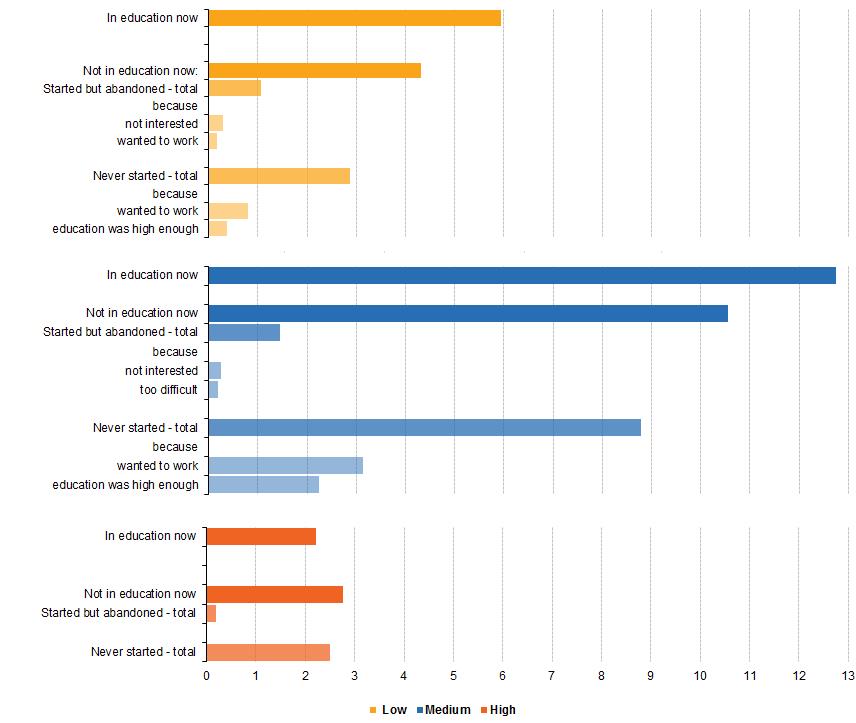
19:19, 9 February 2018
Labour force survey ad hoc module 2016 achieved education levels and main reasons for not continuing or completing.jpg
(
file
)
59 KB
1
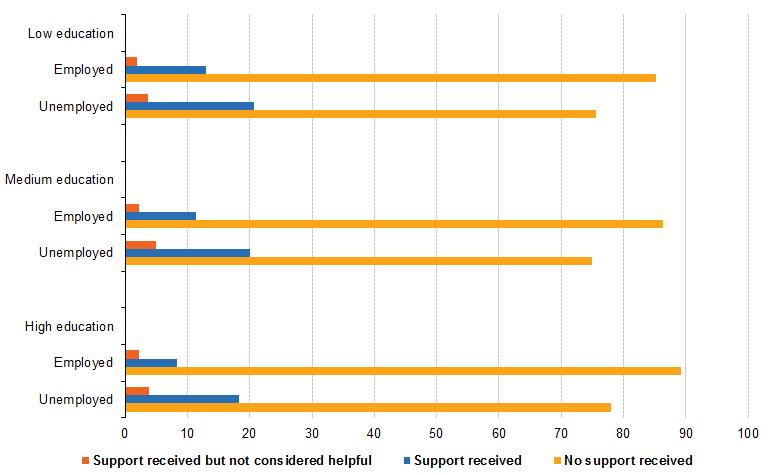
16:03, 9 February 2018
Labour force survey ad hoc module 2016 support for finding a job.jpg
(
file
)
42 KB
1
15:08, 9 February 2018
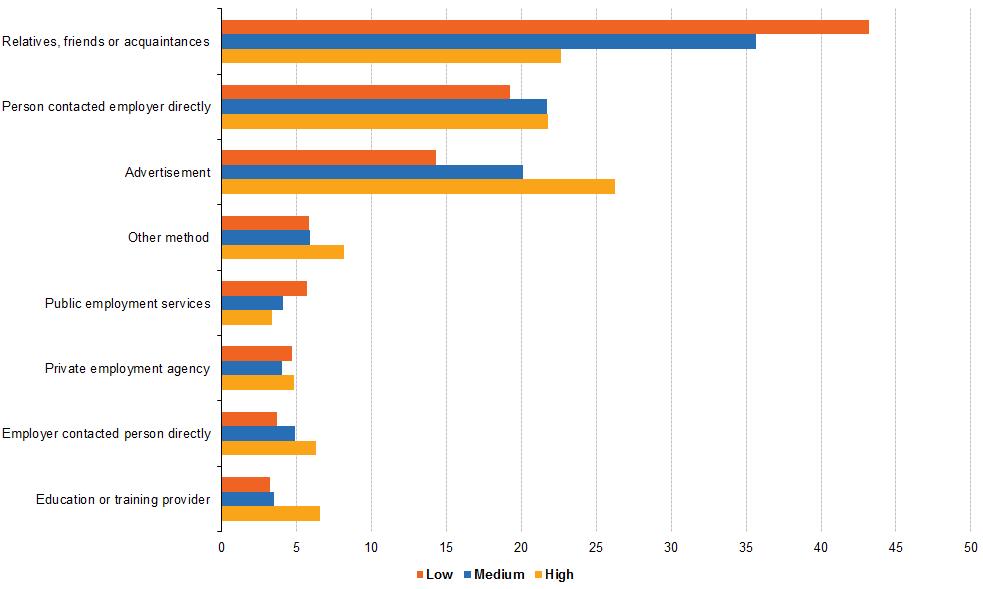
Labour force survey ad hoc module 2016 methods used to find the current job.jpg
(
file
)
49 KB
1
18:10, 24 January 2018
Precarious employment 2016.jpg
(
file
)
105 KB
fixed sorting
4
16:30, 24 January 2018
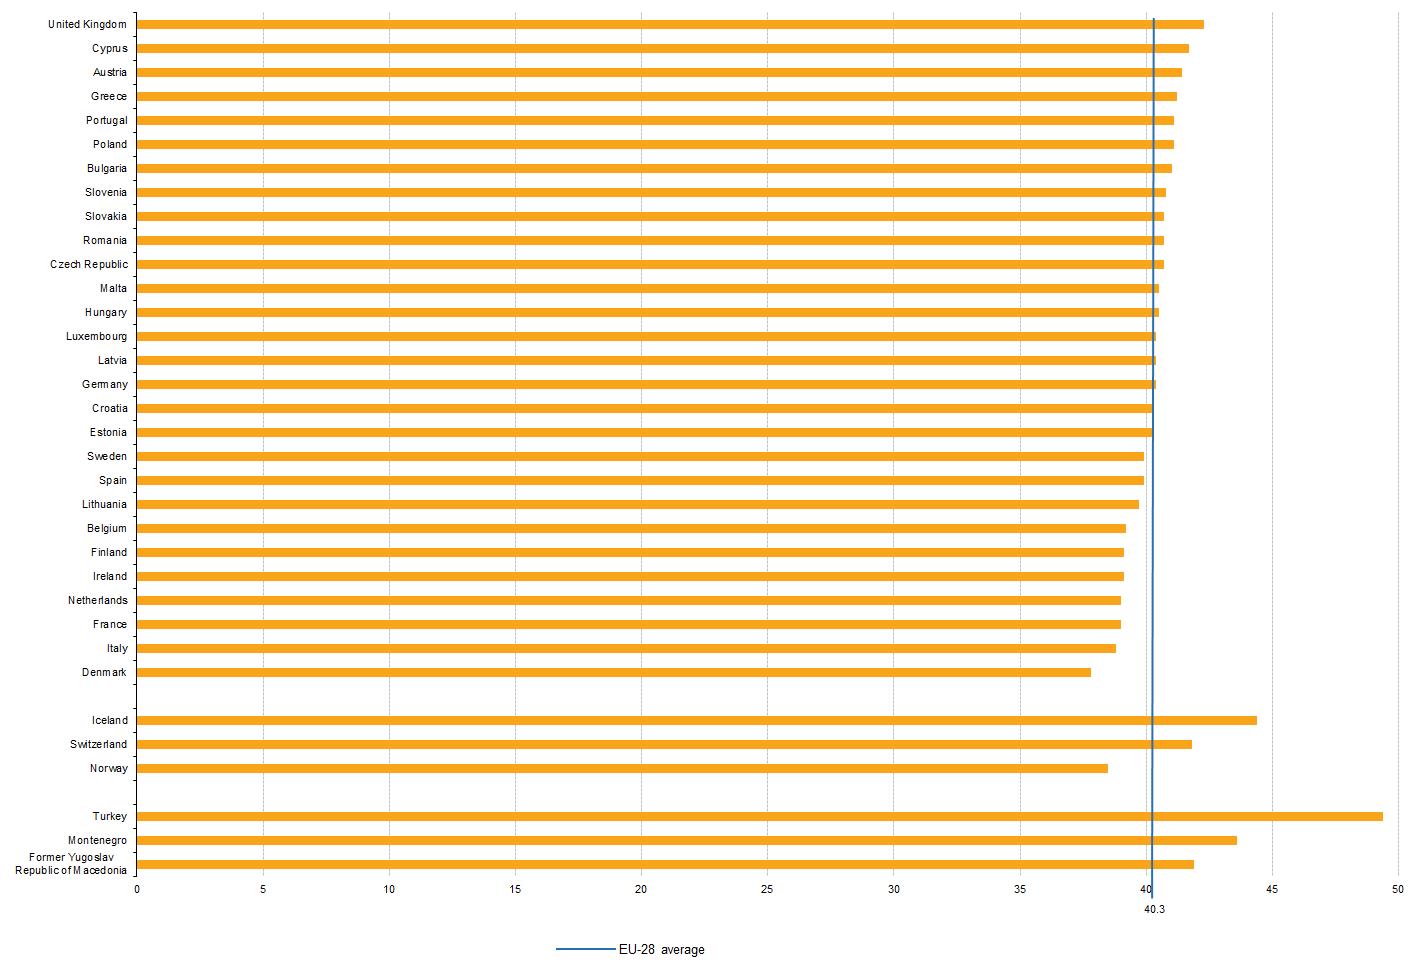
Usual weekly hours in the main job full-time employees 2016.jpg
(
file
)
205 KB
1
16:26, 24 January 2018
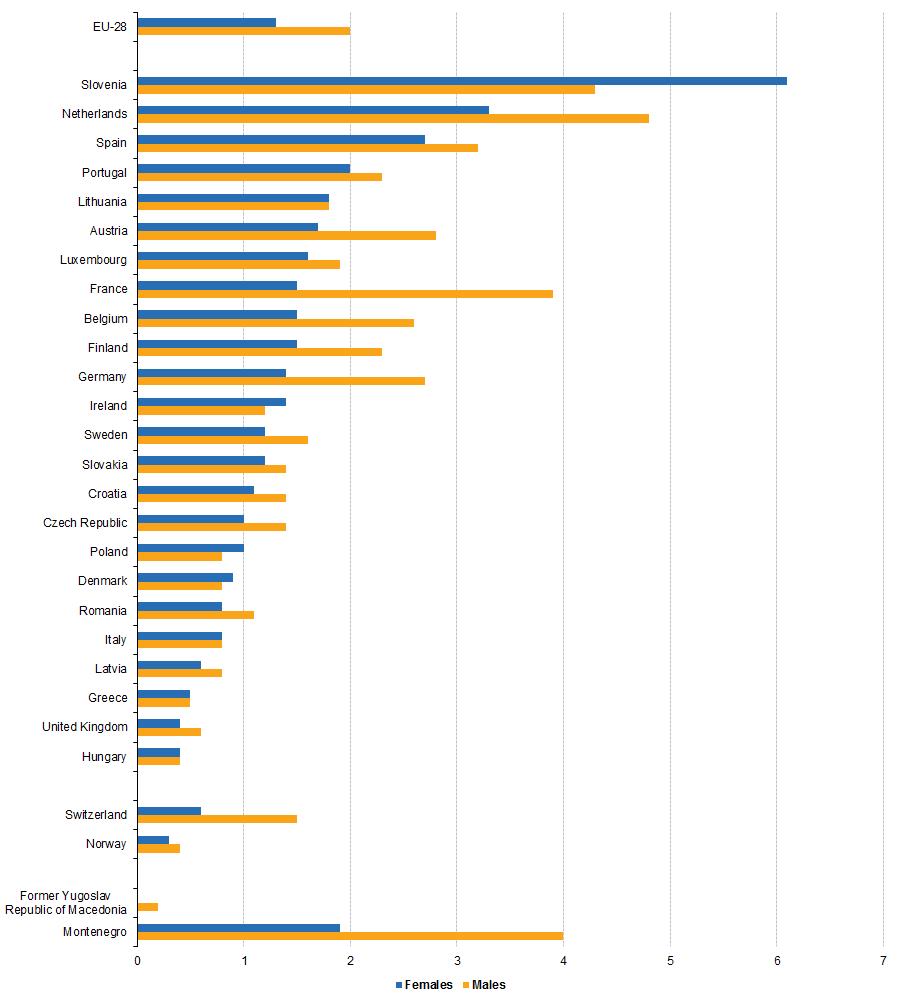
Temporary agency workers 2016.jpg
(
file
)
77 KB
updated country list
3
16:24, 24 January 2018
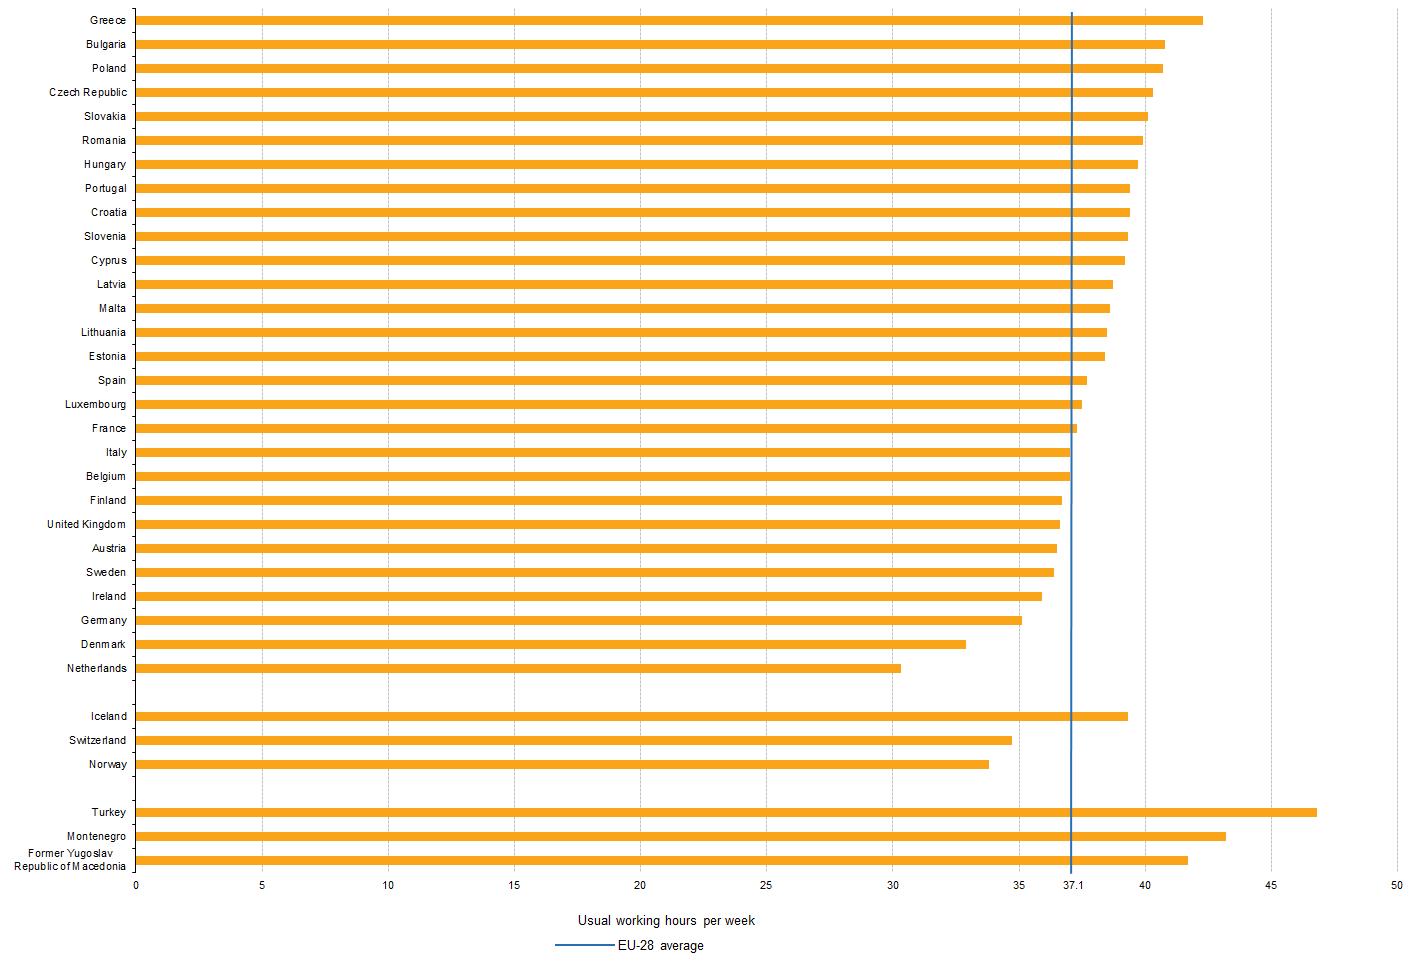
Usual weekly hours in the main job 2016.jpg
(
file
)
140 KB
updated country list
3
16:23, 24 January 2018
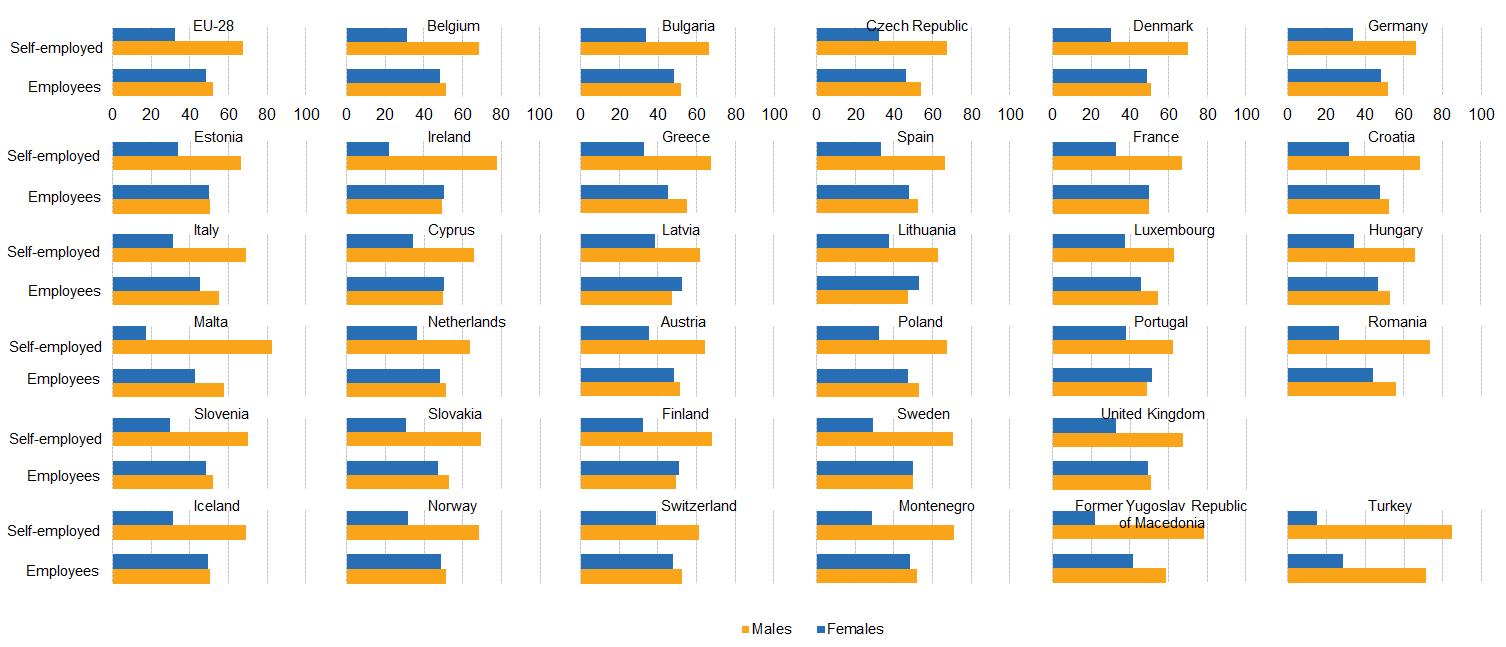
Employees and self-employed by sex 2016.jpg
(
file
)
127 KB
updated country list
3
16:22, 24 January 2018
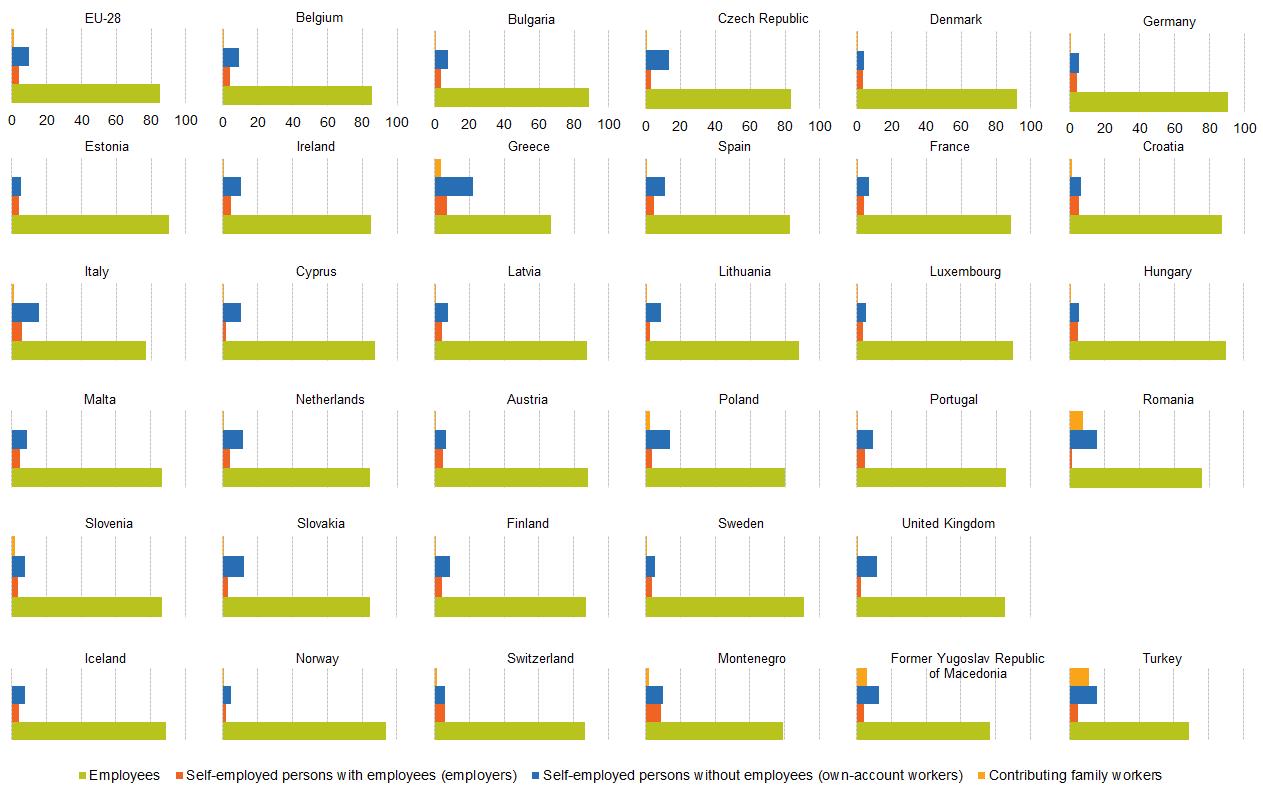
Persons in employment by professional status.jpg
(
file
)
102 KB
updated country list
4
16:21, 24 January 2018
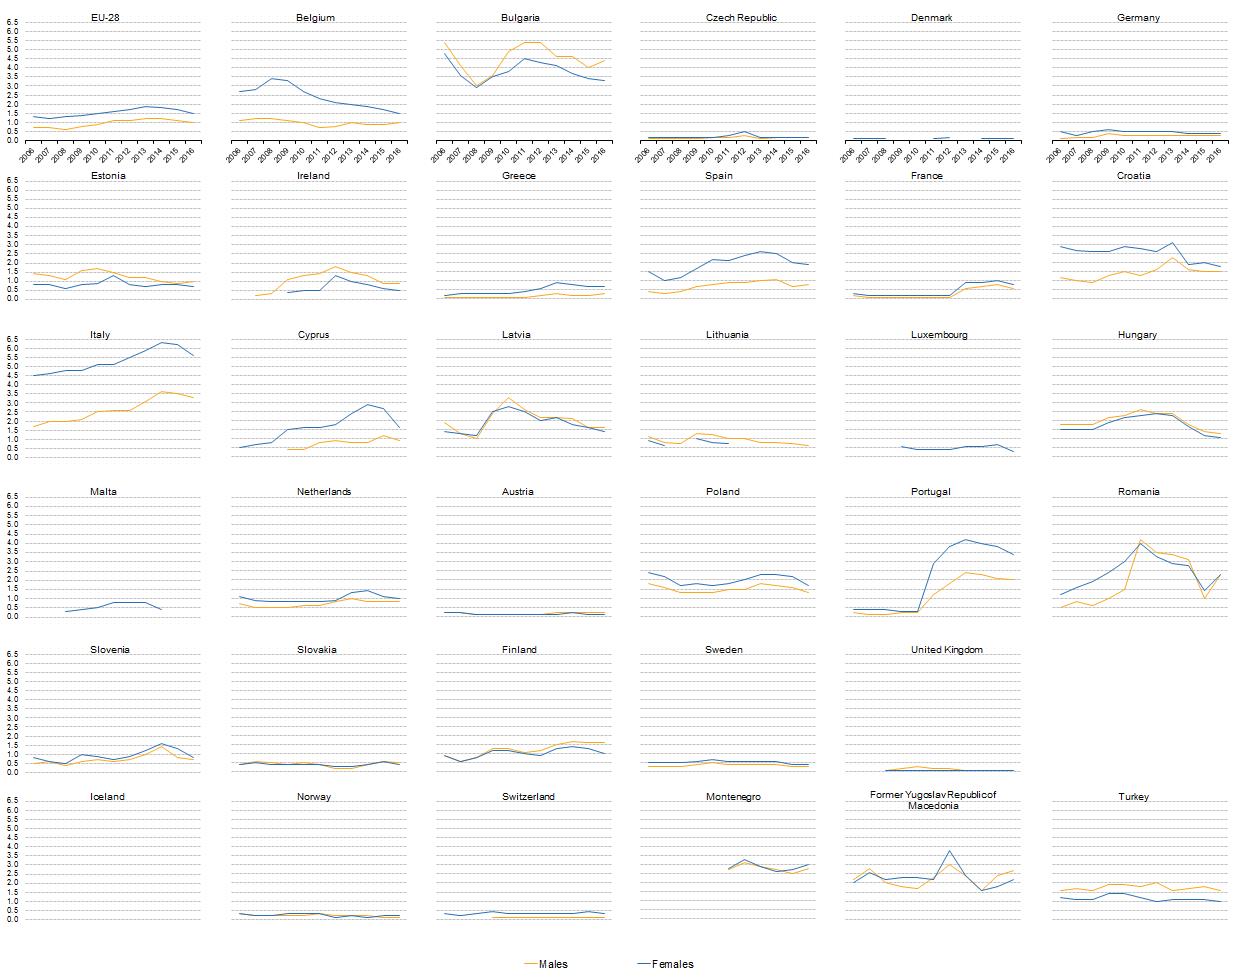
Discouraged job-seekers by year and sex.jpg
(
file
)
189 KB
updated country list
3
10:22, 23 January 2018
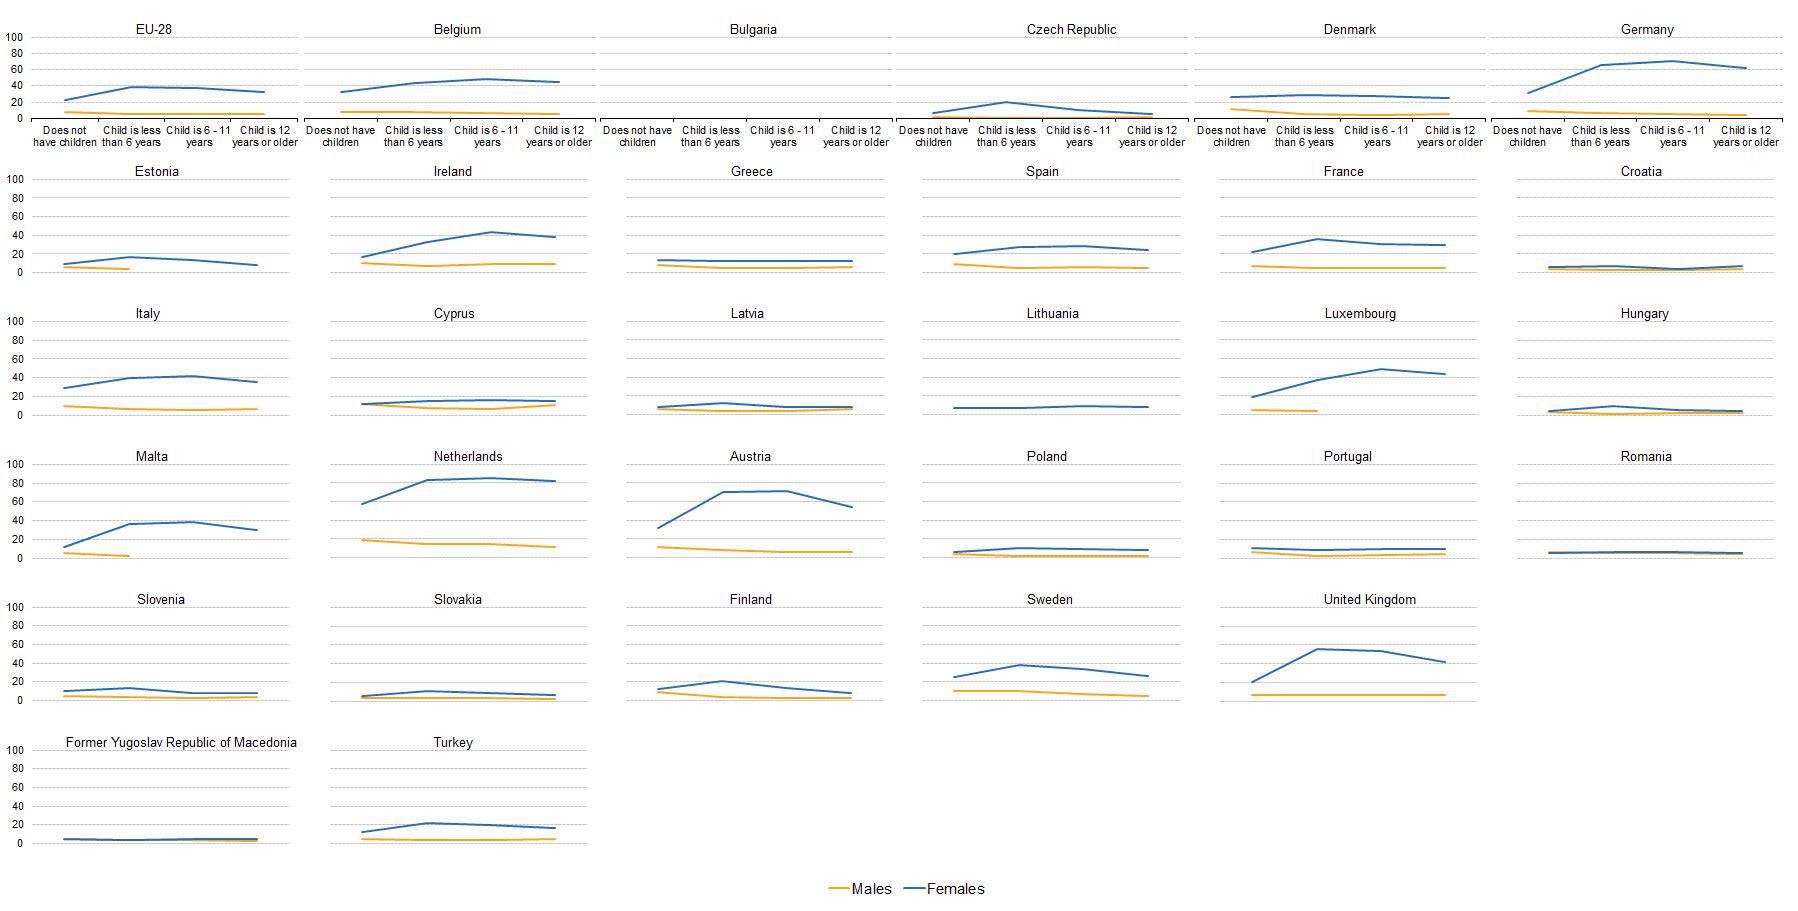
Part-time work by sex and age of children 2016.jpg
(
file
)
166 KB
label corrections
2
10:21, 23 January 2018
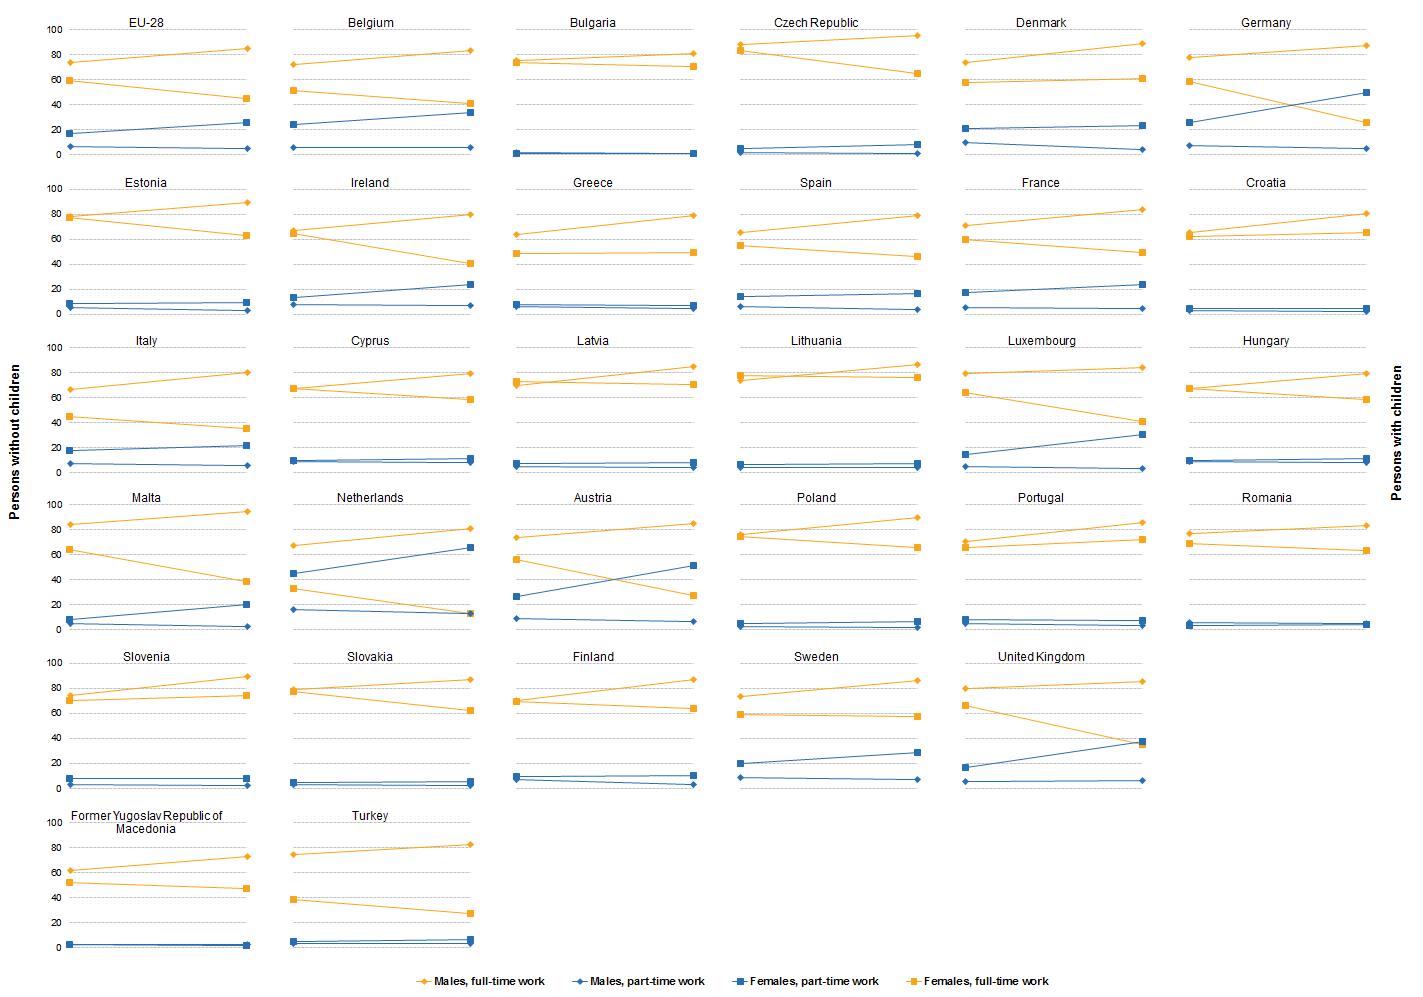
Full-time or part-time work by sex and existence of children 2016.jpg
(
file
)
145 KB
label corrections
2
10:20, 23 January 2018
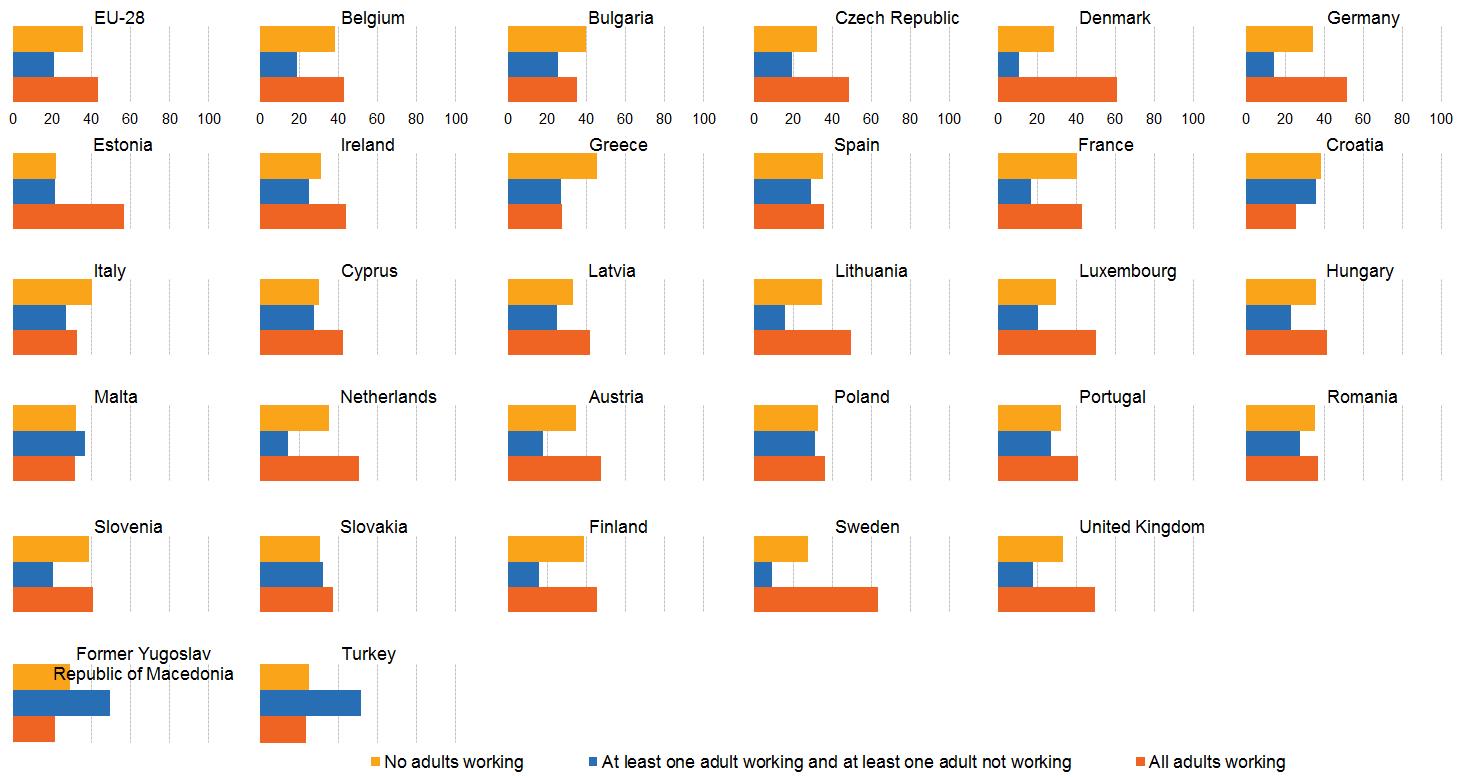
Private households by working status 2016.jpg
(
file
)
106 KB
label corrections
2
14:25, 19 January 2018
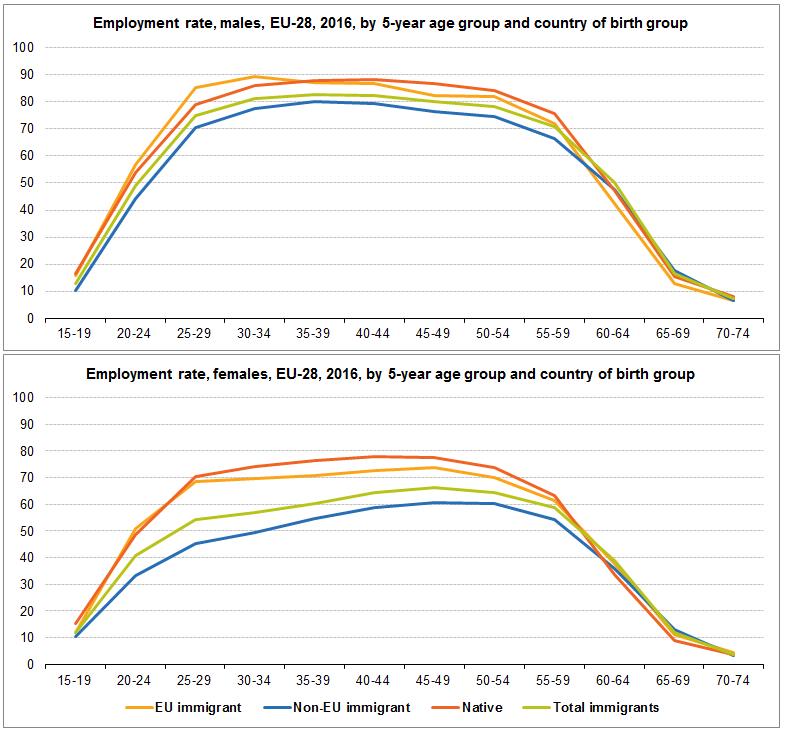
Employment rate by country of birth 2016.jpg
(
file
)
85 KB
1
12:58, 19 January 2018
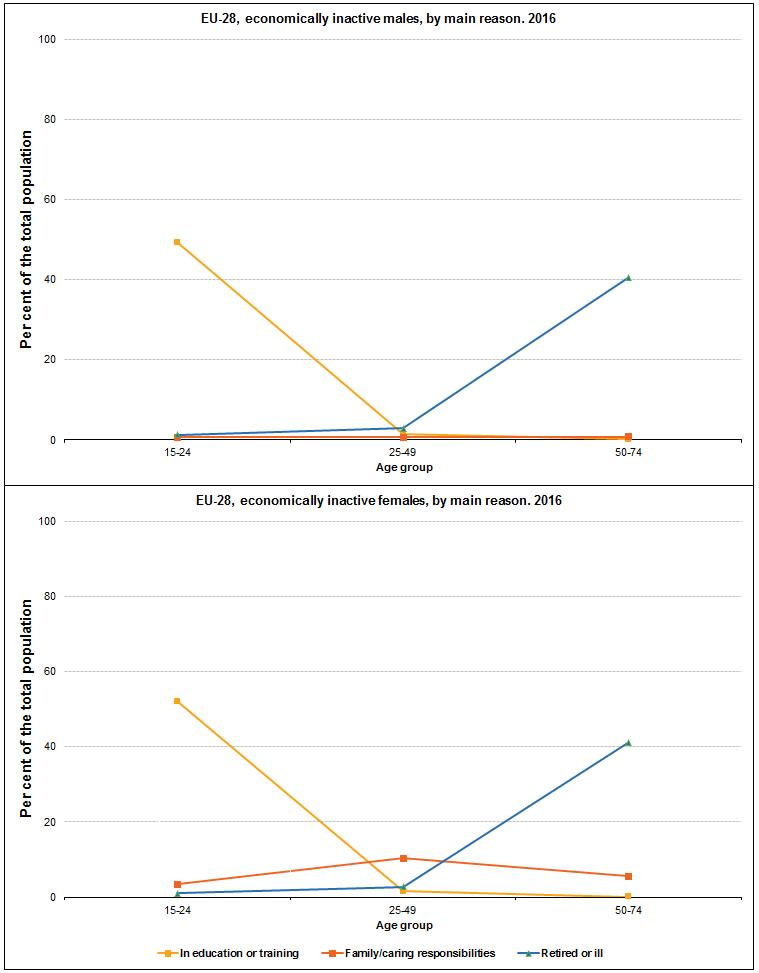
Economically inactive by main reason, age, and sex.jpg
(
file
)
59 KB
1
15:28, 4 September 2017
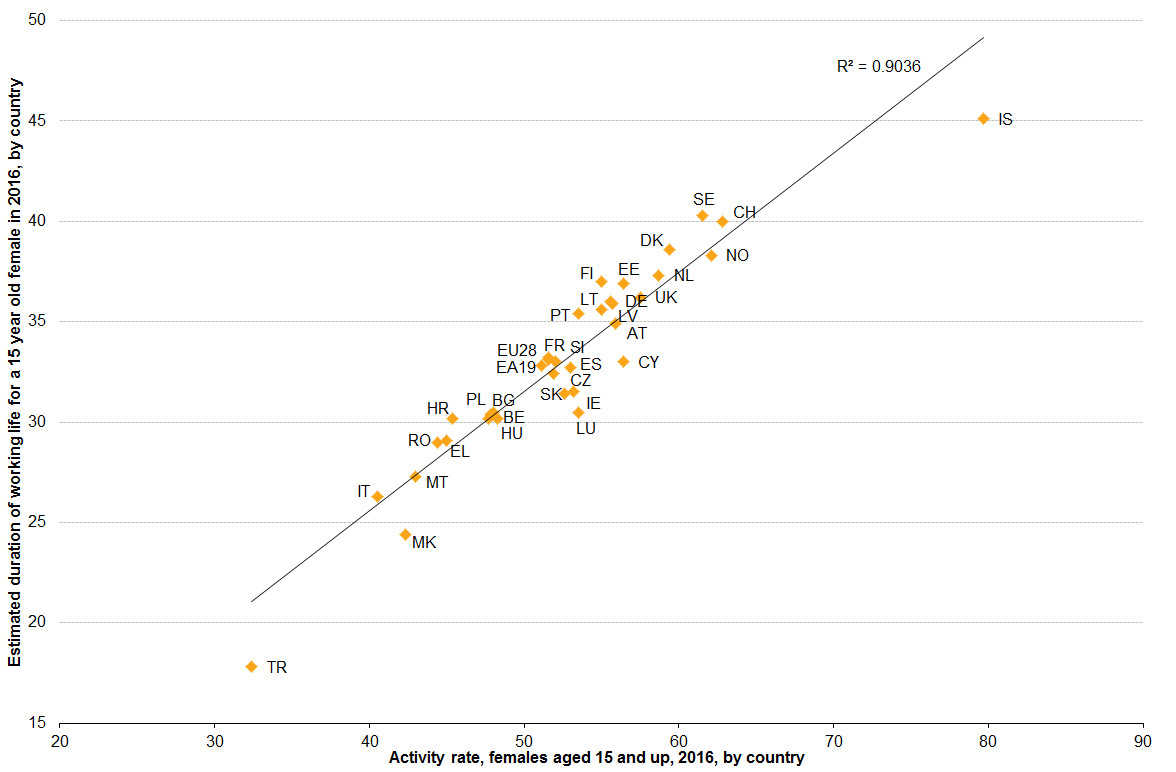
Duration of working life, correlation with activity rate.jpg
(
file
)
104 KB
layout redesign
2
15:28, 4 September 2017
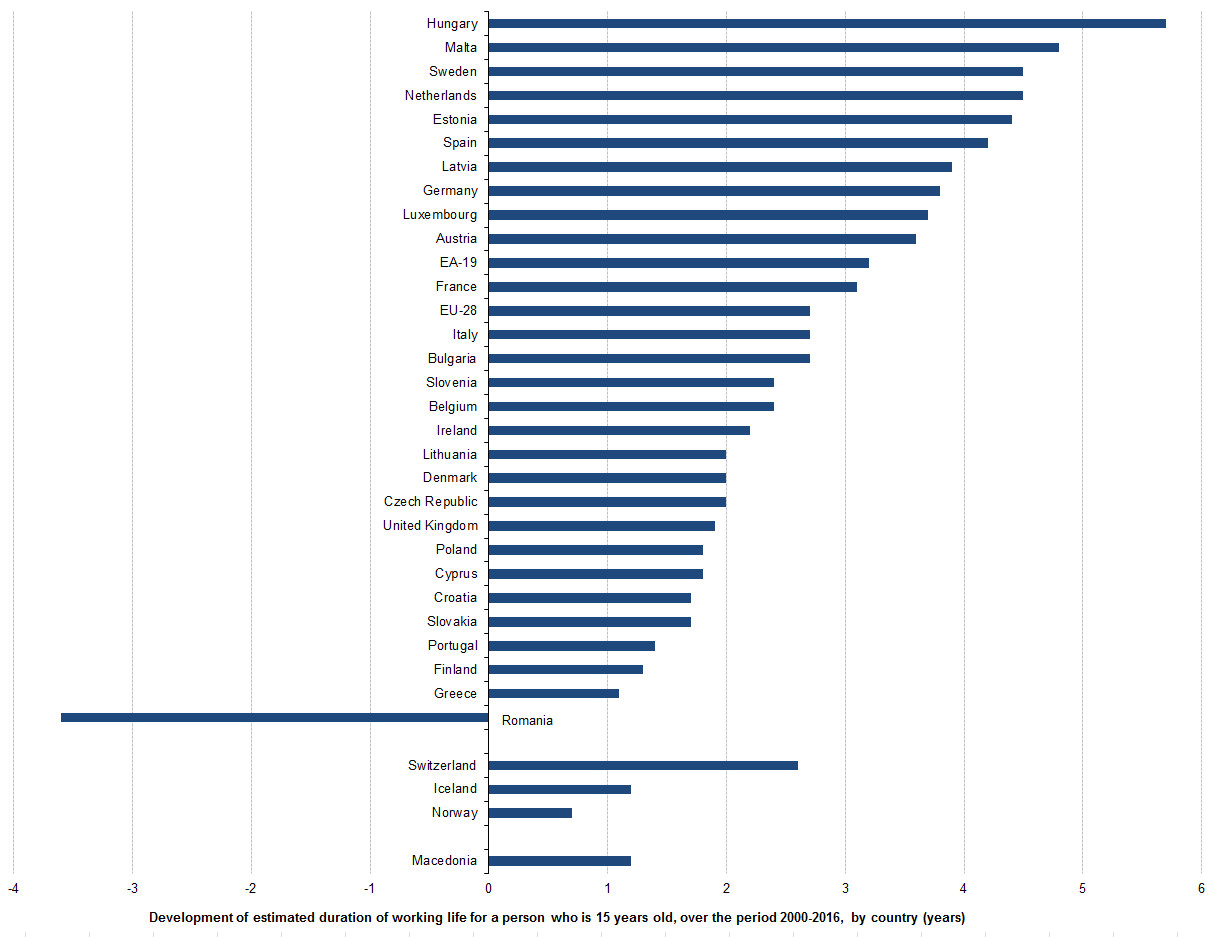
Estimated duration of working life in years for a person who is 15 years old, 2000 and 2016, all countries.jpg
(
file
)
171 KB
layout redesign
3
First page
Previous page
Next page
Last page
Special page
ISSN 2443-8219
.png)
.png)
.png)
.png)
.png)
.png)
.png)


_.png)
_.png)


.png)


