Tutorials
Log in
Statistics Explained
menu
search
search
Navigation
Main page
Statistical themes
Glossary
Categories
Statistics 4 beginners
Tutorials
Help
Eurostat home
Education corner
Online publications
Regional yearbook
Sustainable development
Full list
Tools
User contributions
Logs
View user groups
Special pages
search
Navigation
Main page
Statistical themes
Glossary
Categories
Statistics 4 beginners
Tutorials
Help
Eurostat home
Education corner
Online publications
Regional yearbook
Sustainable development
Full list
Tools
User contributions
Logs
View user groups
Special pages
Navigation
Main page
Statistical themes
Glossary
Categories
Statistics 4 beginners
Tutorials
Help
Eurostat home
Education corner
Online publications
Regional yearbook
Sustainable development
Full list
Tools
User contributions
Logs
View user groups
Special pages
Uploads by Kotecmi
This special page shows all uploaded files.
File list
Items per page:
20
50
100
250
500
Search for media name:
Username:
Include old versions of files
Go
First page
Previous page
Next page
Last page
Date
Name
Thumbnail
Size
Description
Versions
20:20, 22 February 2024
Secondary Material price indicators tables and figures 2023 20240222.xlsx
(
file
)
257 KB
1
20:11, 22 February 2024
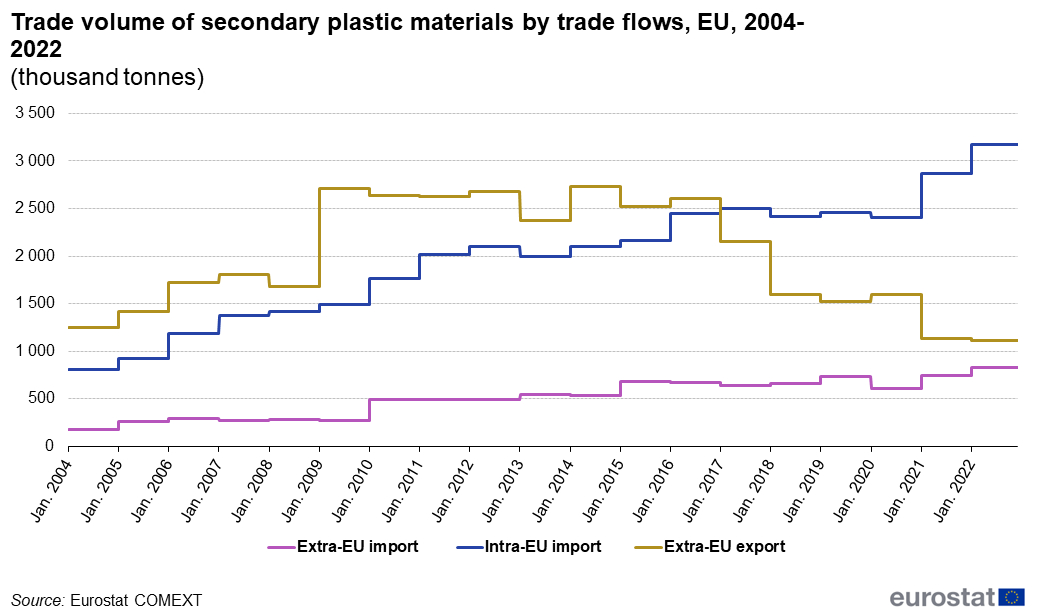
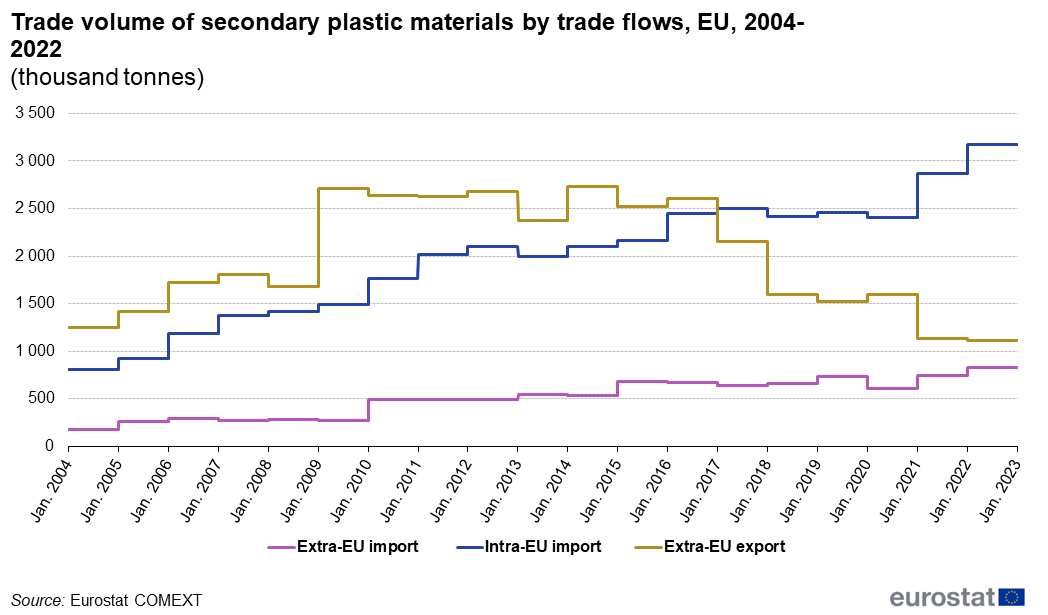
Trade volume of secondary plastic materials by trade flows, EU, 2004-2022 (thousand tonnes) new.png
(
file
)
38 KB
1
20:11, 22 February 2024
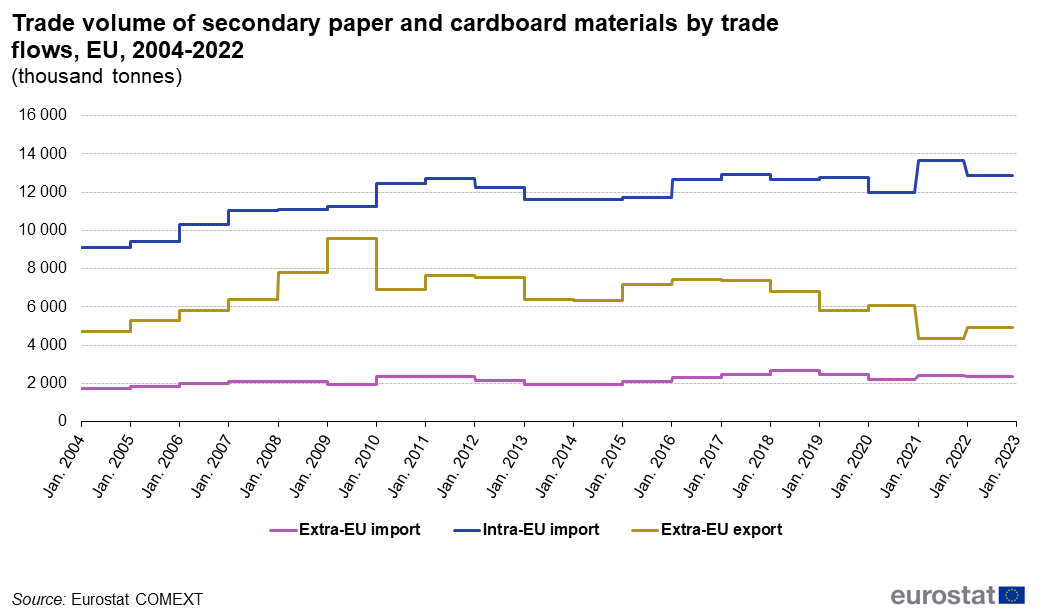
Trade volume of secondary paper and cardboard materials by trade flows, EU, 2004-2022 (thousand tonnes) new.png
(
file
)
37 KB
1
20:10, 22 February 2024
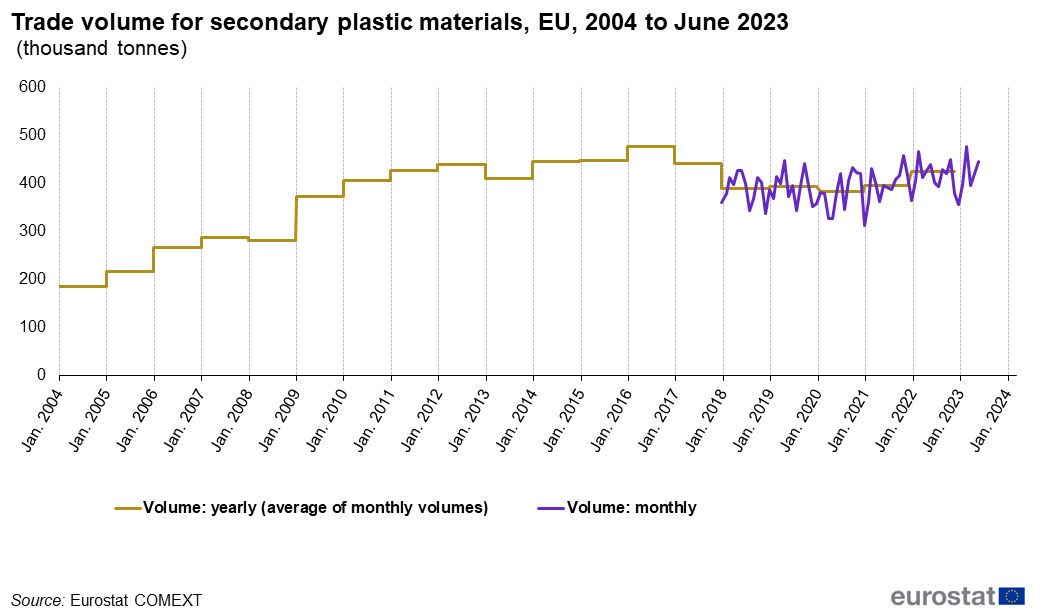
Trade volume for secondary plastic materials, EU, 2004 to June 2023 (thousand tonnes) new.png
(
file
)
48 KB
1
20:10, 22 February 2024
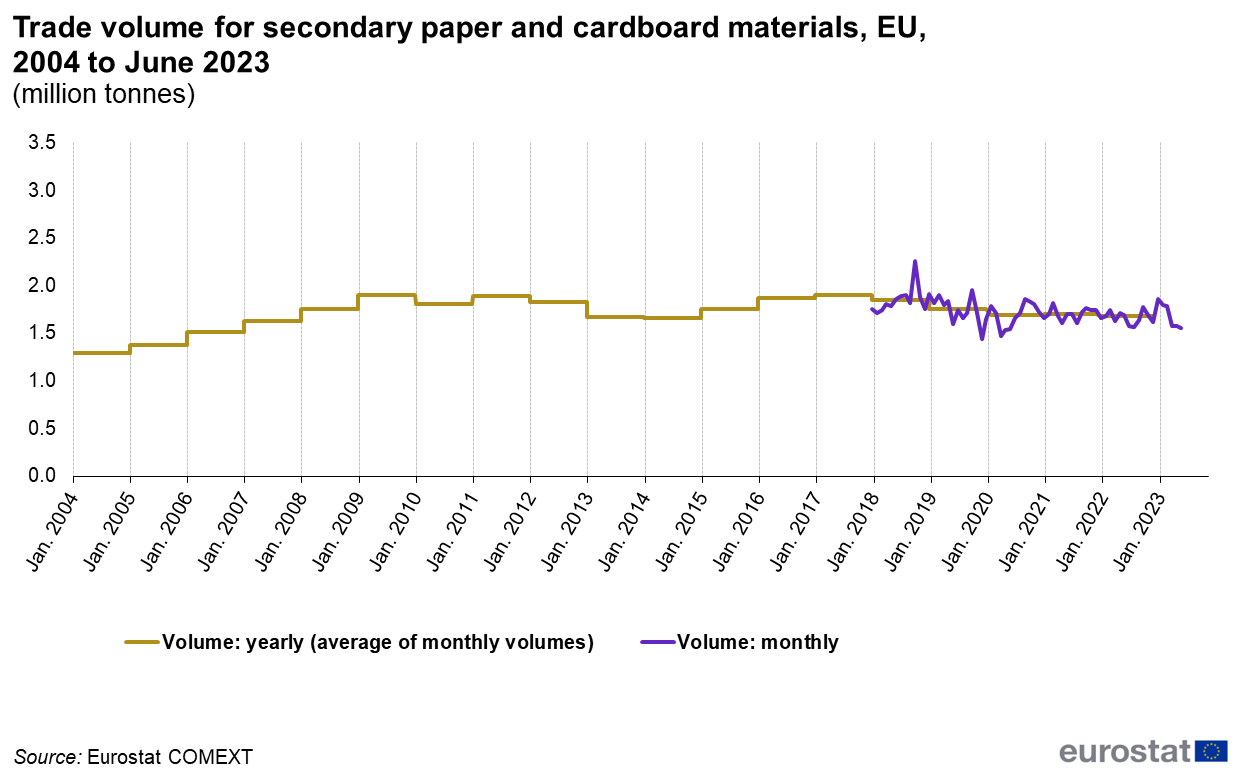
Trade volume for secondary paper and cardboard materials, EU, 2004 to June 2023 (million tonnes) new.png
(
file
)
61 KB
1
20:08, 22 February 2024
Secondary Material price indicators tables and figures 2023 newww.xlsx
(
file
)
257 KB
3
20:06, 22 February 2024
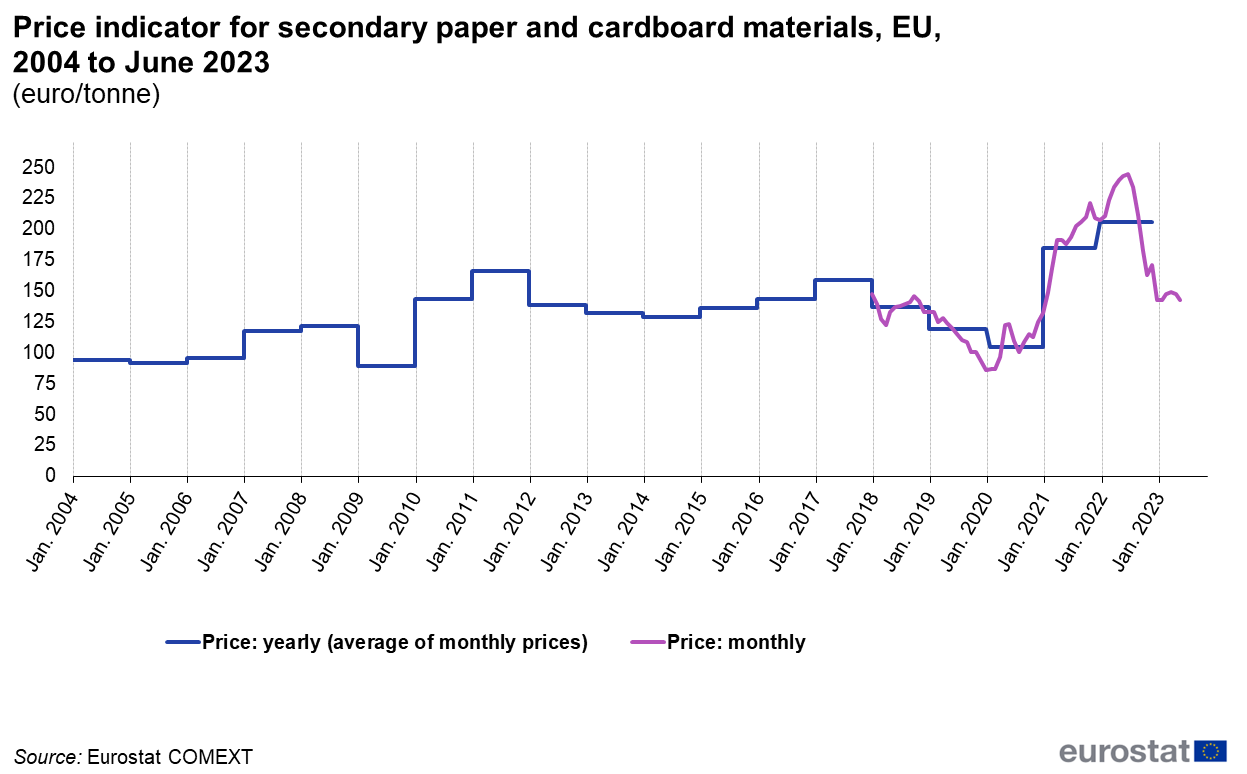
Price indicator for secondary paper and cardboard materials, EU, 2004 to June 2023 (euro tonne) new.png
(
file
)
62 KB
1
20:06, 22 February 2024
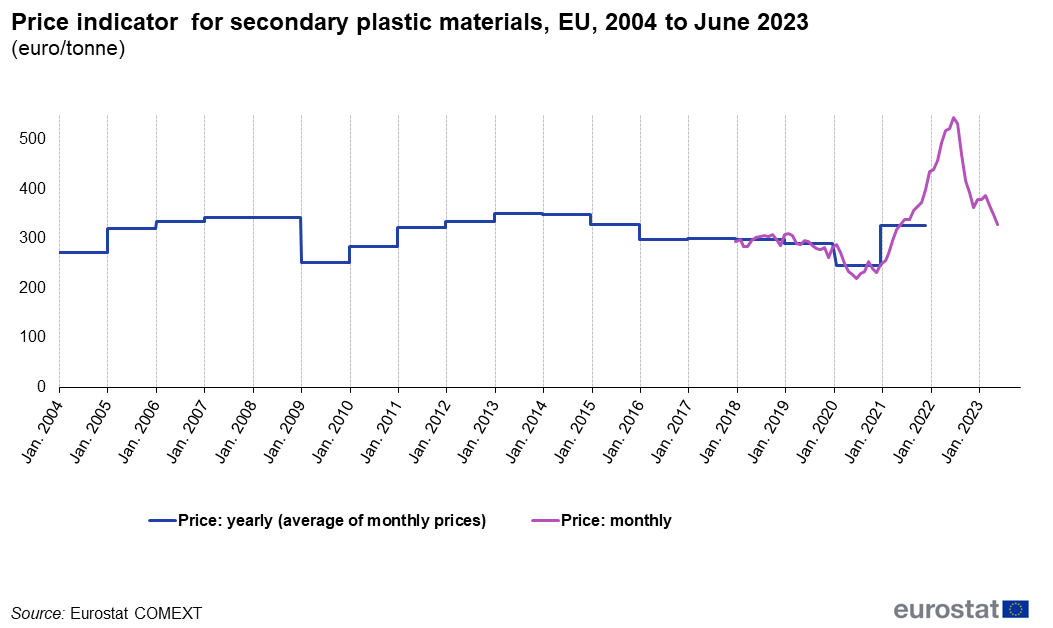
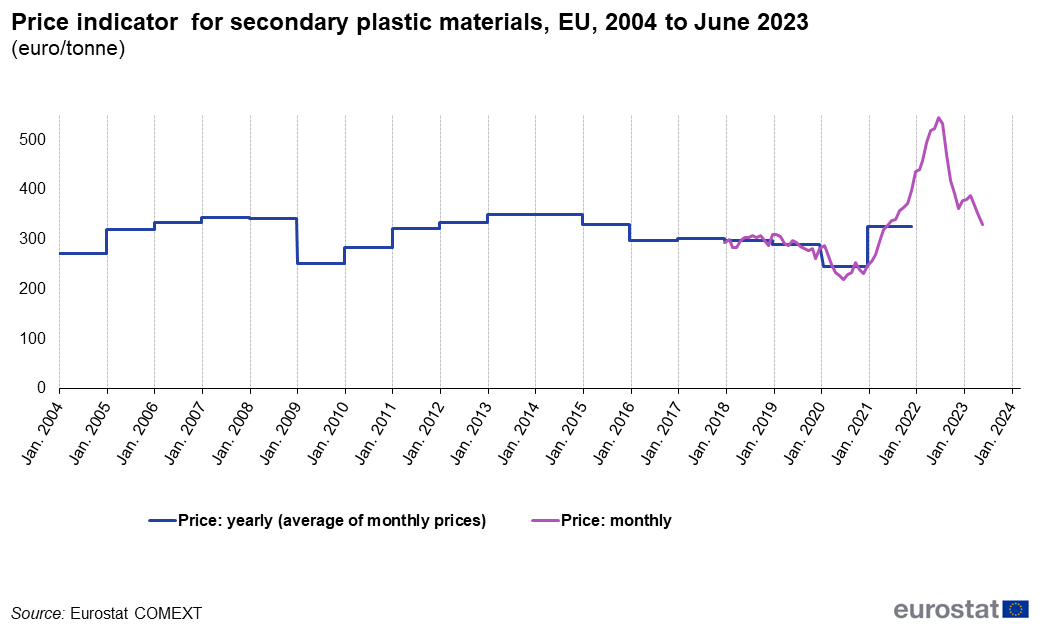
Price indicator for secondary plastic materials, EU, 2004 to June 2023 (euro tonne) new.png
(
file
)
44 KB
1
19:35, 21 February 2024
Secondary Material price indicators tables and figures 2023 new.xlsx
(
file
)
257 KB
1
19:28, 21 February 2024
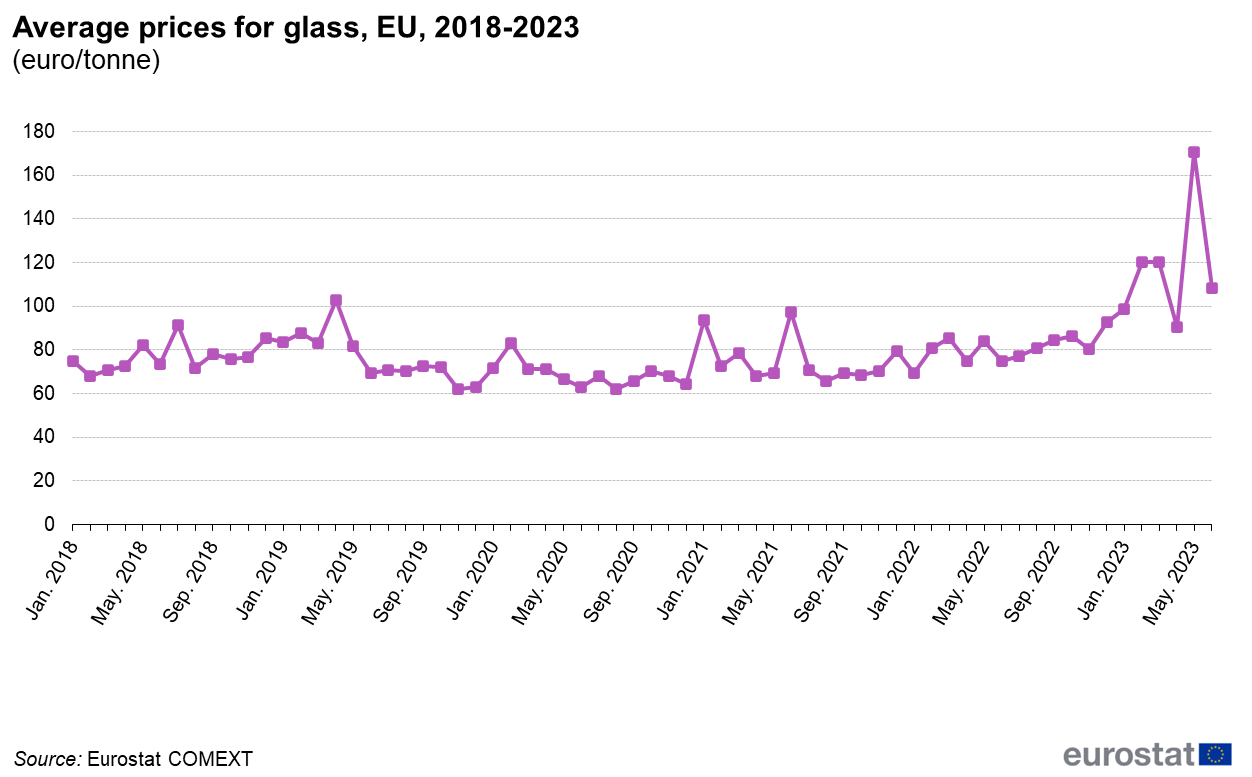
Average Prices for Glass, EU, 2018--2023 (euro tonne).png
(
file
)
55 KB
1
19:25, 21 February 2024
Average Prices for Glass, EU, 2018-2023 (euro tonne) .png
(
file
)
55 KB
3
19:24, 21 February 2024
Secondary Material price indicators tables and figures 2023.xlsx
(
file
)
55 KB
5
19:08, 21 February 2024
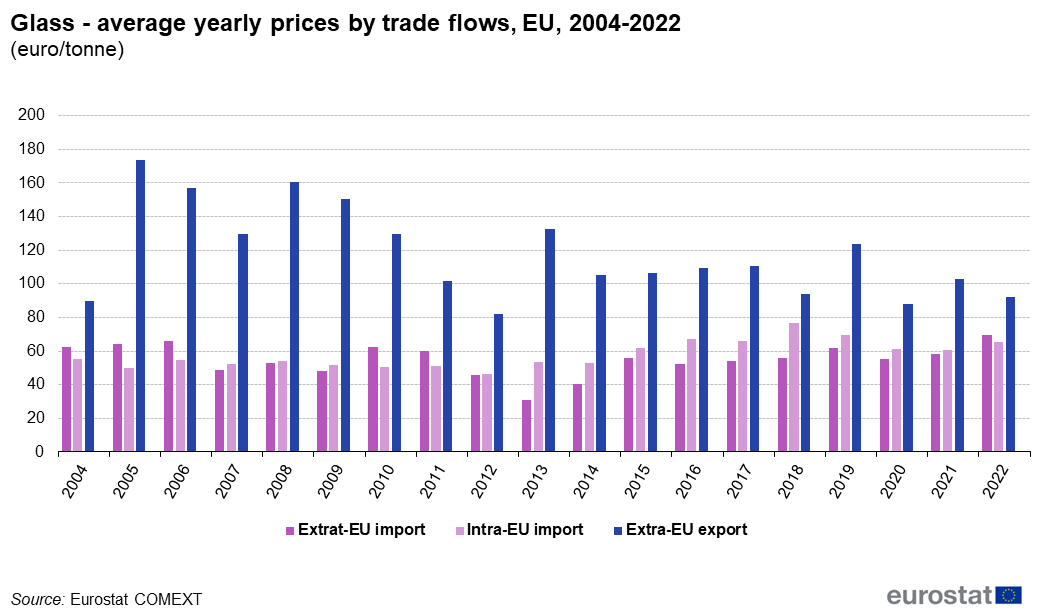
Glass - average yearly prices by trade flows, EU, 2004-2022 (euro tonne).png
(
file
)
53 KB
1
18:52, 21 February 2024
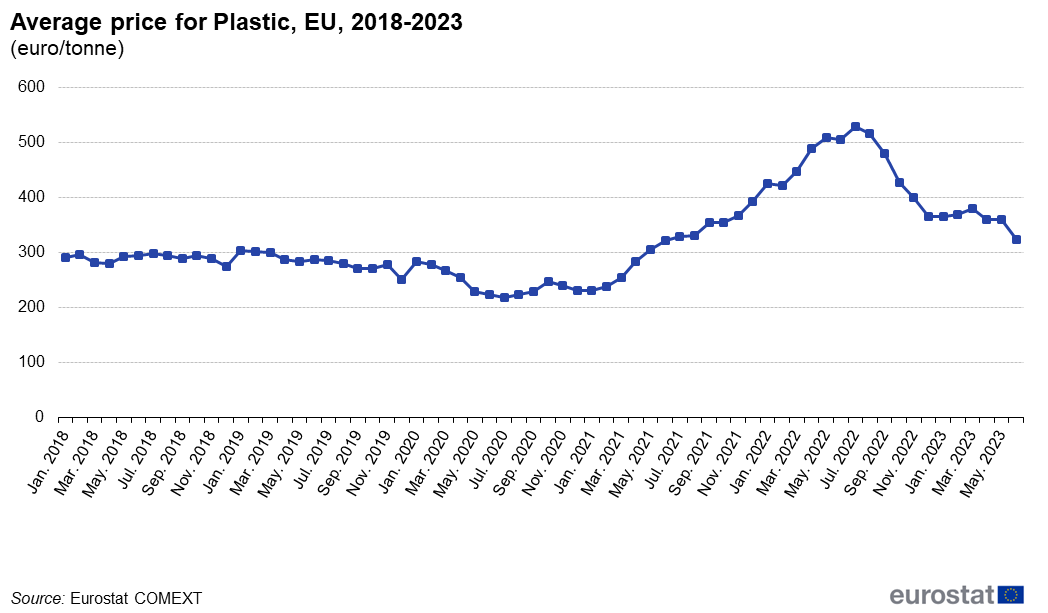
Average price for Plastic, EU, 2018-2023 (euro tonne) .png
(
file
)
47 KB
2
18:51, 21 February 2024
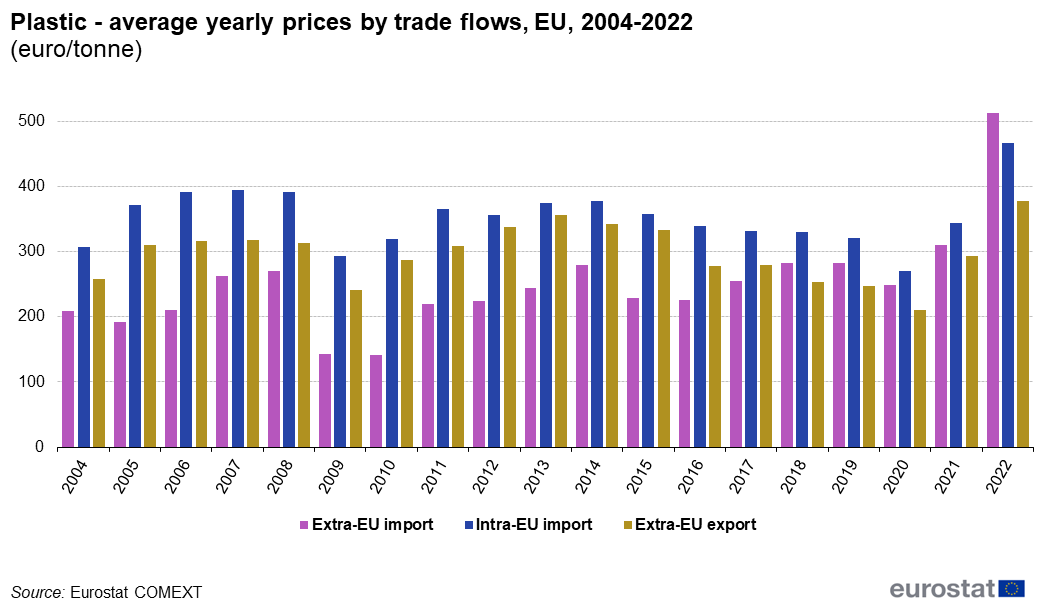
Plastic - average yearly prices by trade flows, EU, 2004-2022 (euro tonne).png
(
file
)
63 KB
1
18:50, 21 February 2024
Trade volume of secondary plastic materials by trade flows, EU, 2004-2022 (thousand tonnes).png
(
file
)
38 KB
2
18:49, 21 February 2024
Paper and cardboard - average yearly prices by trade flows, EU, 2004-2022 (euro tonne).png
(
file
)
65 KB
1
18:49, 21 February 2024
Trade volume of secondary paper and cardboard materials by trade flows, EU, 2004-2022 (thousand tonnes).png
(
file
)
38 KB
1
18:48, 21 February 2024
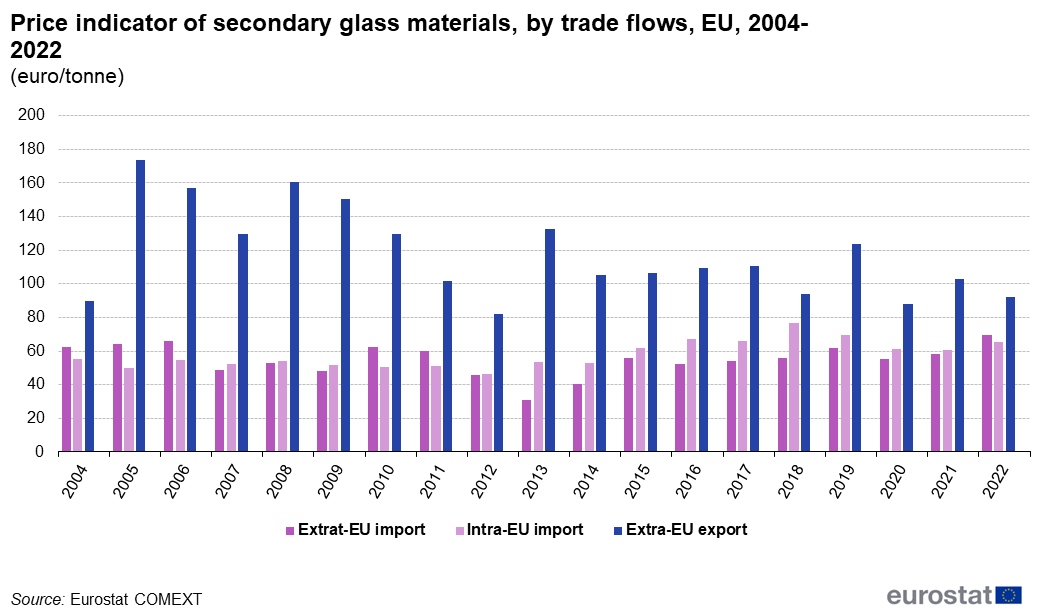
Price indicator of secondary glass materials, by trade flows, EU, 2004-2022 (euro tonne).png
(
file
)
54 KB
1
18:48, 21 February 2024
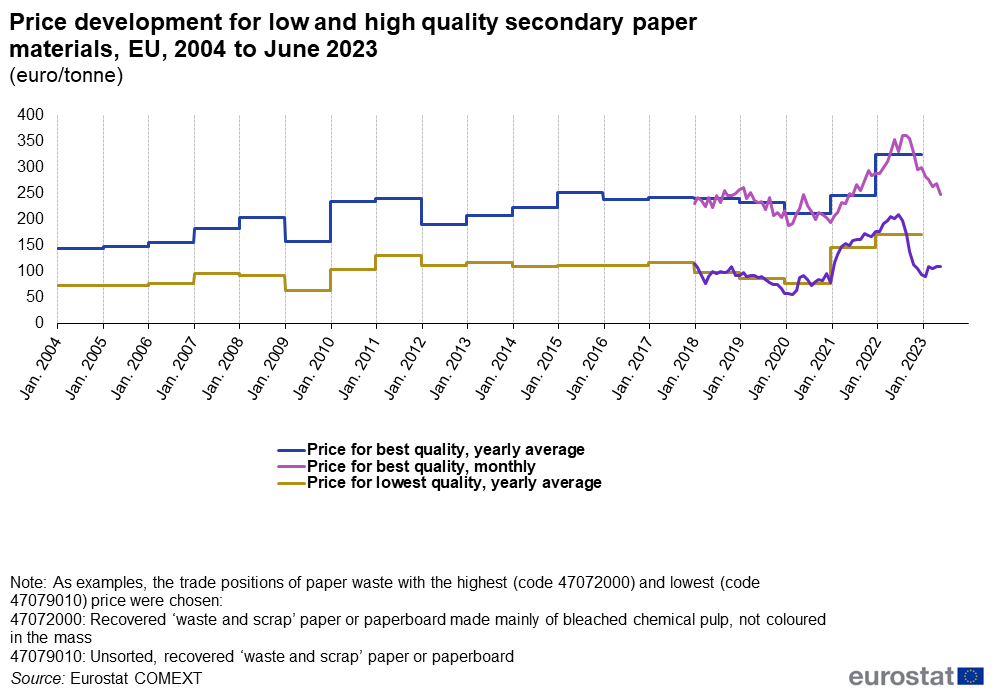
Price development for low and high quality secondary paper materials, EU, 2004 to June 2023 (euro tonne).png
(
file
)
60 KB
1
18:46, 21 February 2024
Price indicator for secondary plastic materials, EU, 2004 to June 2023 (euro tonne).png
(
file
)
46 KB
1
18:44, 21 February 2024
Trade volume for secondary plastic materials, EU, 2004 to June 2023 (thousand tonnes).png
(
file
)
47 KB
1
18:43, 21 February 2024
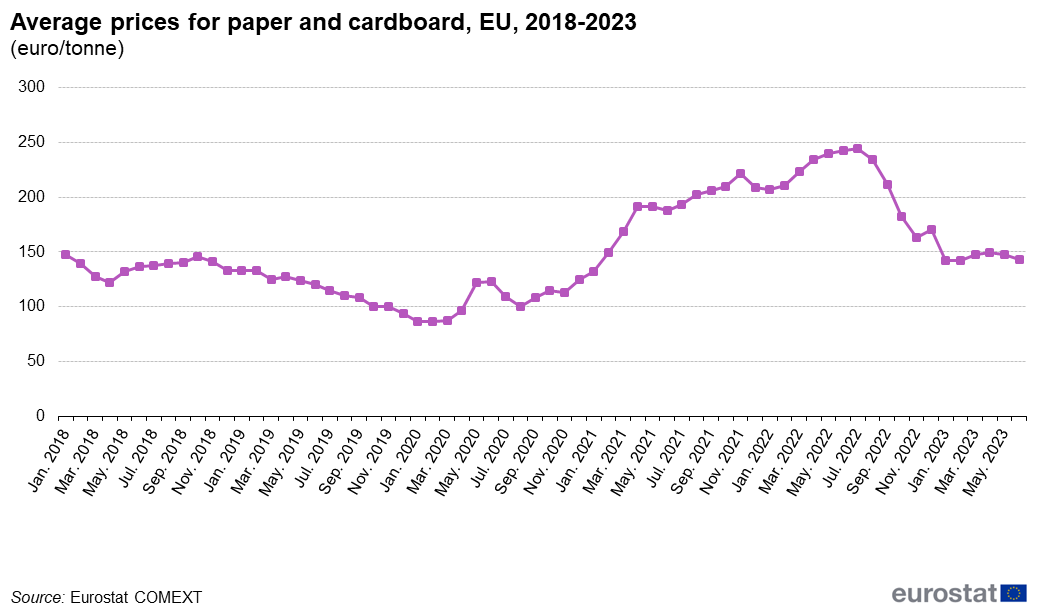
Average prices for paper and cardboard, EU, 2018-2023 (euro tonne).png
(
file
)
43 KB
1
18:43, 21 February 2024
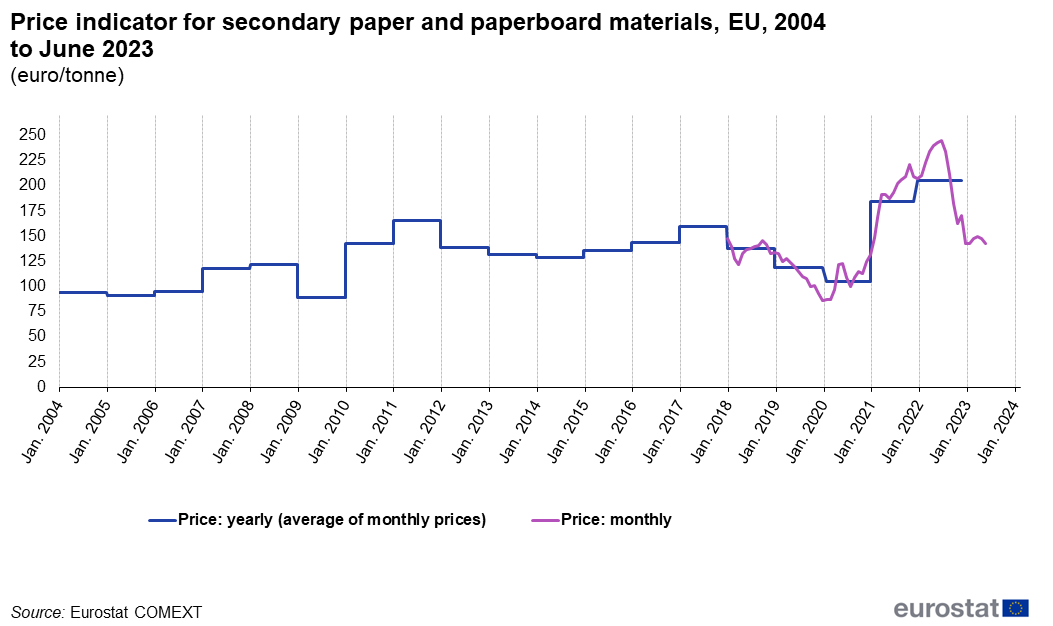
Price indicator for secondary paper and paperboard materials, EU, 2004 to June 2023 (euro tonne).png
(
file
)
47 KB
1
18:42, 21 February 2024
Trade volume for secondary paper and paperboard materials, EU, 2004 to June 2023 (million tonnes).png
(
file
)
46 KB
1
18:06, 21 February 2024
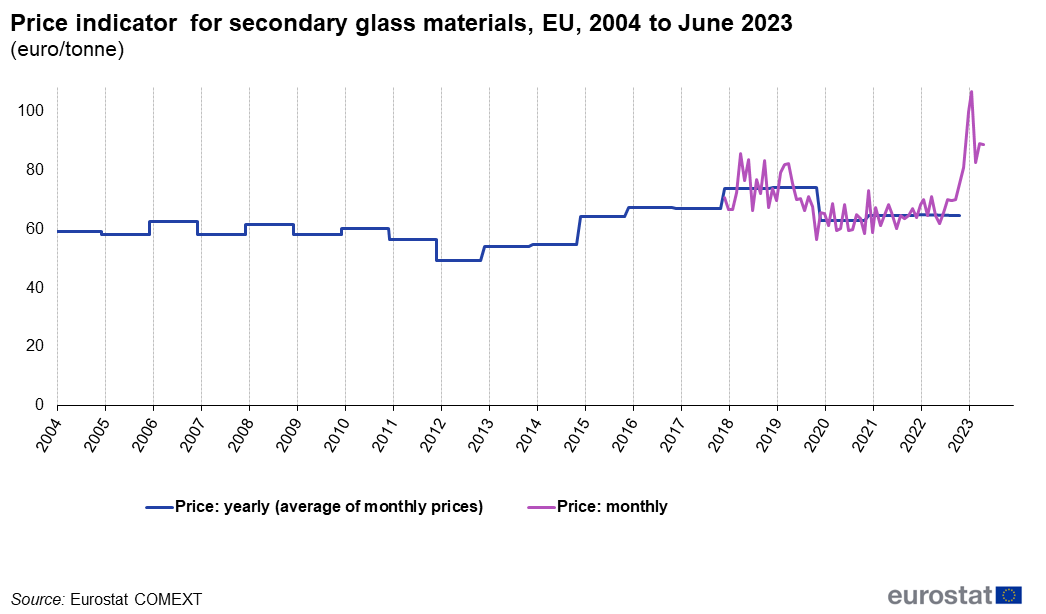
Price indicator for secondary glass materials, EU, 2004 to June 2023 (euro tonne).png
(
file
)
37 KB
1
18:05, 21 February 2024
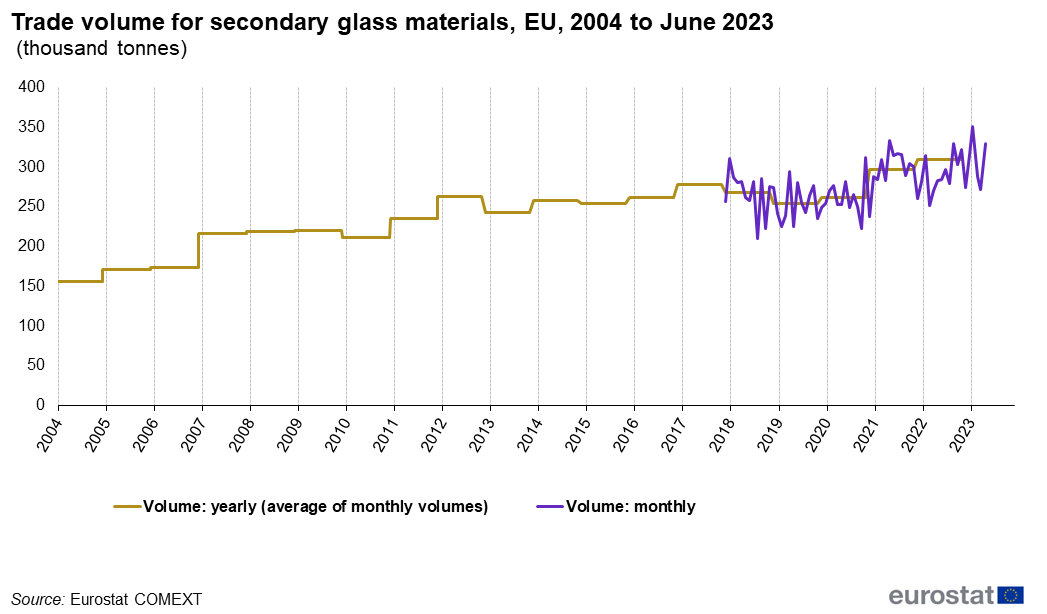
Trade volume for secondary glass materials, EU, 2004 to June 2023 (thousand tonnes).png
(
file
)
45 KB
1
12:42, 19 December 2023
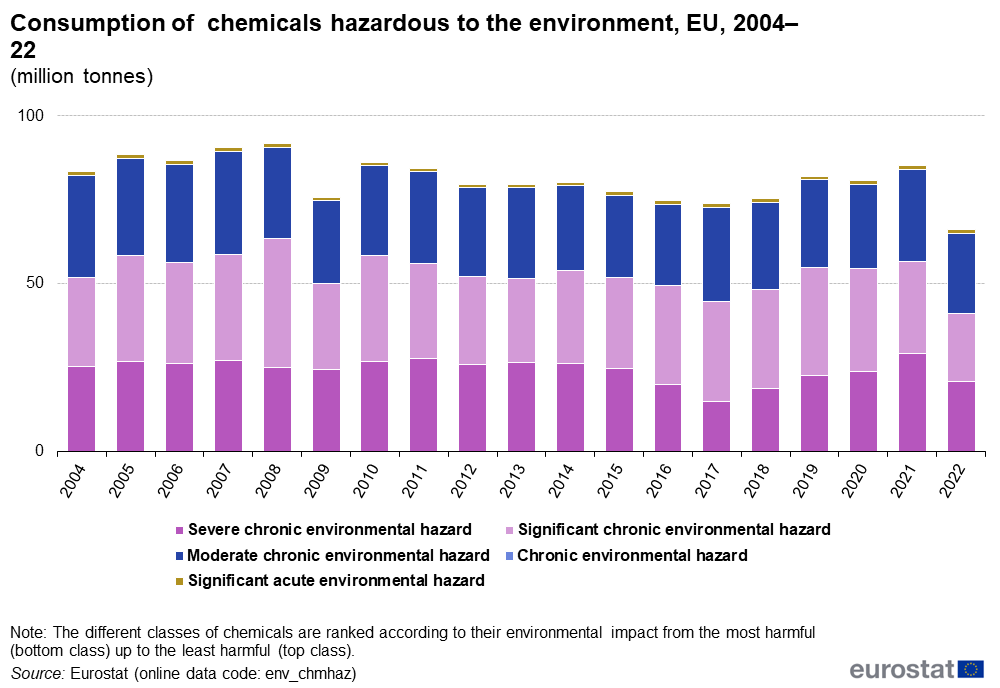
NEW Consumption of chemicals hazardous to the environment, EU, 2004–22 (million tonnes).png
(
file
)
55 KB
1
12:40, 19 December 2023
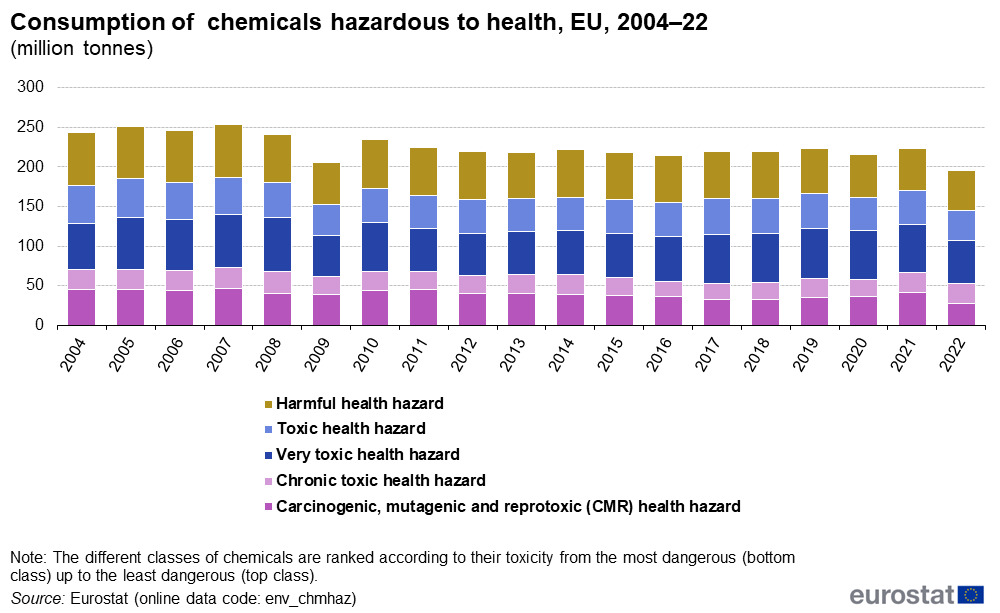
NEW Consumption of chemicals hazardous to health, EU, 2004–22 (million tonnes).png
(
file
)
50 KB
1
12:39, 19 December 2023
NEW Consumption of chemicals, EU, 2004–22 (2004 = 100).png
(
file
)
47 KB
1
12:38, 19 December 2023
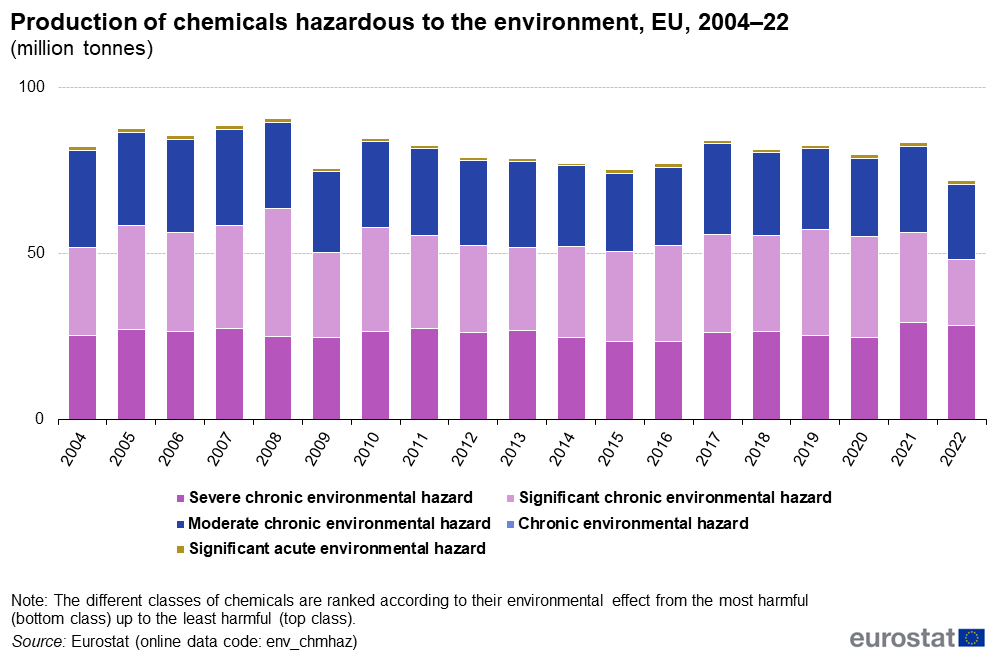
NEW Production of chemicals hazardous to the environment, EU, 2004–22 (million tonnes).png
(
file
)
54 KB
1
12:37, 19 December 2023
NEW Effective changes in the production of chemicals hazardous to health, EU, 2004 – 2022 (% point) .png
(
file
)
39 KB
1
12:36, 19 December 2023
NEW Production of chemicals hazardous to health, EU, 2004–22 (million tonnes).png
(
file
)
54 KB
1
12:34, 19 December 2023
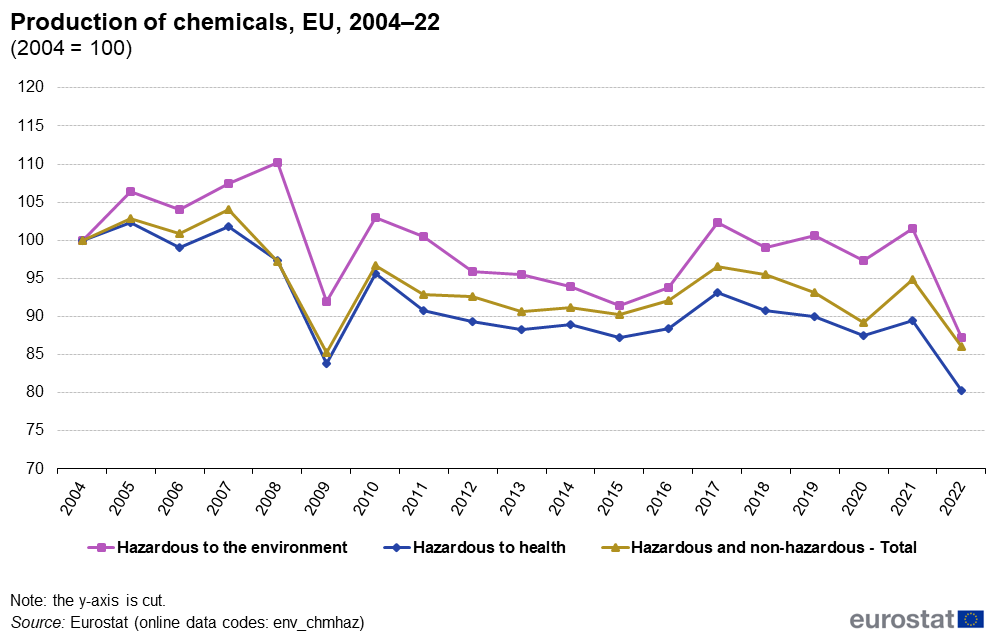
NEW Production of chemicals, EU, 2004–22 (2004 = 100).png
(
file
)
49 KB
1
12:29, 19 December 2023
Production of chemicals, EU, 2004–22 (2004 = 100).png
(
file
)
49 KB
2
12:26, 19 December 2023
Consumption of chemicals hazardous to health, EU, 2004–22 (million tonnes).png
(
file
)
50 KB
2
19:37, 30 November 2023
Recycling batteries and accumulators-ref2021 20231130.xlsx
(
file
)
117 KB
1
19:28, 30 November 2023
F4 Recycling efficiencies for other batteries, 2012 and 2021 (useful recycled materials in % of input fractions).png
(
file
)
95 KB
1
19:27, 30 November 2023
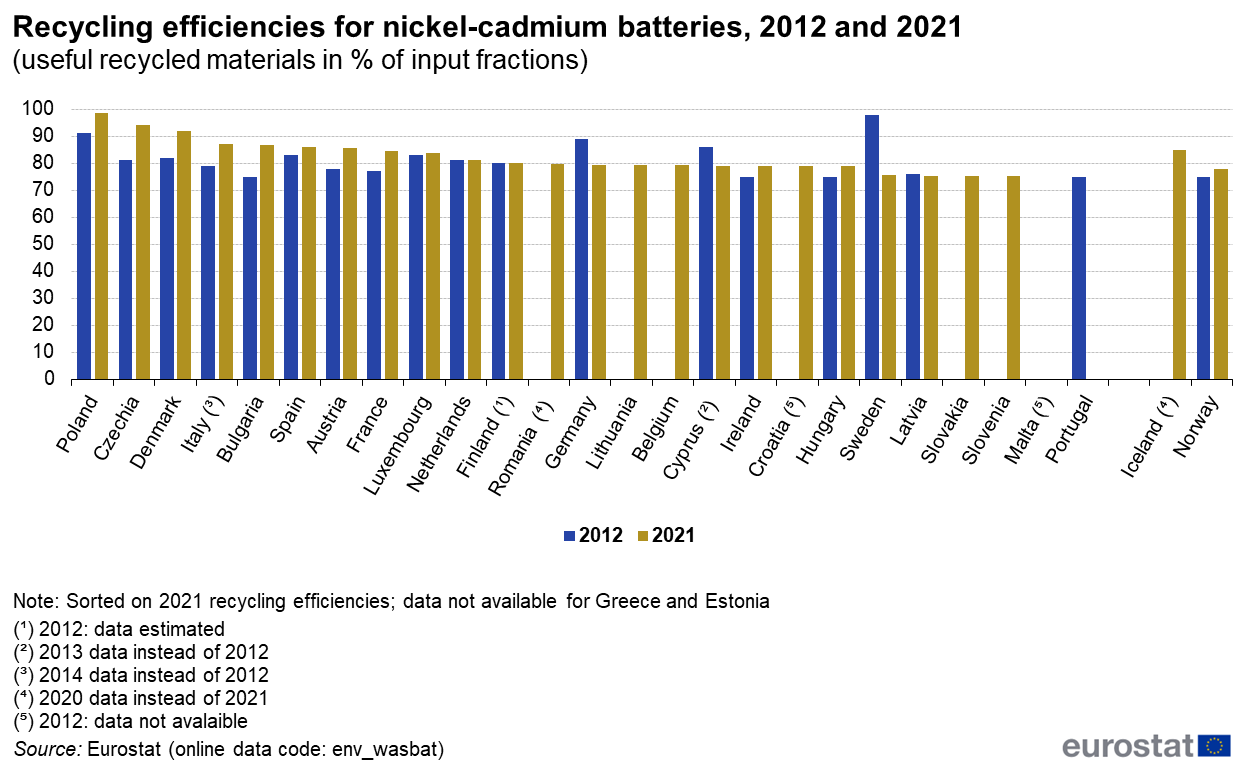
F3 Recycling efficiencies for nickel-cadmium batteries, 2012 and 2021 (useful recycled materials in % of input fractions).png
(
file
)
105 KB
1
19:27, 30 November 2023
F2 Recycling efficiencies for lead-acid batteries, 2012 and 2021 (useful recycled materials in % of input fractions).png
(
file
)
121 KB
1
19:26, 30 November 2023
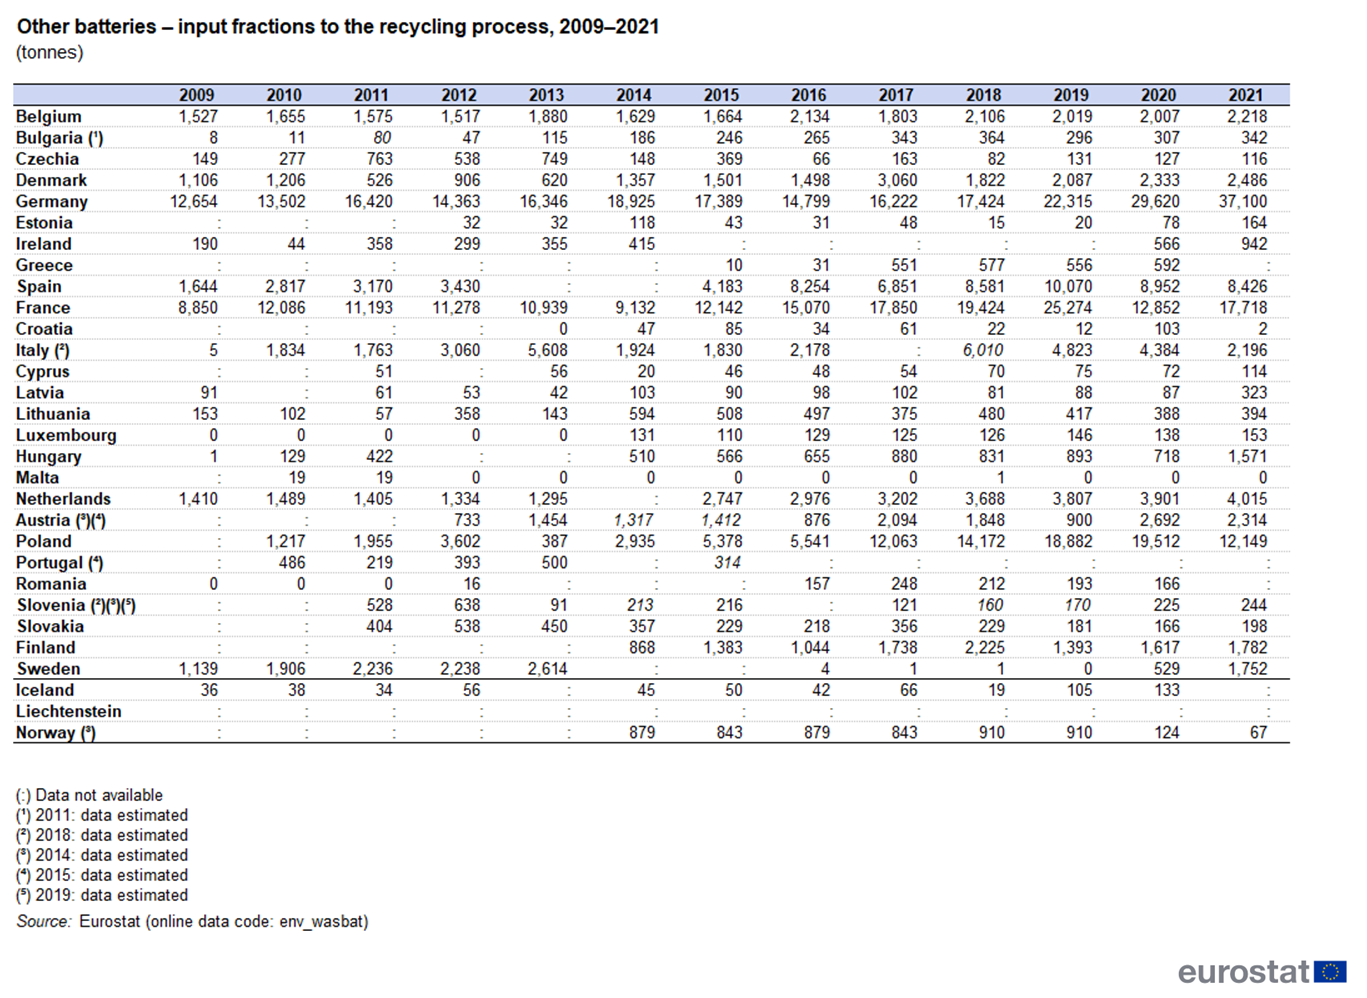
T3c Other batteries – input fractions to the recycling process, 2009–2021 (tonnes).png
(
file
)
509 KB
1
19:26, 30 November 2023
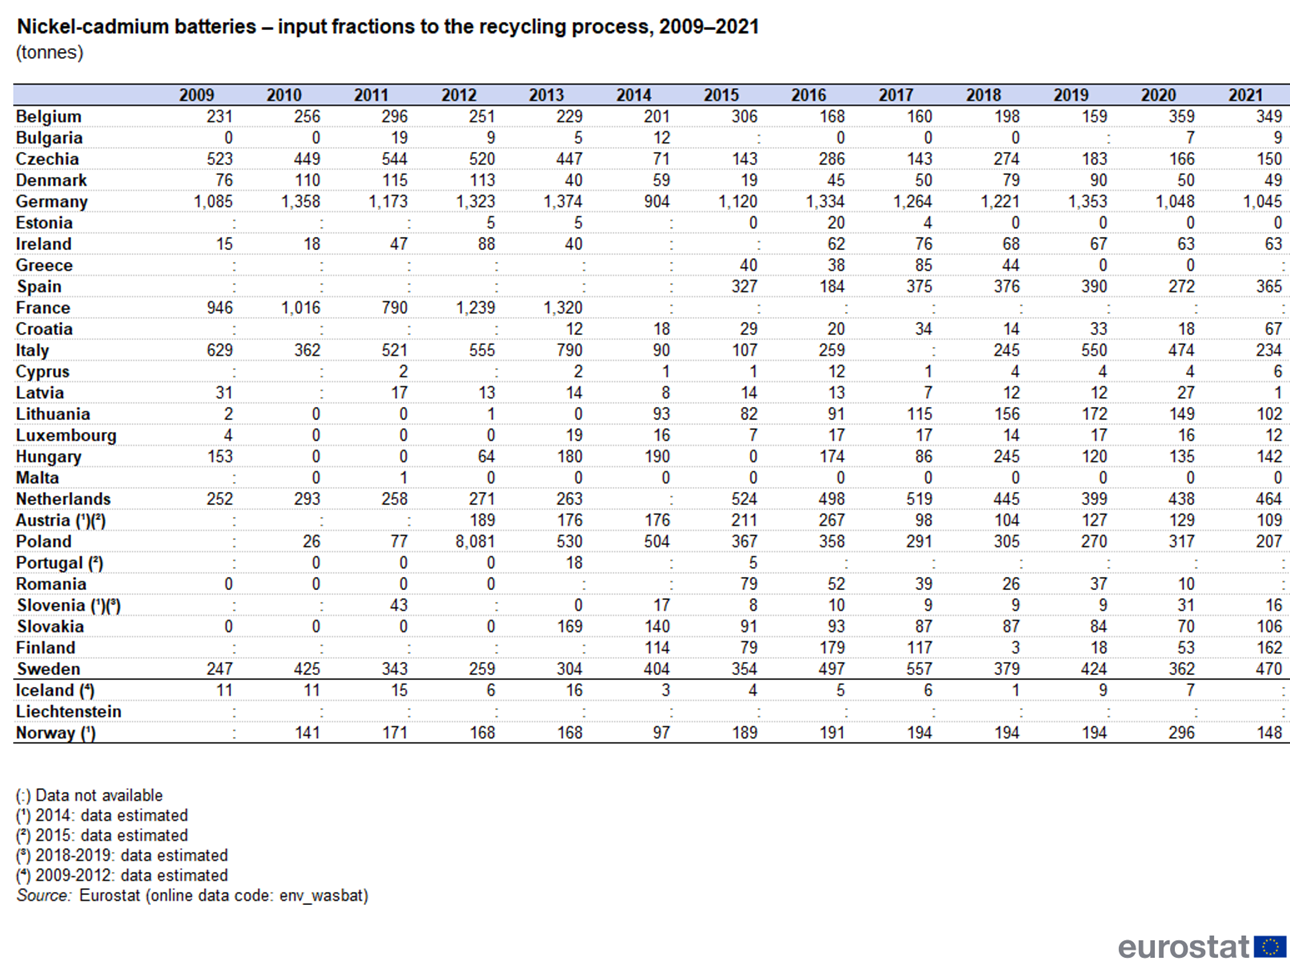
T3b Nickel-cadmium batteries – input fractions to the recycling process, 2009–2021 (tonnes).png
(
file
)
421 KB
1
19:23, 30 November 2023
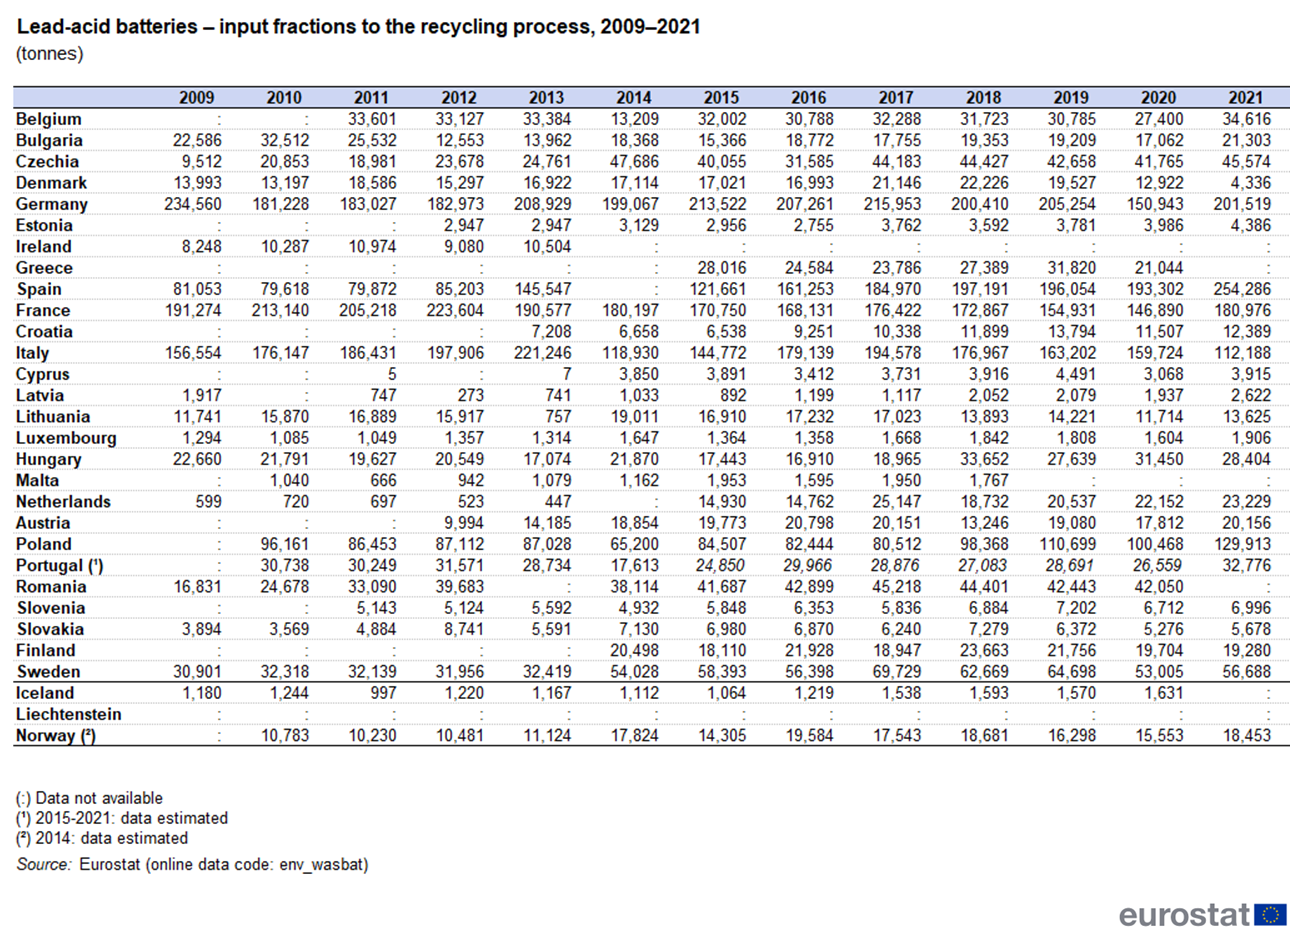
T3a Lead-acid batteries – input fractions to the recycling process, 2009–2021 (tonnes).png
(
file
)
685 KB
1
19:21, 30 November 2023
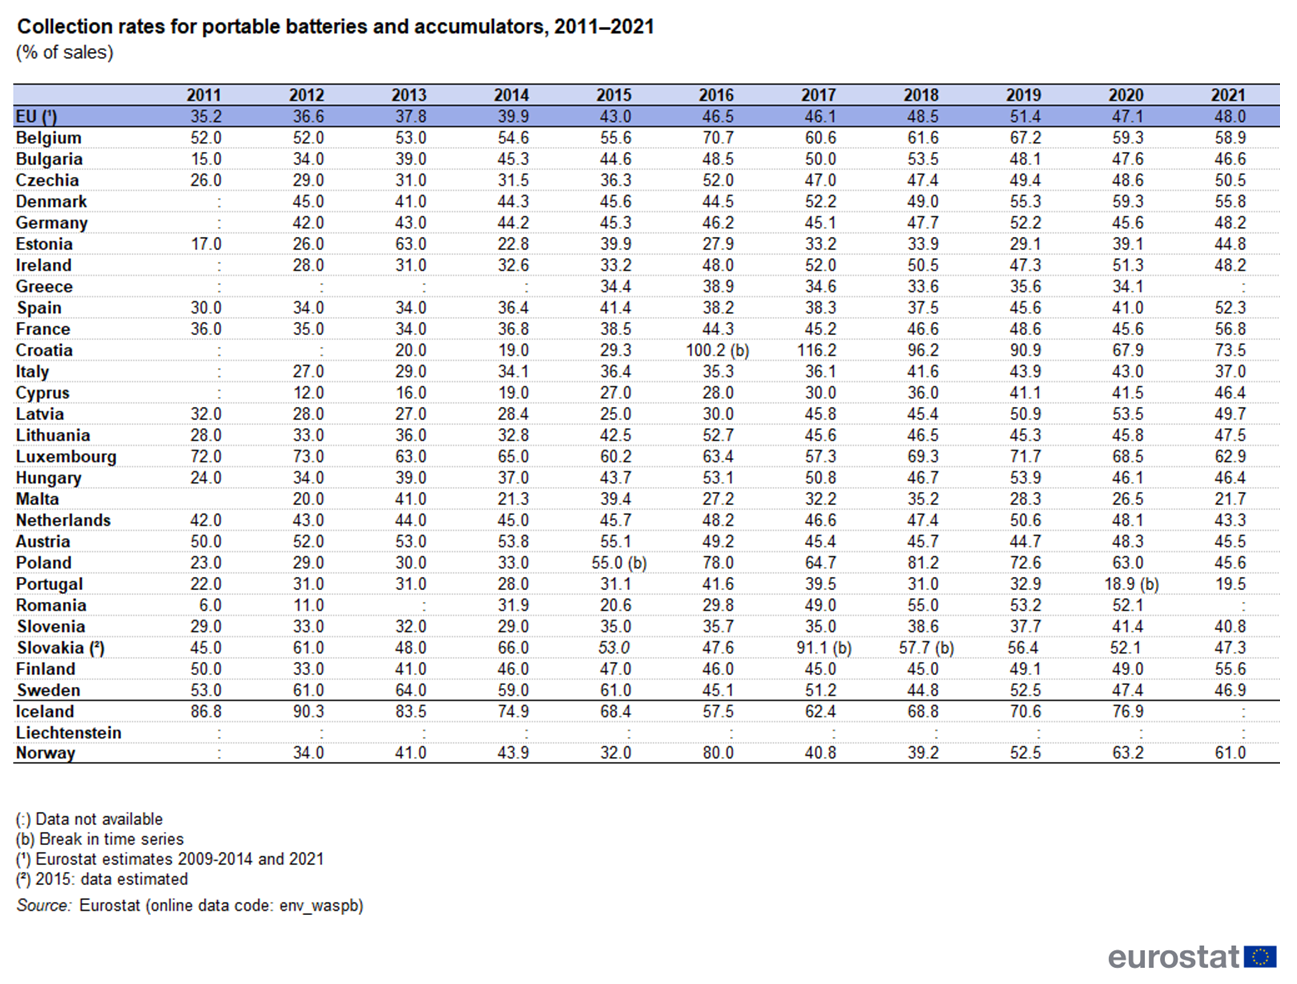
T2 Collection rates for portable batteries and accumulators, 2011–2021 (% of sales).png
(
file
)
512 KB
1
19:19, 30 November 2023
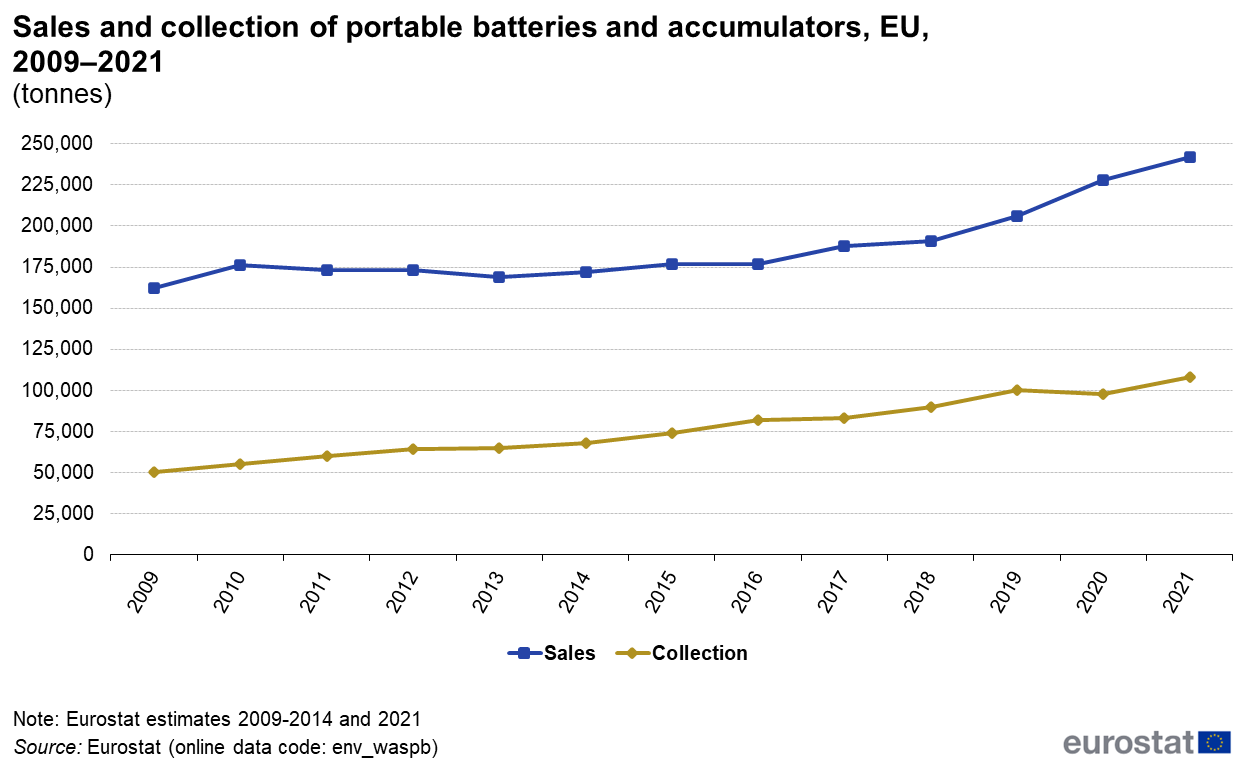
F1 Sales and collection of portable batteries and accumulators, EU, 2009–2021 (tonnes).png
(
file
)
49 KB
1
19:14, 30 November 2023
T1b Collection of portable batteries and accumulators, 2009–2021 (tonnes).png
(
file
)
70 KB
1
19:12, 30 November 2023
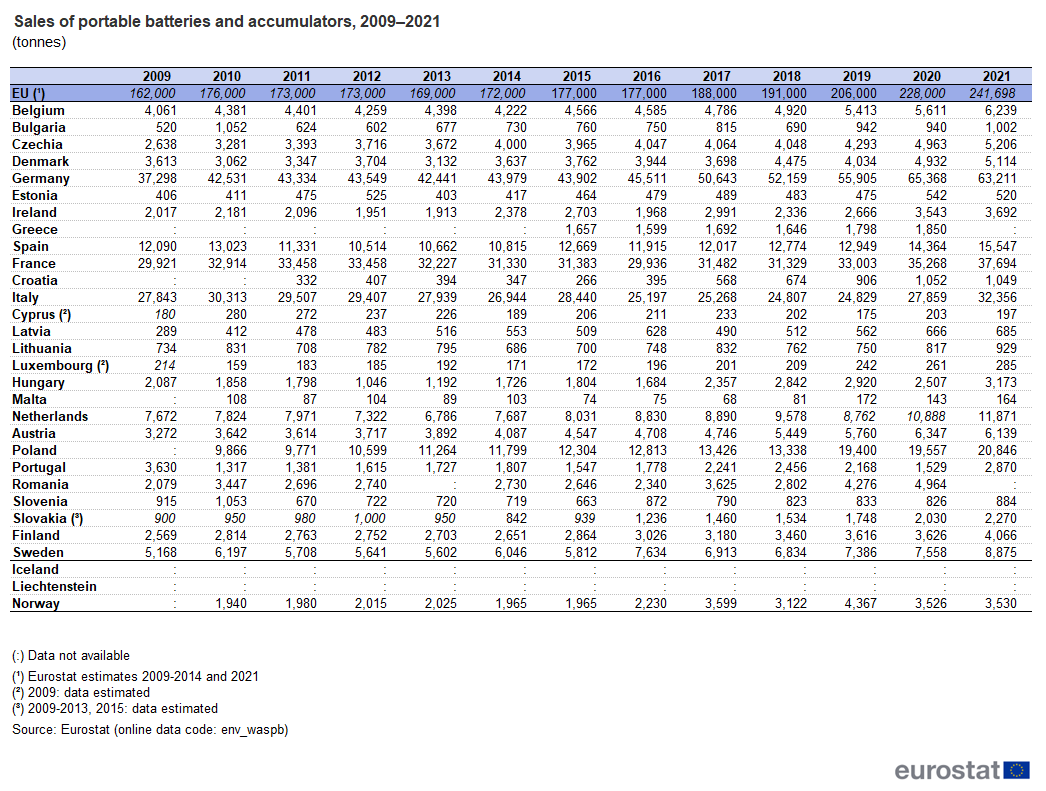
T1a Sales of portable batteries and accumulators, 2009–2021 (tonnes).png
(
file
)
73 KB
1
18:56, 30 November 2023
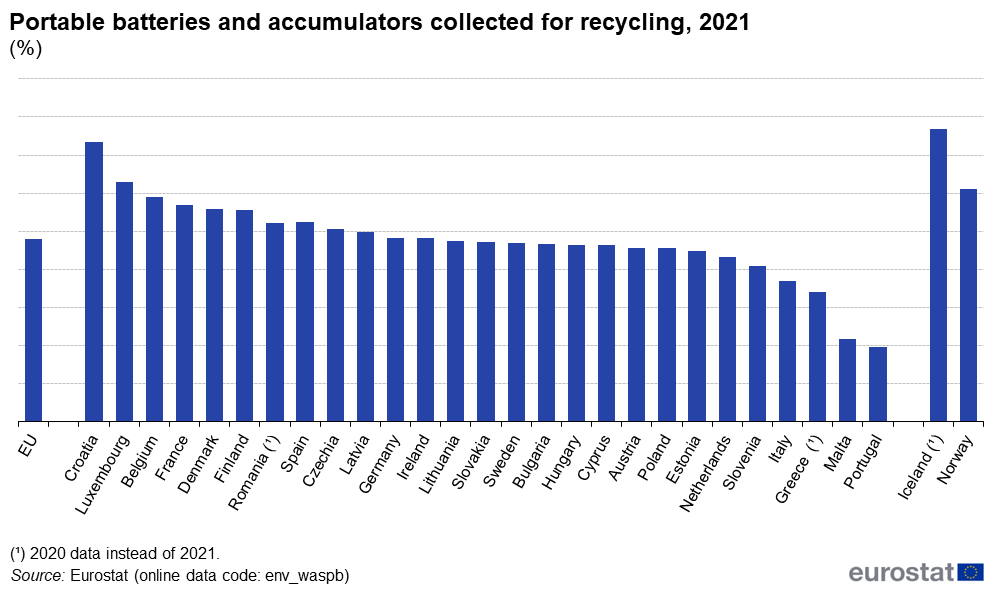
Portable batteries and accumulators collected for recycling, 2021 (%).png
(
file
)
57 KB
1
16:40, 20 November 2023
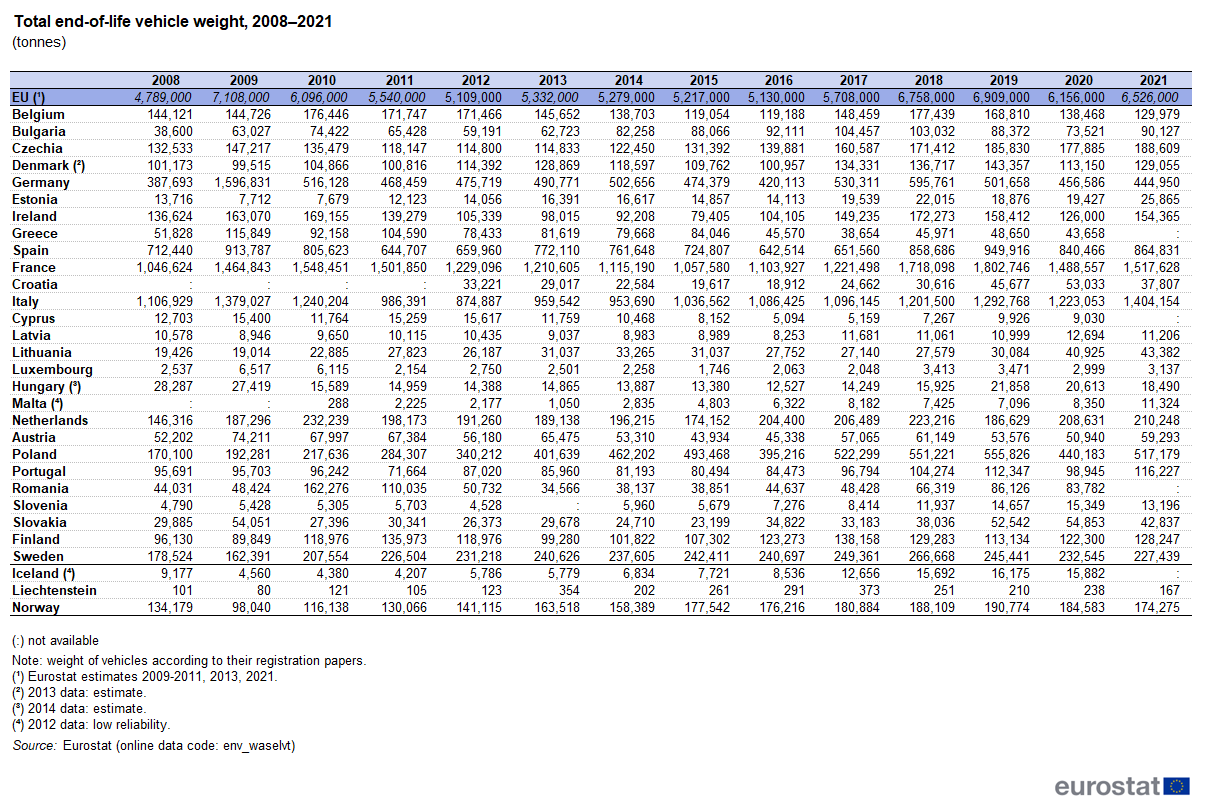
Total end-of-life vehicle weight, 2008–2021 (tonnes).png
(
file
)
99 KB
1
16:38, 20 November 2023
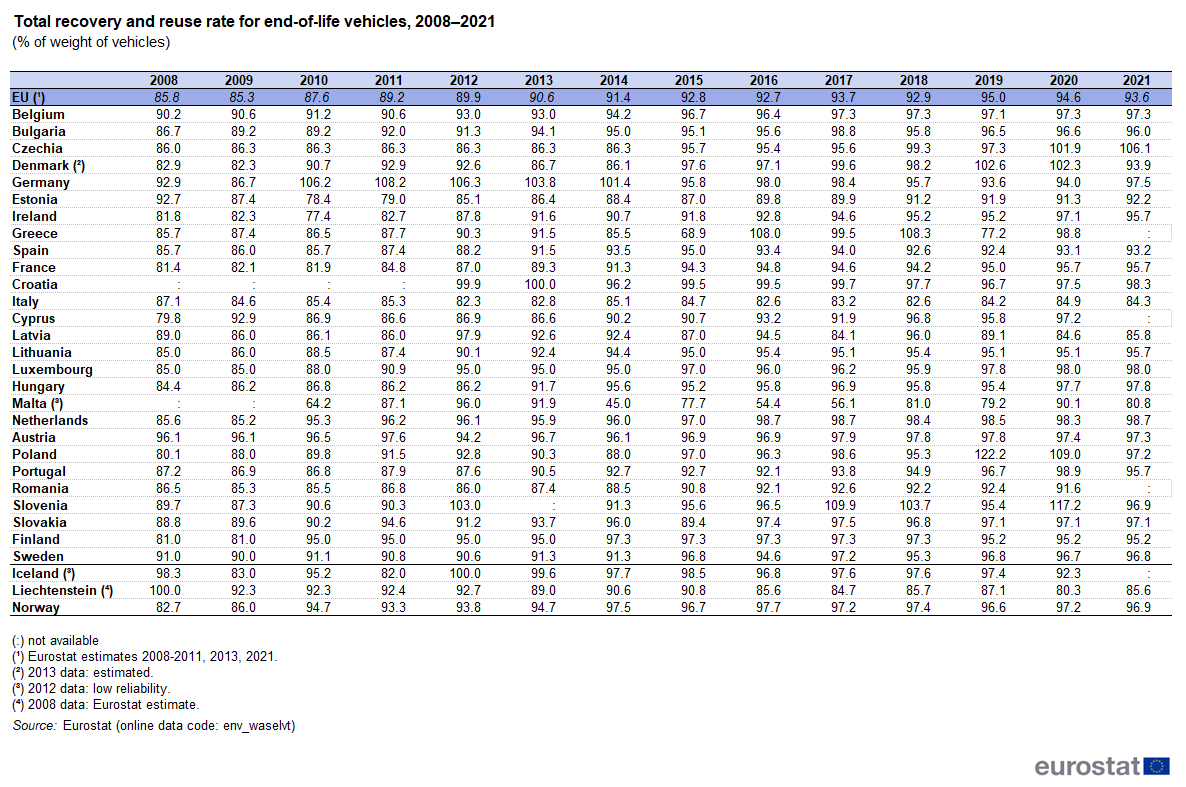
Total recovery and reuse rate for end-of-life vehicles, 2008–2021 (% of weight of vehicles).png
(
file
)
69 KB
1
First page
Previous page
Next page
Last page
Special page
ISSN 2443-8219
_new.png)
_new.png)
_new.png)
_new.png)
_new.png)
_new.png)
.png)
_.png)

.png)
_.png)
.png)
.png)
.png)
.png)
.png)
.png)
.png)
.png)
.png)
.png)
.png)
.png)
.png)
.png)
.png)
.png)
.png)
_.png)
.png)
.png)
.png)
.png)
.png)
.png)
.png)
.png)
.png)
.png)
.png)
.png)
.png)
.png)
.png)
.png)
.png)