Tutorials
Log in
Statistics Explained
menu
search
search
Navigation
Main page
Statistical themes
Glossary
Categories
Statistics 4 beginners
Tutorials
Help
Eurostat home
Education corner
Online publications
Regional yearbook
Sustainable development
Full list
Tools
User contributions
Logs
View user groups
Special pages
search
Navigation
Main page
Statistical themes
Glossary
Categories
Statistics 4 beginners
Tutorials
Help
Eurostat home
Education corner
Online publications
Regional yearbook
Sustainable development
Full list
Tools
User contributions
Logs
View user groups
Special pages
Navigation
Main page
Statistical themes
Glossary
Categories
Statistics 4 beginners
Tutorials
Help
Eurostat home
Education corner
Online publications
Regional yearbook
Sustainable development
Full list
Tools
User contributions
Logs
View user groups
Special pages
Uploads by Kaulama
This special page shows all uploaded files.
File list
Items per page:
20
50
100
250
500
Search for media name:
Username:
Include old versions of files
Go
First page
Previous page
Next page
Last page
Date
Name
Thumbnail
Size
Description
Versions
09:14, 5 March 2024
Fertility statistics YB2024 SE.xlsx
(
file
)
112 KB
1
09:06, 5 March 2024
Fig3 v4 Mean age of women at childbirth and at birth of first child, EU, 2001–2022.png
(
file
)
65 KB
1
09:06, 5 March 2024
Fig5 v4 Total fertility rate and the mean age of women at birth of first child, 2022.png
(
file
)
97 KB
1
09:06, 5 March 2024
Fertility statistics YB2024 SE.docx
(
file
)
112 KB
1
07:52, 5 March 2024
Fertility statistics YB2024 V5.xlsx
(
file
)
112 KB
1
07:50, 5 March 2024
Figure 7 Share of live births from foreign-born and native-born mothers, 2022 (%).png
(
file
)
137 KB
1
07:49, 5 March 2024
Fig5 v3 Total fertility rate and the mean age of women at birth of first child, 2022.png
(
file
)
97 KB
1
07:44, 5 March 2024
Table 1 (with footnotes and 2019) Total fertility rate, 1960–2022 (live births per woman).png
(
file
)
732 KB
1
07:42, 5 March 2024
Fig3 v3 Mean age of women at childbirth and at birth of first child, EU, 2001–2022.png
(
file
)
65 KB
1
07:34, 5 March 2024
Fig 2 v3 Total fertility rate, EU, 2001–2022 (live births per woman).png
(
file
)
54 KB
1
07:33, 5 March 2024
Map1 Total fertility rate, 2022.png
(
file
)
775 KB
1
13:00, 1 March 2024
Fig5 v2 Fertility indicators, 2022.png
(
file
)
95 KB
1
12:47, 1 March 2024
Europe-ch2022.png
(
file
)
674 KB
1
14:00, 28 February 2024
Total Fertility rate, 2022.png
(
file
)
673 KB
1
13:28, 28 February 2024
Map1 v2 Mean age of women at birth of first child 2022.png
(
file
)
680 KB
1
13:15, 28 February 2024
Fig7 v2 Share of live births from foreign-born and native-born mothers, 2022 (%).png
(
file
)
81 KB
1
13:14, 28 February 2024
Fig6 v2 Share of live births by birth order, 2022 (%).png
(
file
)
81 KB
1
13:14, 28 February 2024
Fig4 v2 Fertility rate by mother's age group, EU, 2001, 2011 and 2022.png
(
file
)
33 KB
1
13:14, 28 February 2024
Fig3 v2 Mean age of women at childbirth and at birth of first child, EU, 2001–2022.png
(
file
)
34 KB
1
13:14, 28 February 2024
Fig2 v2 Total fertility rate, EU, 2001–2022.png
(
file
)
27 KB
1
13:13, 28 February 2024
Fig1 v2 Number of live births, EU, 1961–2022 (million).png
(
file
)
30 KB
1
17:29, 27 February 2024
Fertility statistics YB2024.xlsx
(
file
)
120 KB
2
17:23, 27 February 2024
NewTable 1 Total fertility rate, 1960–2022 (live births per woman).png
(
file
)
330 KB
1
17:12, 27 February 2024
Table 1 Total fertility rate, 1960–2022 (live births per woman).png
(
file
)
329 KB
1
17:12, 27 February 2024
Figure 5 Fertility indicators, 2022.png
(
file
)
36 KB
1
22:19, 26 February 2024
Total fertility rate, 2022.png
(
file
)
695 KB
1
21:46, 26 February 2024
Mean age of women at birth of first child 2022.png
(
file
)
445 KB
1
21:46, 26 February 2024
Total fertility rate, 1960–2022 (live births per woman).png
(
file
)
329 KB
1
21:46, 26 February 2024
Share of live births from foreign-born and native-born mothers, 2022 (%).png
(
file
)
85 KB
1
21:45, 26 February 2024
Share of live births by birth order, 2022 (%).png
(
file
)
89 KB
1
21:45, 26 February 2024
Fertility indicators, 2022.png
(
file
)
100 KB
1
21:44, 26 February 2024
Fertility rate by mother's age group, EU, 2001, 2011 and 2022.png
(
file
)
63 KB
1
21:44, 26 February 2024
Mean age of women at childbirth and at birth of first child, EU, 2001–2022.png
(
file
)
54 KB
1
21:32, 26 February 2024
Figure 2 Total fertility rate, EU, 2001–2022.png
(
file
)
51 KB
1
21:30, 26 February 2024
Figure 1 Number of live births, EU, 1961–2022 (million).png
(
file
)
47 KB
null
1
20:17, 11 March 2021
DEMO MEXRT Mar11 2021.xlsx
(
file
)
14 KB
1
20:00, 11 March 2021
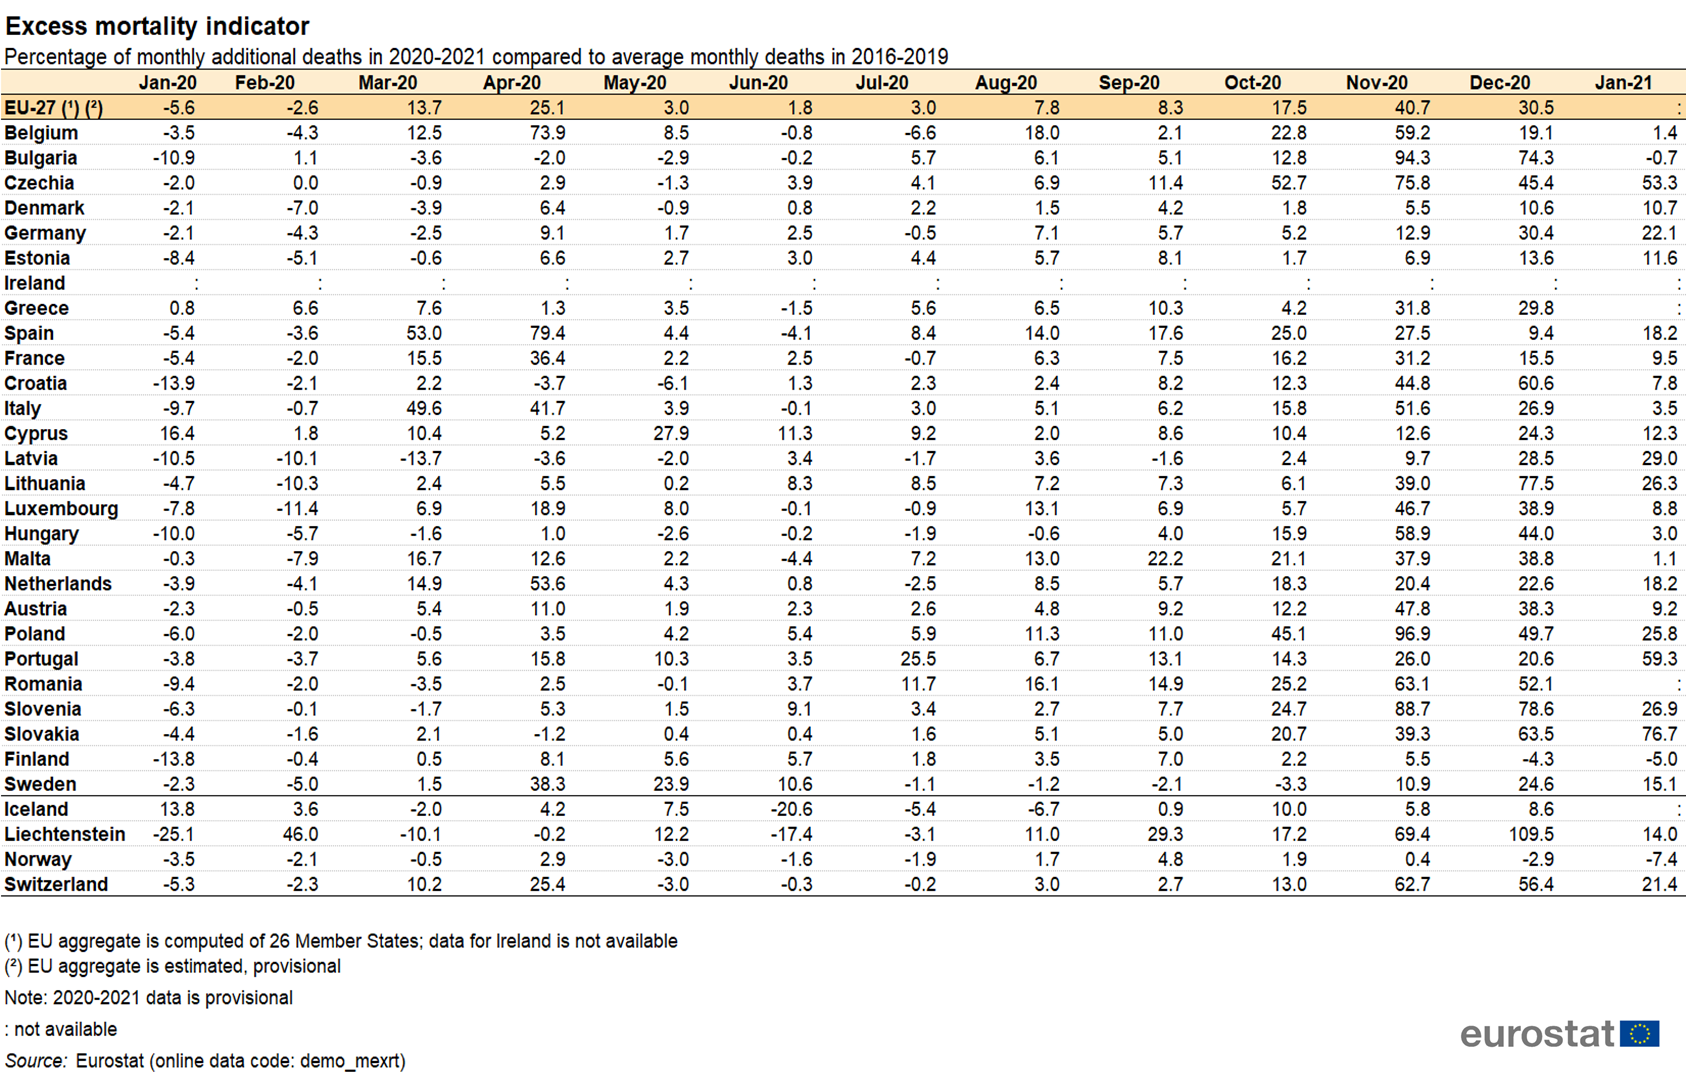
Table 1 Excess mortality indicator Mar2021.png
(
file
)
690 KB
1
20:00, 11 March 2021
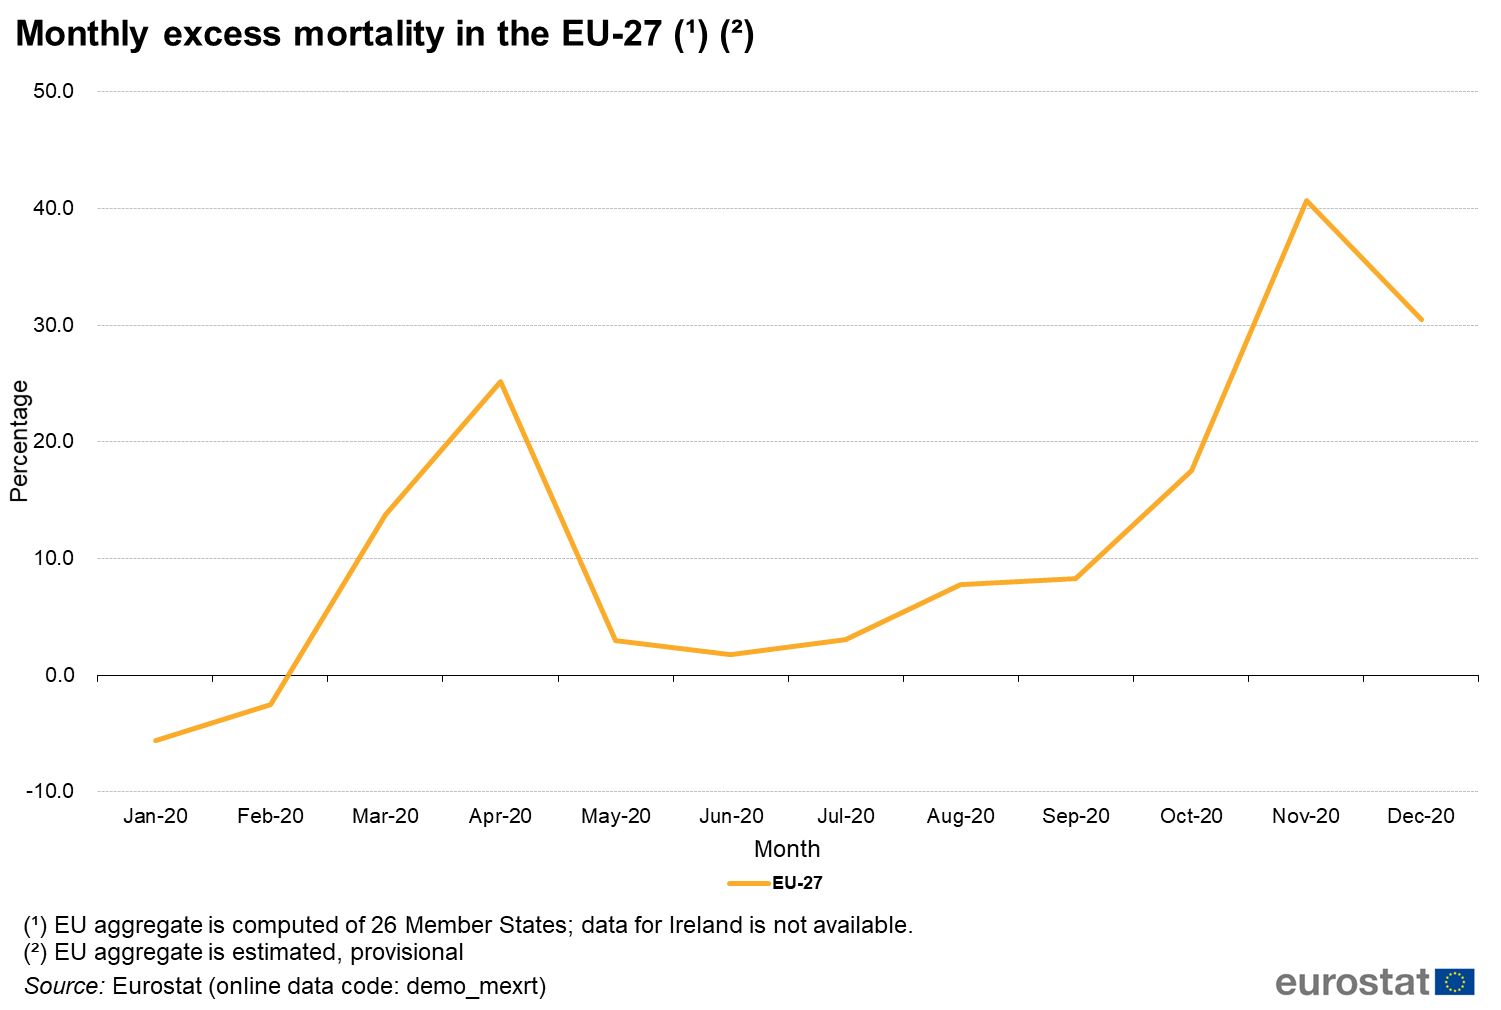
Figure 1 Monthly excess mortality Mar2021.png
(
file
)
80 KB
1
13:10, 12 February 2021
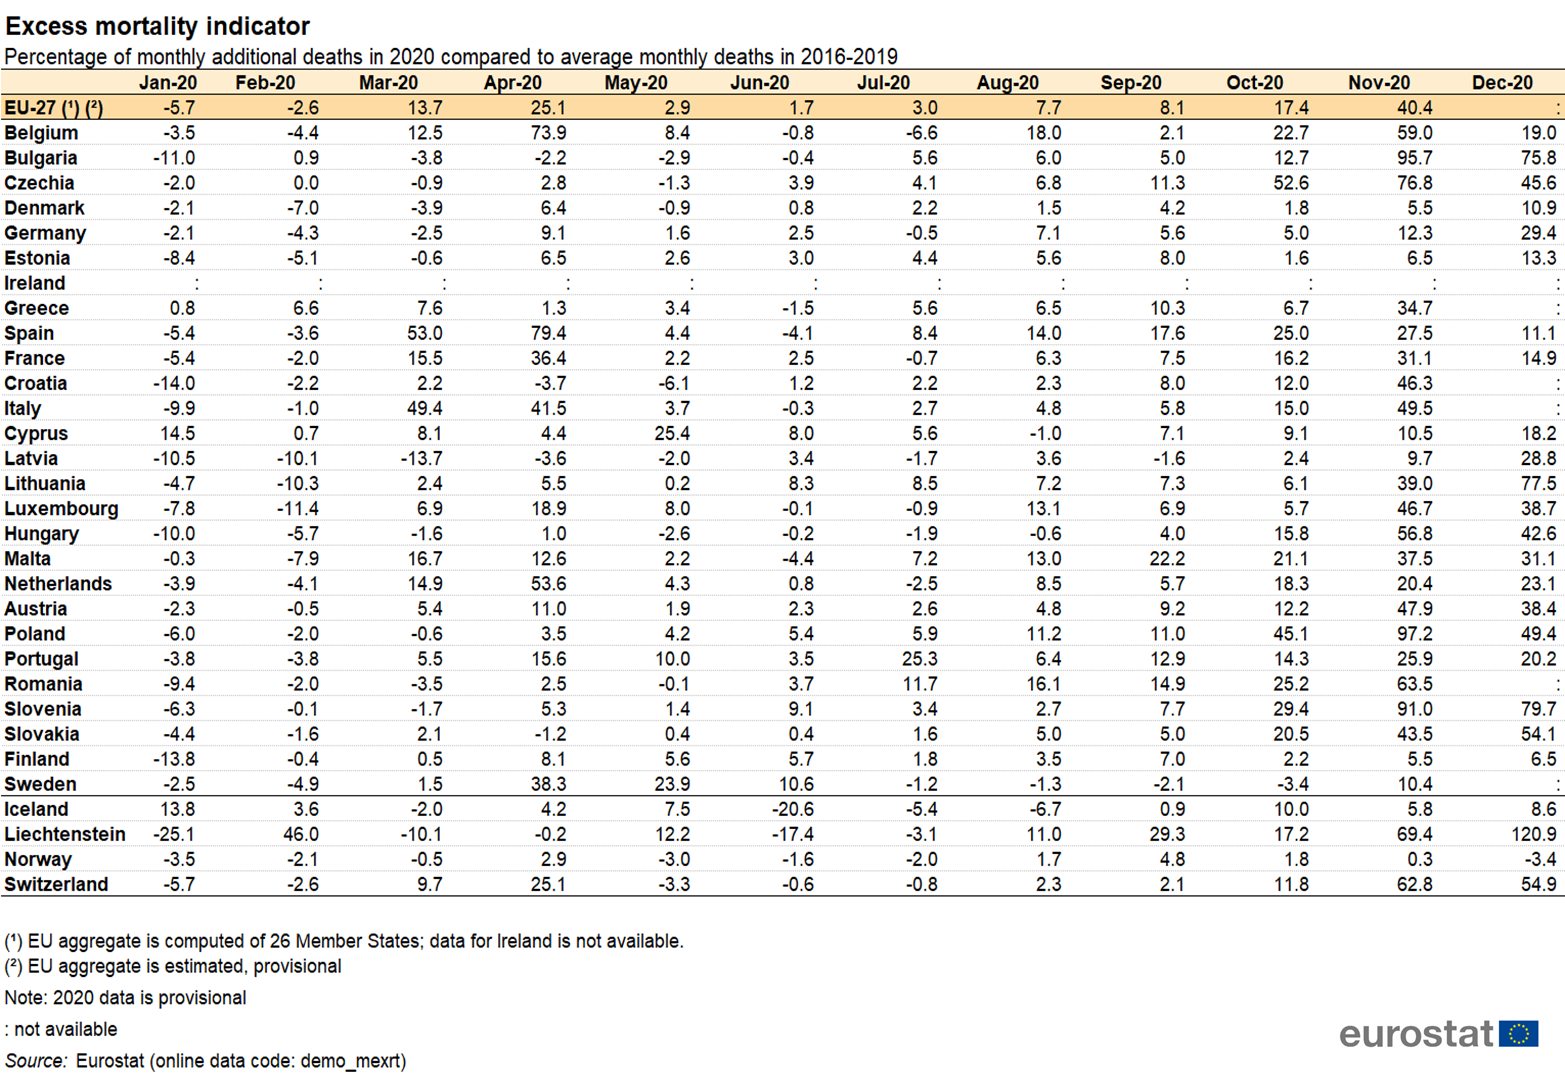
Table 1 Excess mortality indicator 12Feb.png
(
file
)
644 KB
1
13:10, 12 February 2021
Figure 1 Monthly excess mortality in the EU-27 12Feb.png
(
file
)
76 KB
1
13:10, 12 February 2021
DEMO MEXRT 11 Feb.xlsx
(
file
)
13 KB
1
18:34, 4 February 2021
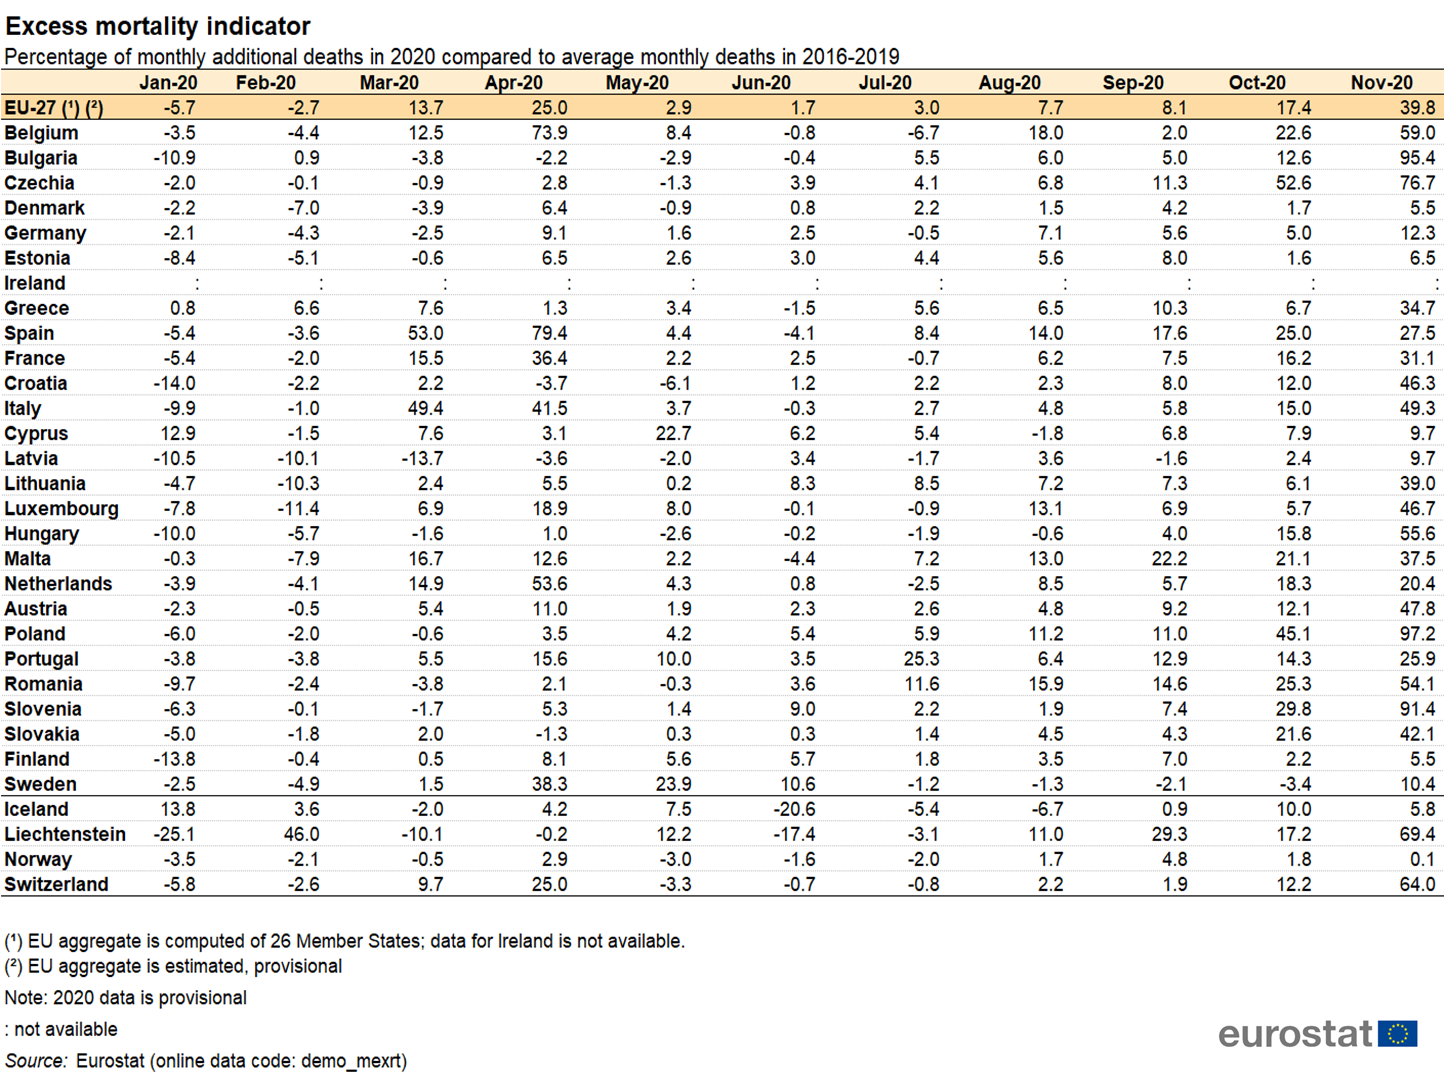
Table 1 Excess mortality indicator Feb04.png
(
file
)
582 KB
1
18:34, 4 February 2021
DEMO MEXRT Feb04.xlsx
(
file
)
13 KB
1
18:34, 4 February 2021
Figure 1 Monthly excess mortality in the EU-27 Feb04.png
(
file
)
77 KB
1
20:35, 21 January 2021
Table 1 full Weekly deaths 2020 Jan update.xlsx
(
file
)
32 KB
1
20:33, 21 January 2021
Table 1 Weekly deaths 202001.png
(
file
)
892 KB
1
20:33, 21 January 2021
Figure 2 Weekly deaths 202101.png
(
file
)
129 KB
1
20:33, 21 January 2021
Figure 1 Weekly deaths 202101.png
(
file
)
80 KB
1
20:33, 21 January 2021
Table 1 full Weekly deaths 2020.xlsx
(
file
)
32 KB
2
20:33, 21 January 2021
Figure 4 Weekly deaths 202101.png
(
file
)
53 KB
1
First page
Previous page
Next page
Last page
Special page
ISSN 2443-8219


.png)

_Total_fertility_rate,_1960%E2%80%932022_(live_births_per_woman).png)

.png)


.png)
.png)


.png)
.png)
.png)


.png)
.png)
.png)


.png)


