Tutorials
Log in
Statistics Explained
menu
search
search
Navigation
Main page
Statistical themes
Glossary
Categories
Statistics 4 beginners
Tutorials
Help
Eurostat home
Education corner
Online publications
Regional yearbook
Sustainable development
Full list
Tools
User contributions
Logs
View user groups
Special pages
search
Navigation
Main page
Statistical themes
Glossary
Categories
Statistics 4 beginners
Tutorials
Help
Eurostat home
Education corner
Online publications
Regional yearbook
Sustainable development
Full list
Tools
User contributions
Logs
View user groups
Special pages
Navigation
Main page
Statistical themes
Glossary
Categories
Statistics 4 beginners
Tutorials
Help
Eurostat home
Education corner
Online publications
Regional yearbook
Sustainable development
Full list
Tools
User contributions
Logs
View user groups
Special pages
Uploads by ChristianeG
This special page shows all uploaded files.
File list
Items per page:
20
50
100
250
500
Search for media name:
Username:
Include old versions of files
Go
First page
Previous page
Next page
Last page
Date
Name
Thumbnail
Size
Description
Versions
08:34, 26 September 2017
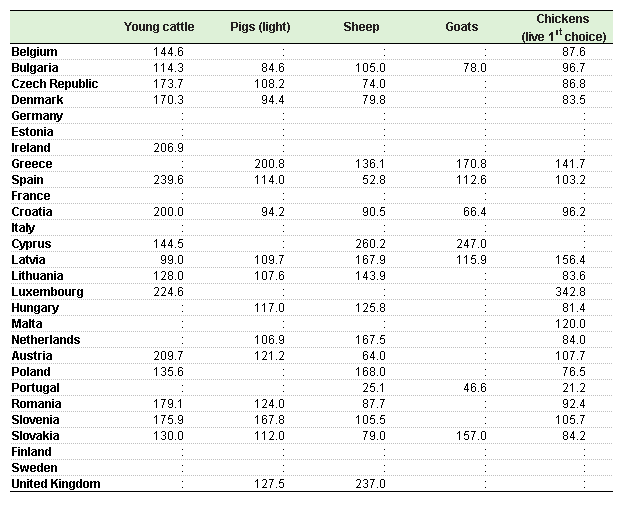
Selling prices of animal products, 2016.png
(
file
)
16 KB
3
08:34, 26 September 2017
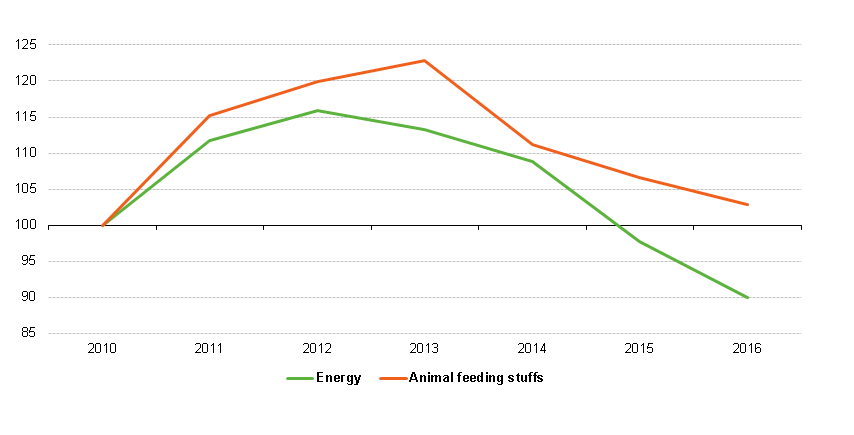
Deflated price indices for energy and animal feeding stuffs, EU-28, 2010-2016.png
(
file
)
12 KB
1
08:33, 26 September 2017
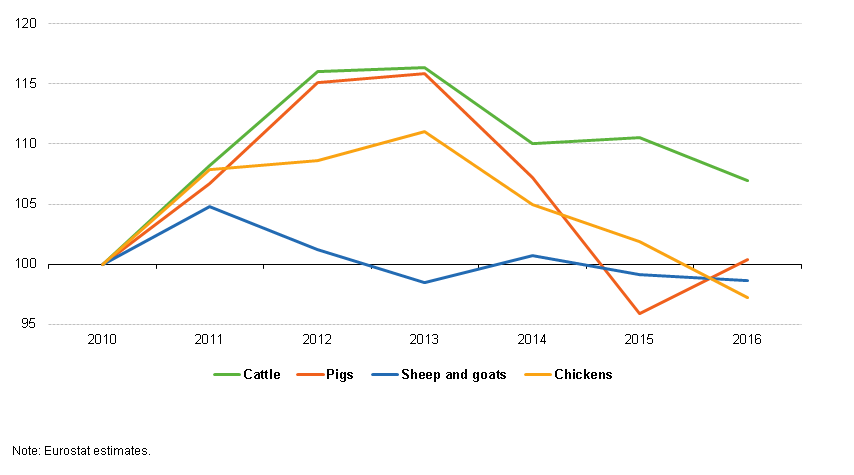
Deflated price indices for selected animal outputs, EU-28, 2010–2016.png
(
file
)
20 KB
4
08:32, 26 September 2017
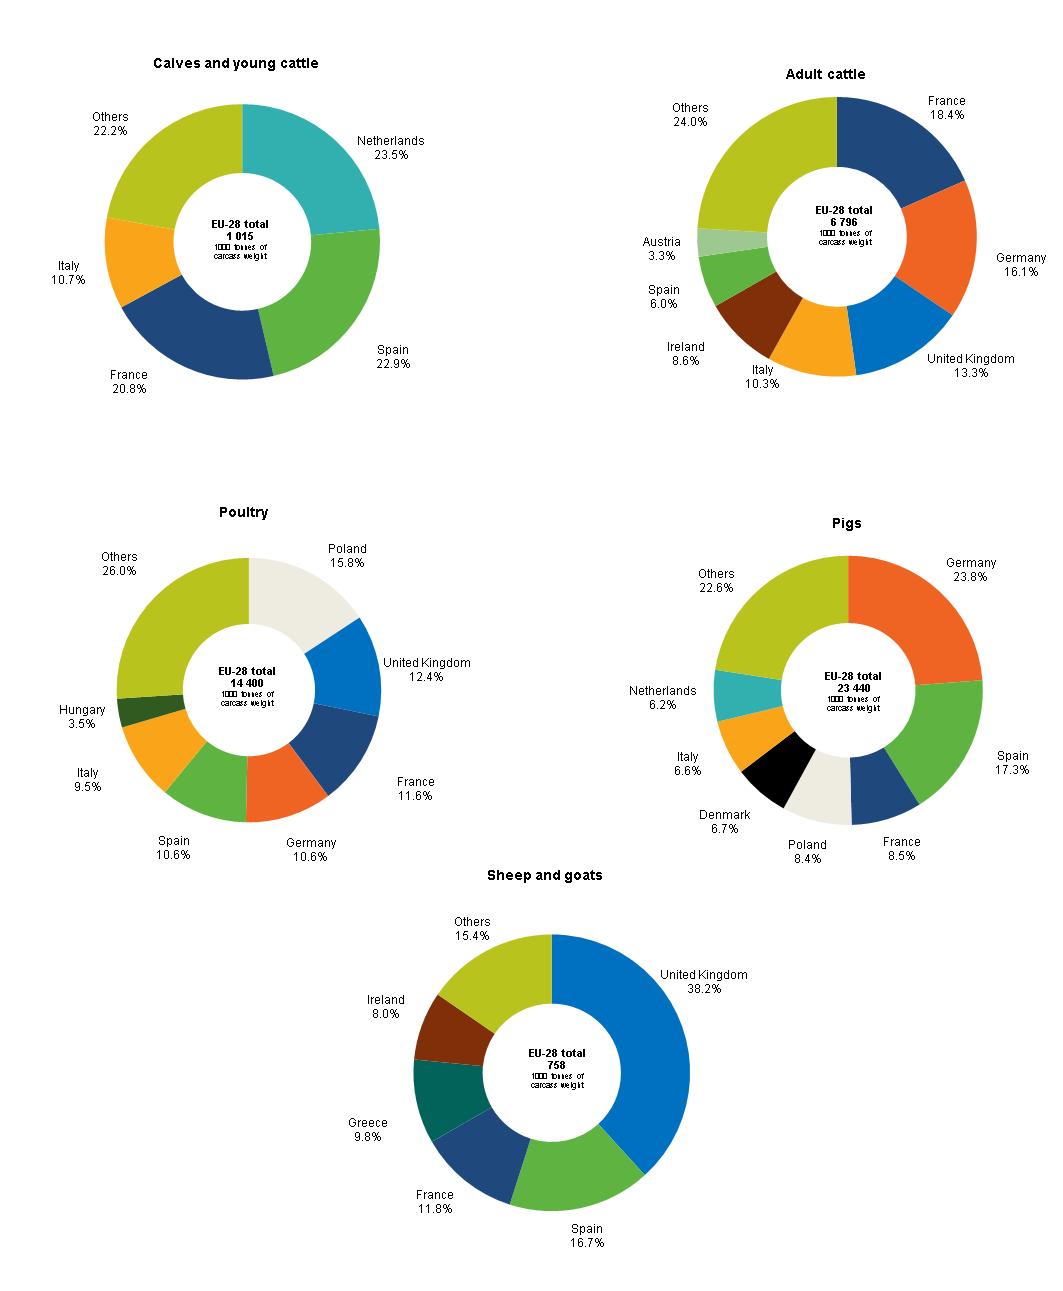
Production of meat, 2016.png
(
file
)
65 KB
4
08:30, 26 September 2017
Production of meat, EU-28, 2010–2016.png
(
file
)
16 KB
1
08:30, 26 September 2017
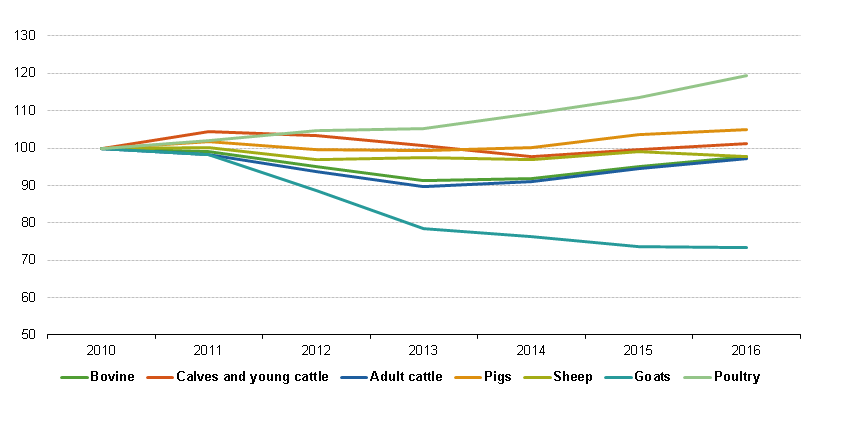
Llivestock population, EU-28, 2010-2016.png
(
file
)
23 KB
1
07:35, 21 September 2017
Production of meat, EU-28, 2005–2016.png
(
file
)
22 KB
2
07:34, 1 September 2017
Forests forestry and logging statistics.xlsx
(
file
)
105 KB
4
08:06, 31 August 2017
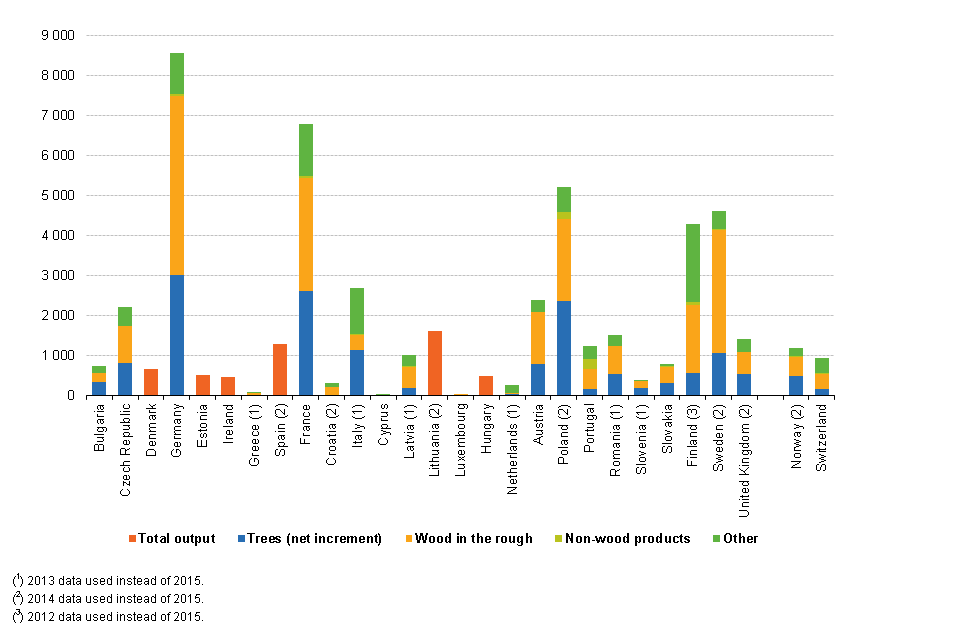
Supply and use of products within forestry, 2015.png
(
file
)
23 KB
3
11:45, 28 August 2017
Wood products - production and trade with 2016.xlsx
(
file
)
142 KB
1
11:55, 11 August 2017
Wood products - production and trade.xlsx
(
file
)
138 KB
5
11:55, 11 August 2017
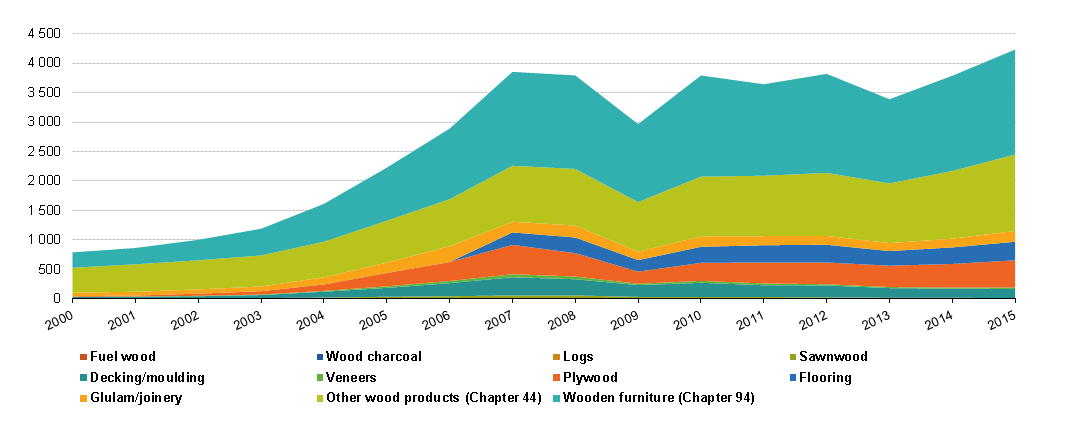
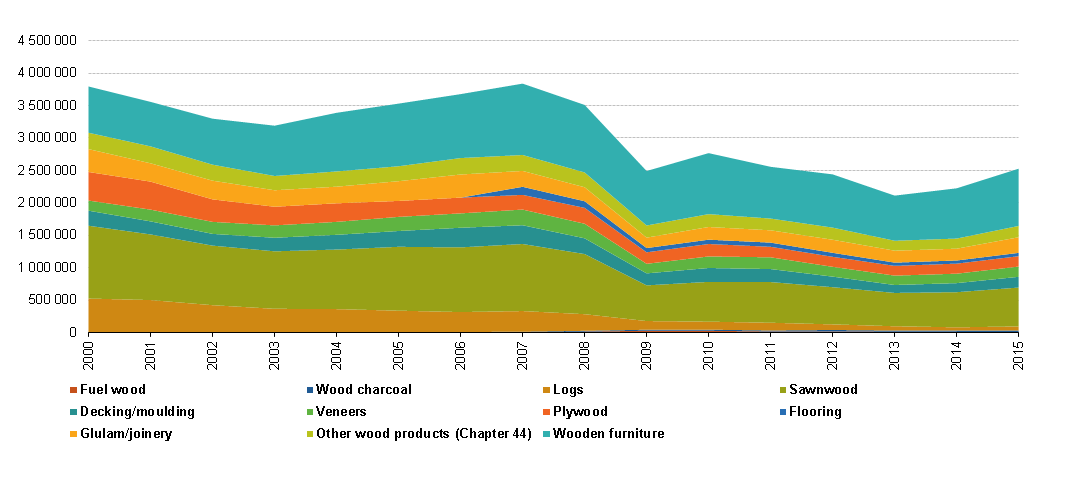
Wood products imported to the EU-28 from countries other than China or tropical countries, 2000-2015.png
(
file
)
36 KB
2
11:55, 11 August 2017
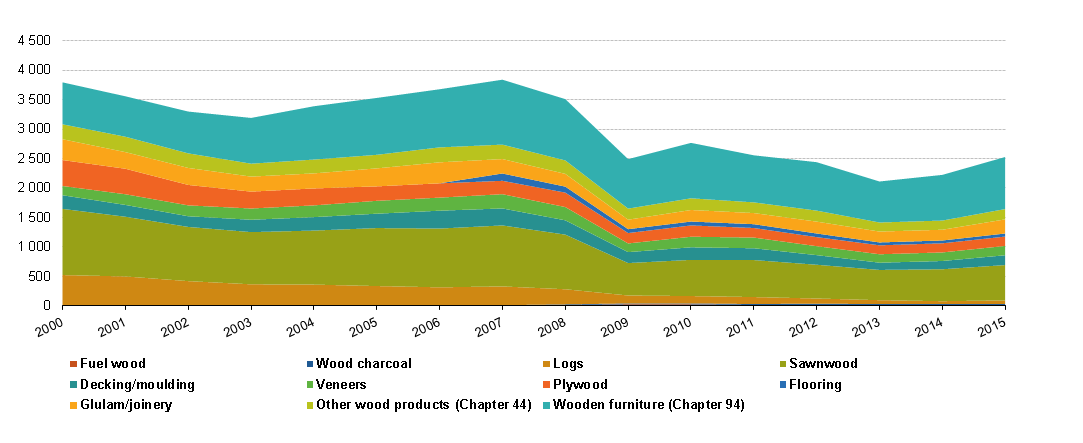
Wood products imported to the EU-28 from FLEGT countries, 2000-2015.png
(
file
)
30 KB
2
11:54, 11 August 2017
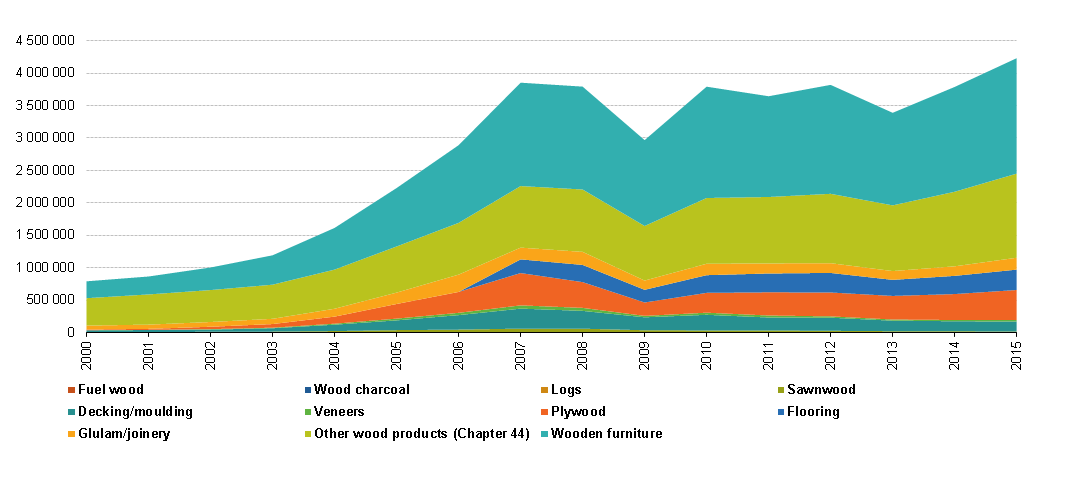
Wood products imported to the EU-28 from China, 2000-2015.png
(
file
)
26 KB
2
11:53, 11 August 2017
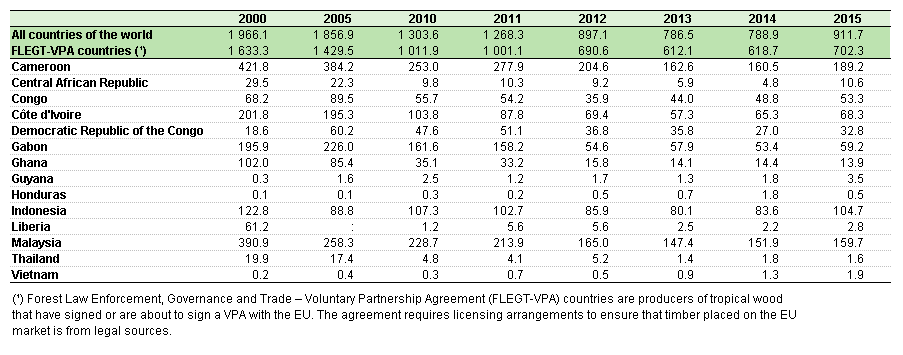
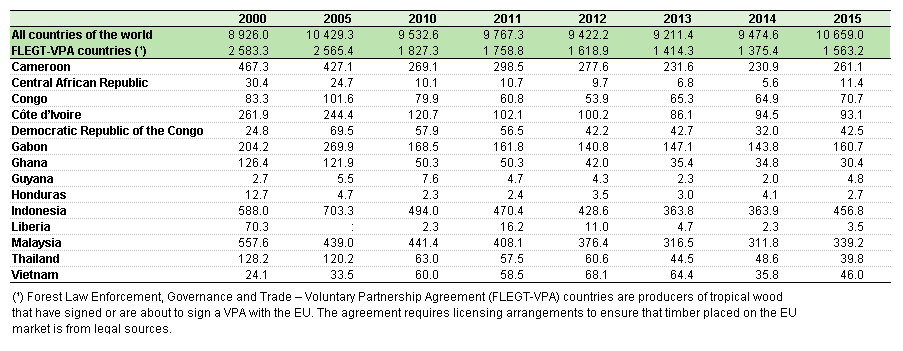
FLEGT countries' share in total wood imports to the EU-28, 2000–2015.png
(
file
)
24 KB
4
11:53, 11 August 2017
FLEGT countries' share in tropical wood imports to the EU-28, 2000–2015.png
(
file
)
21 KB
4
11:53, 11 August 2017
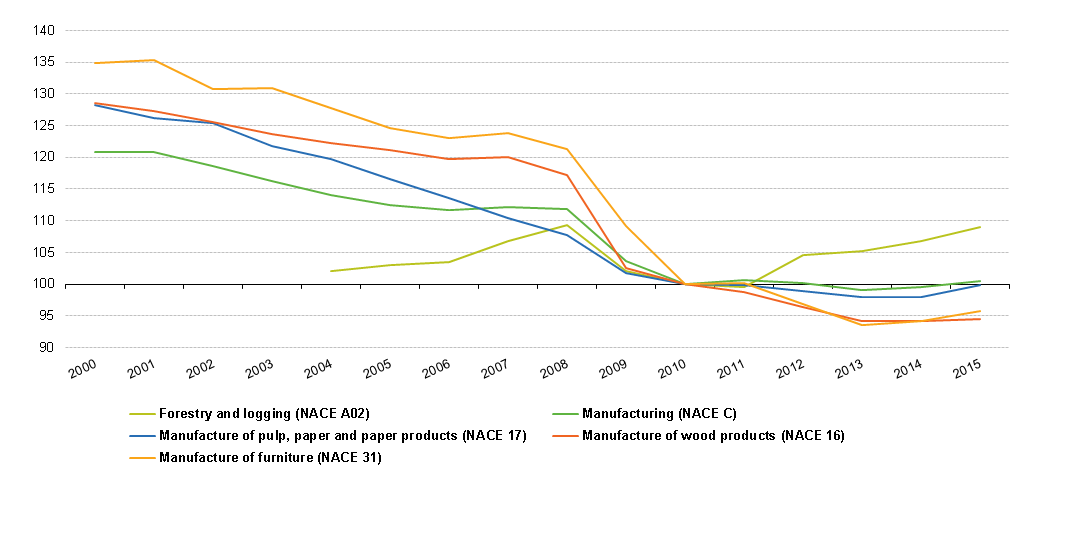
Employment in wood-based industries compared with total manufacturing, EU-28, 2000–2015.png
(
file
)
33 KB
2
07:47, 11 August 2017
Wood energy update 2017.xlsx
(
file
)
83 KB
4
07:29, 11 August 2017
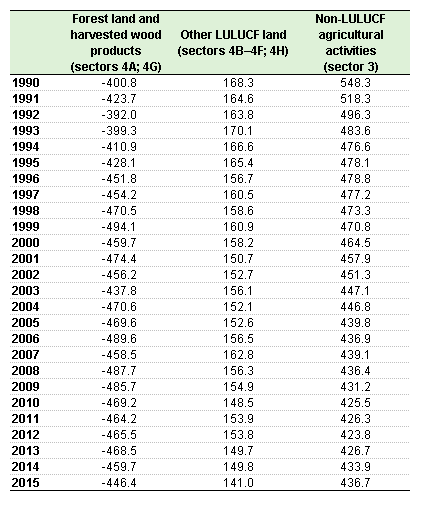
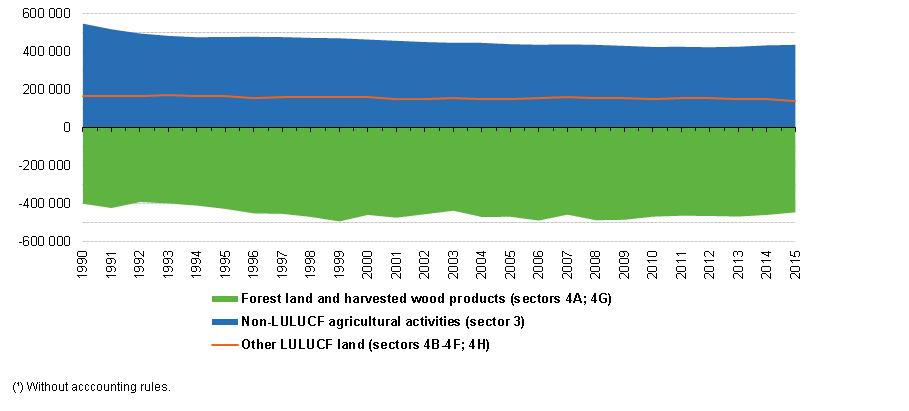
Greenhouse gas emissions and removals by LULUCF and agricultural source sectors, EU-28, 1990–2015.png
(
file
)
15 KB
2
09:27, 10 August 2017
Forestry and climate change.xlsx
(
file
)
64 KB
3
09:27, 10 August 2017
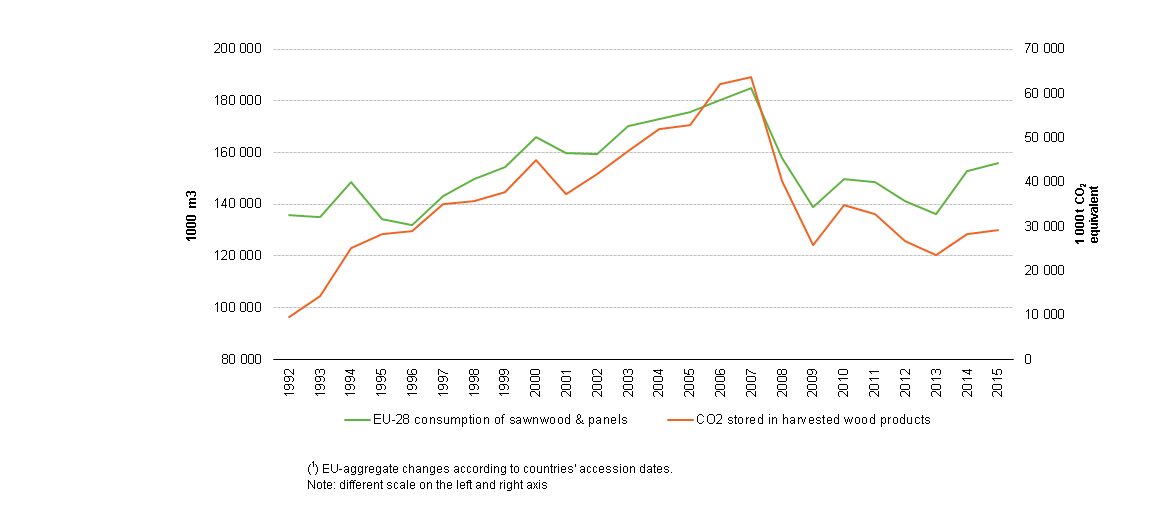
EU consumption (1) of wood products and storage of CO2, 1992–2015.png
(
file
)
23 KB
2
09:27, 10 August 2017
Greenhouse gas emissions and removals by LULUCF and agricultural source sectors (¹), EU-28, 1990–2015.png
(
file
)
13 KB
2
08:32, 10 August 2017
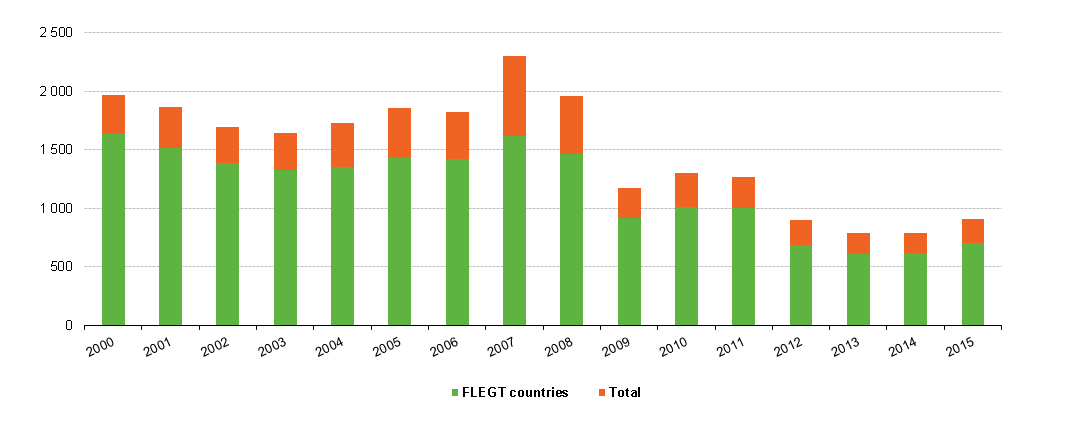
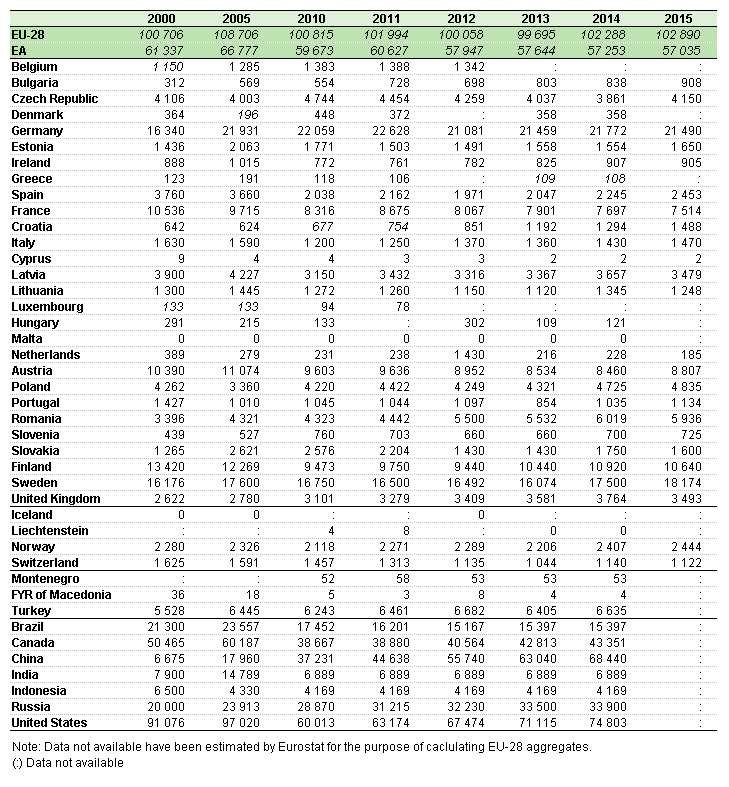
Tropical wood imports, EU-28, 2000–2015.png
(
file
)
20 KB
3
08:32, 10 August 2017
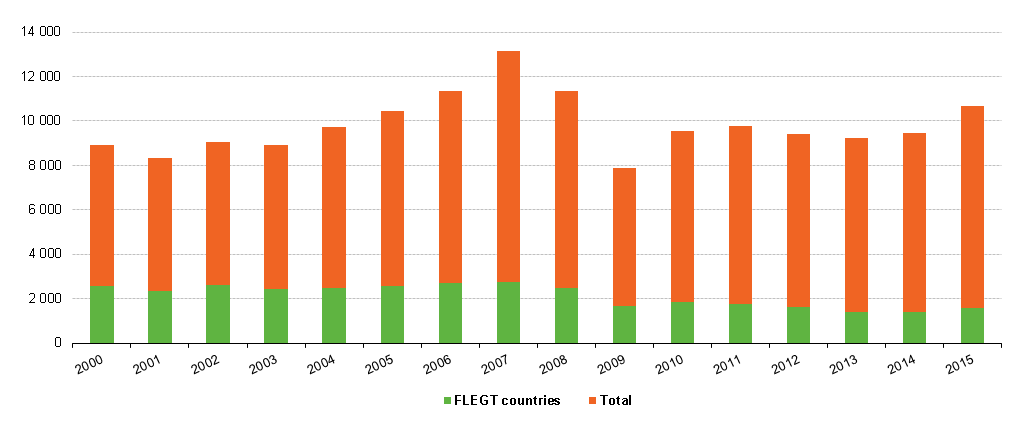
Total wood imports to the EU and the share of FLEGT countries, EU-28, 2000–2015.png
(
file
)
21 KB
3
08:32, 10 August 2017
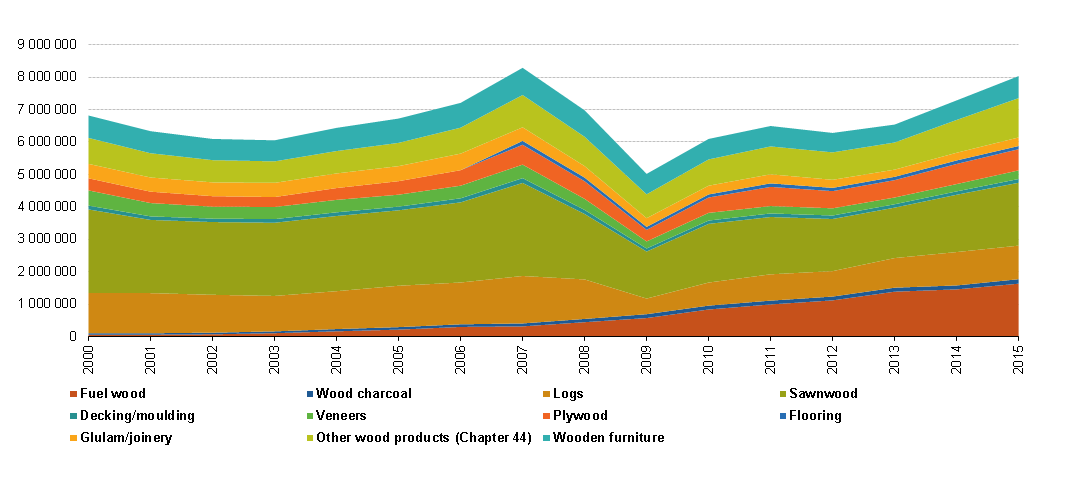
Sawnwood production, 2000-2015.png
(
file
)
40 KB
2
08:31, 10 August 2017
Wood imports from world minus EU-28, China and non-FLEGT tropical countries (combined) by products, 2000-2015.png
(
file
)
34 KB
1
08:30, 10 August 2017
Wood imports from FLEGT tropical countries by products, 2000-2015.png
(
file
)
28 KB
1
08:30, 10 August 2017
Wood imports from China by products, 2000-2015.png
(
file
)
24 KB
1
07:25, 10 August 2017
Gross inland consumption of renewable energy, EU-28, 2005 and 2015.png
(
file
)
33 KB
1
12:16, 27 July 2017
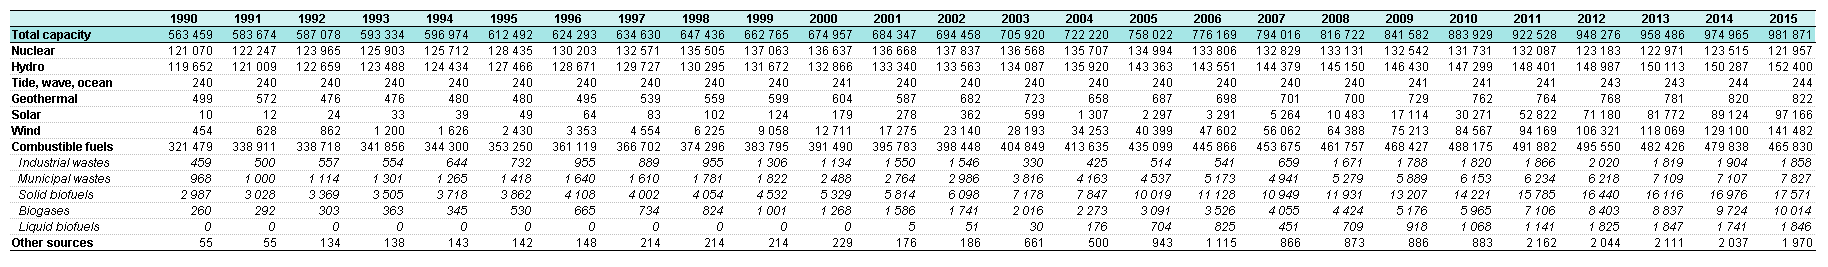
Maximum electrical capacity, MW, EU-28, 1990-2015 T2.png
(
file
)
38 KB
1
12:16, 27 July 2017
Electricity-and-heat-statistics.xlsx
(
file
)
250 KB
4
11:30, 24 July 2017
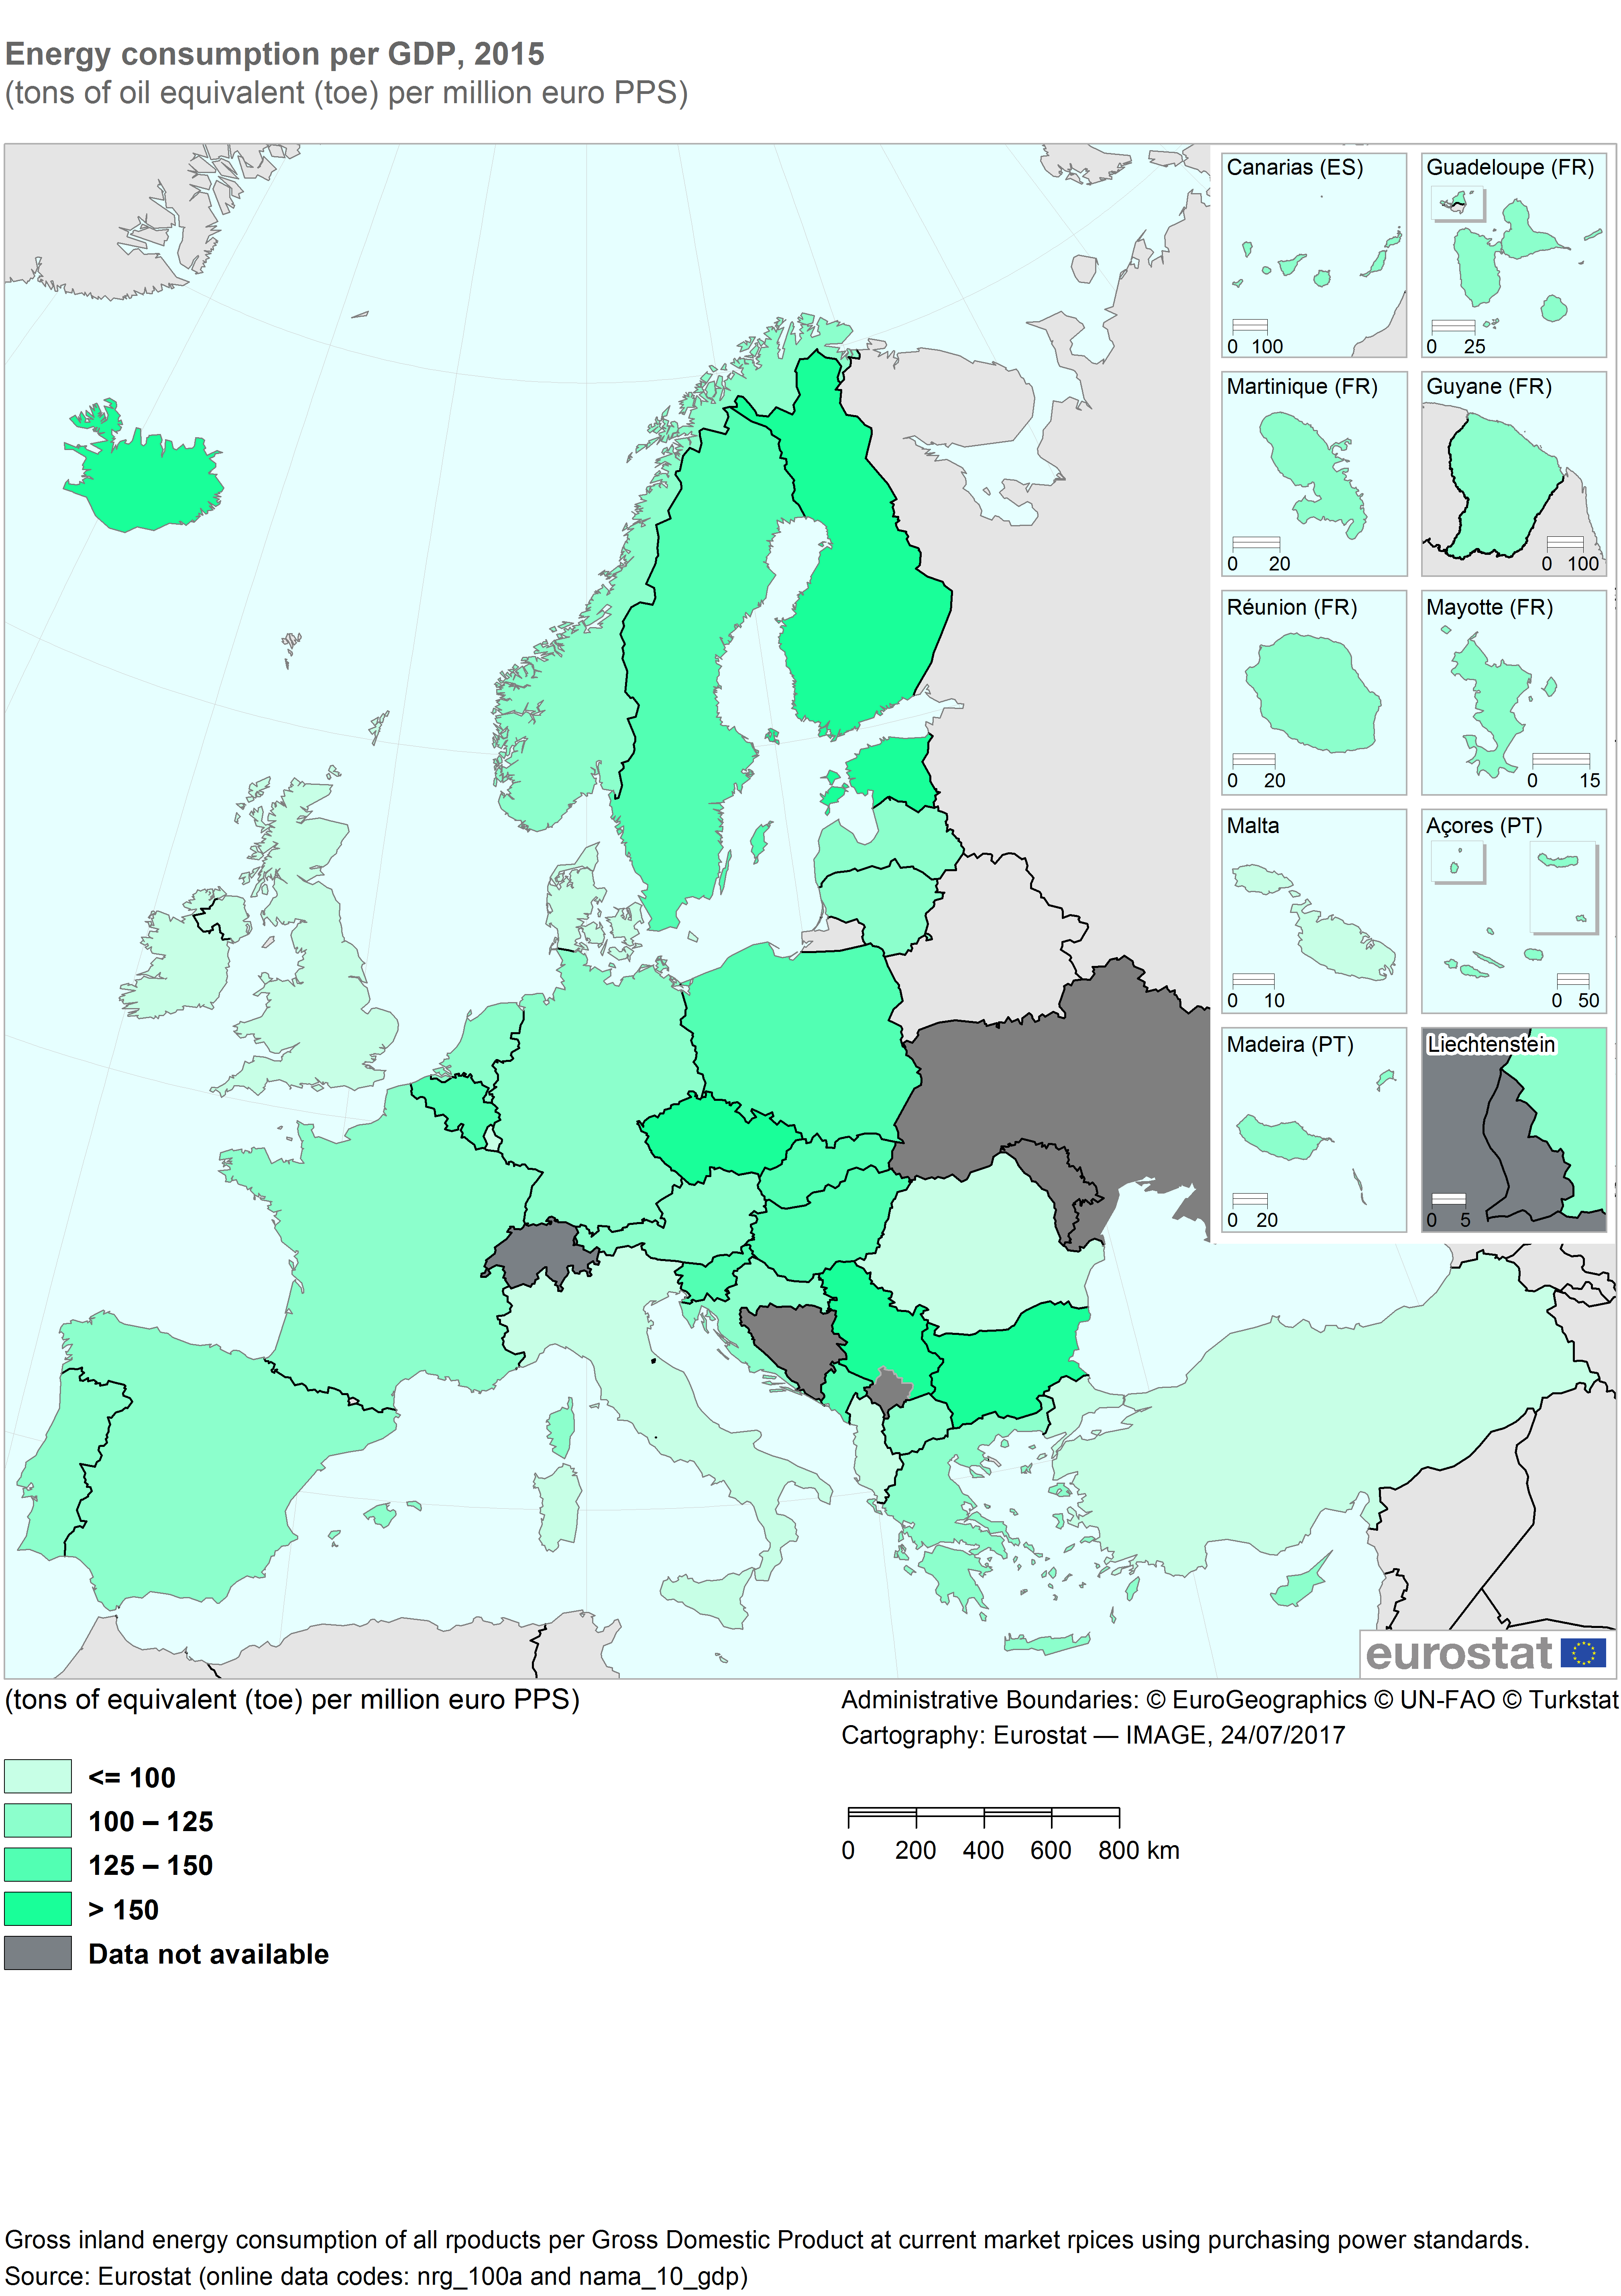
Map2 Energy consumption per GDP, 2015.png
(
file
)
489 KB
1
11:30, 24 July 2017
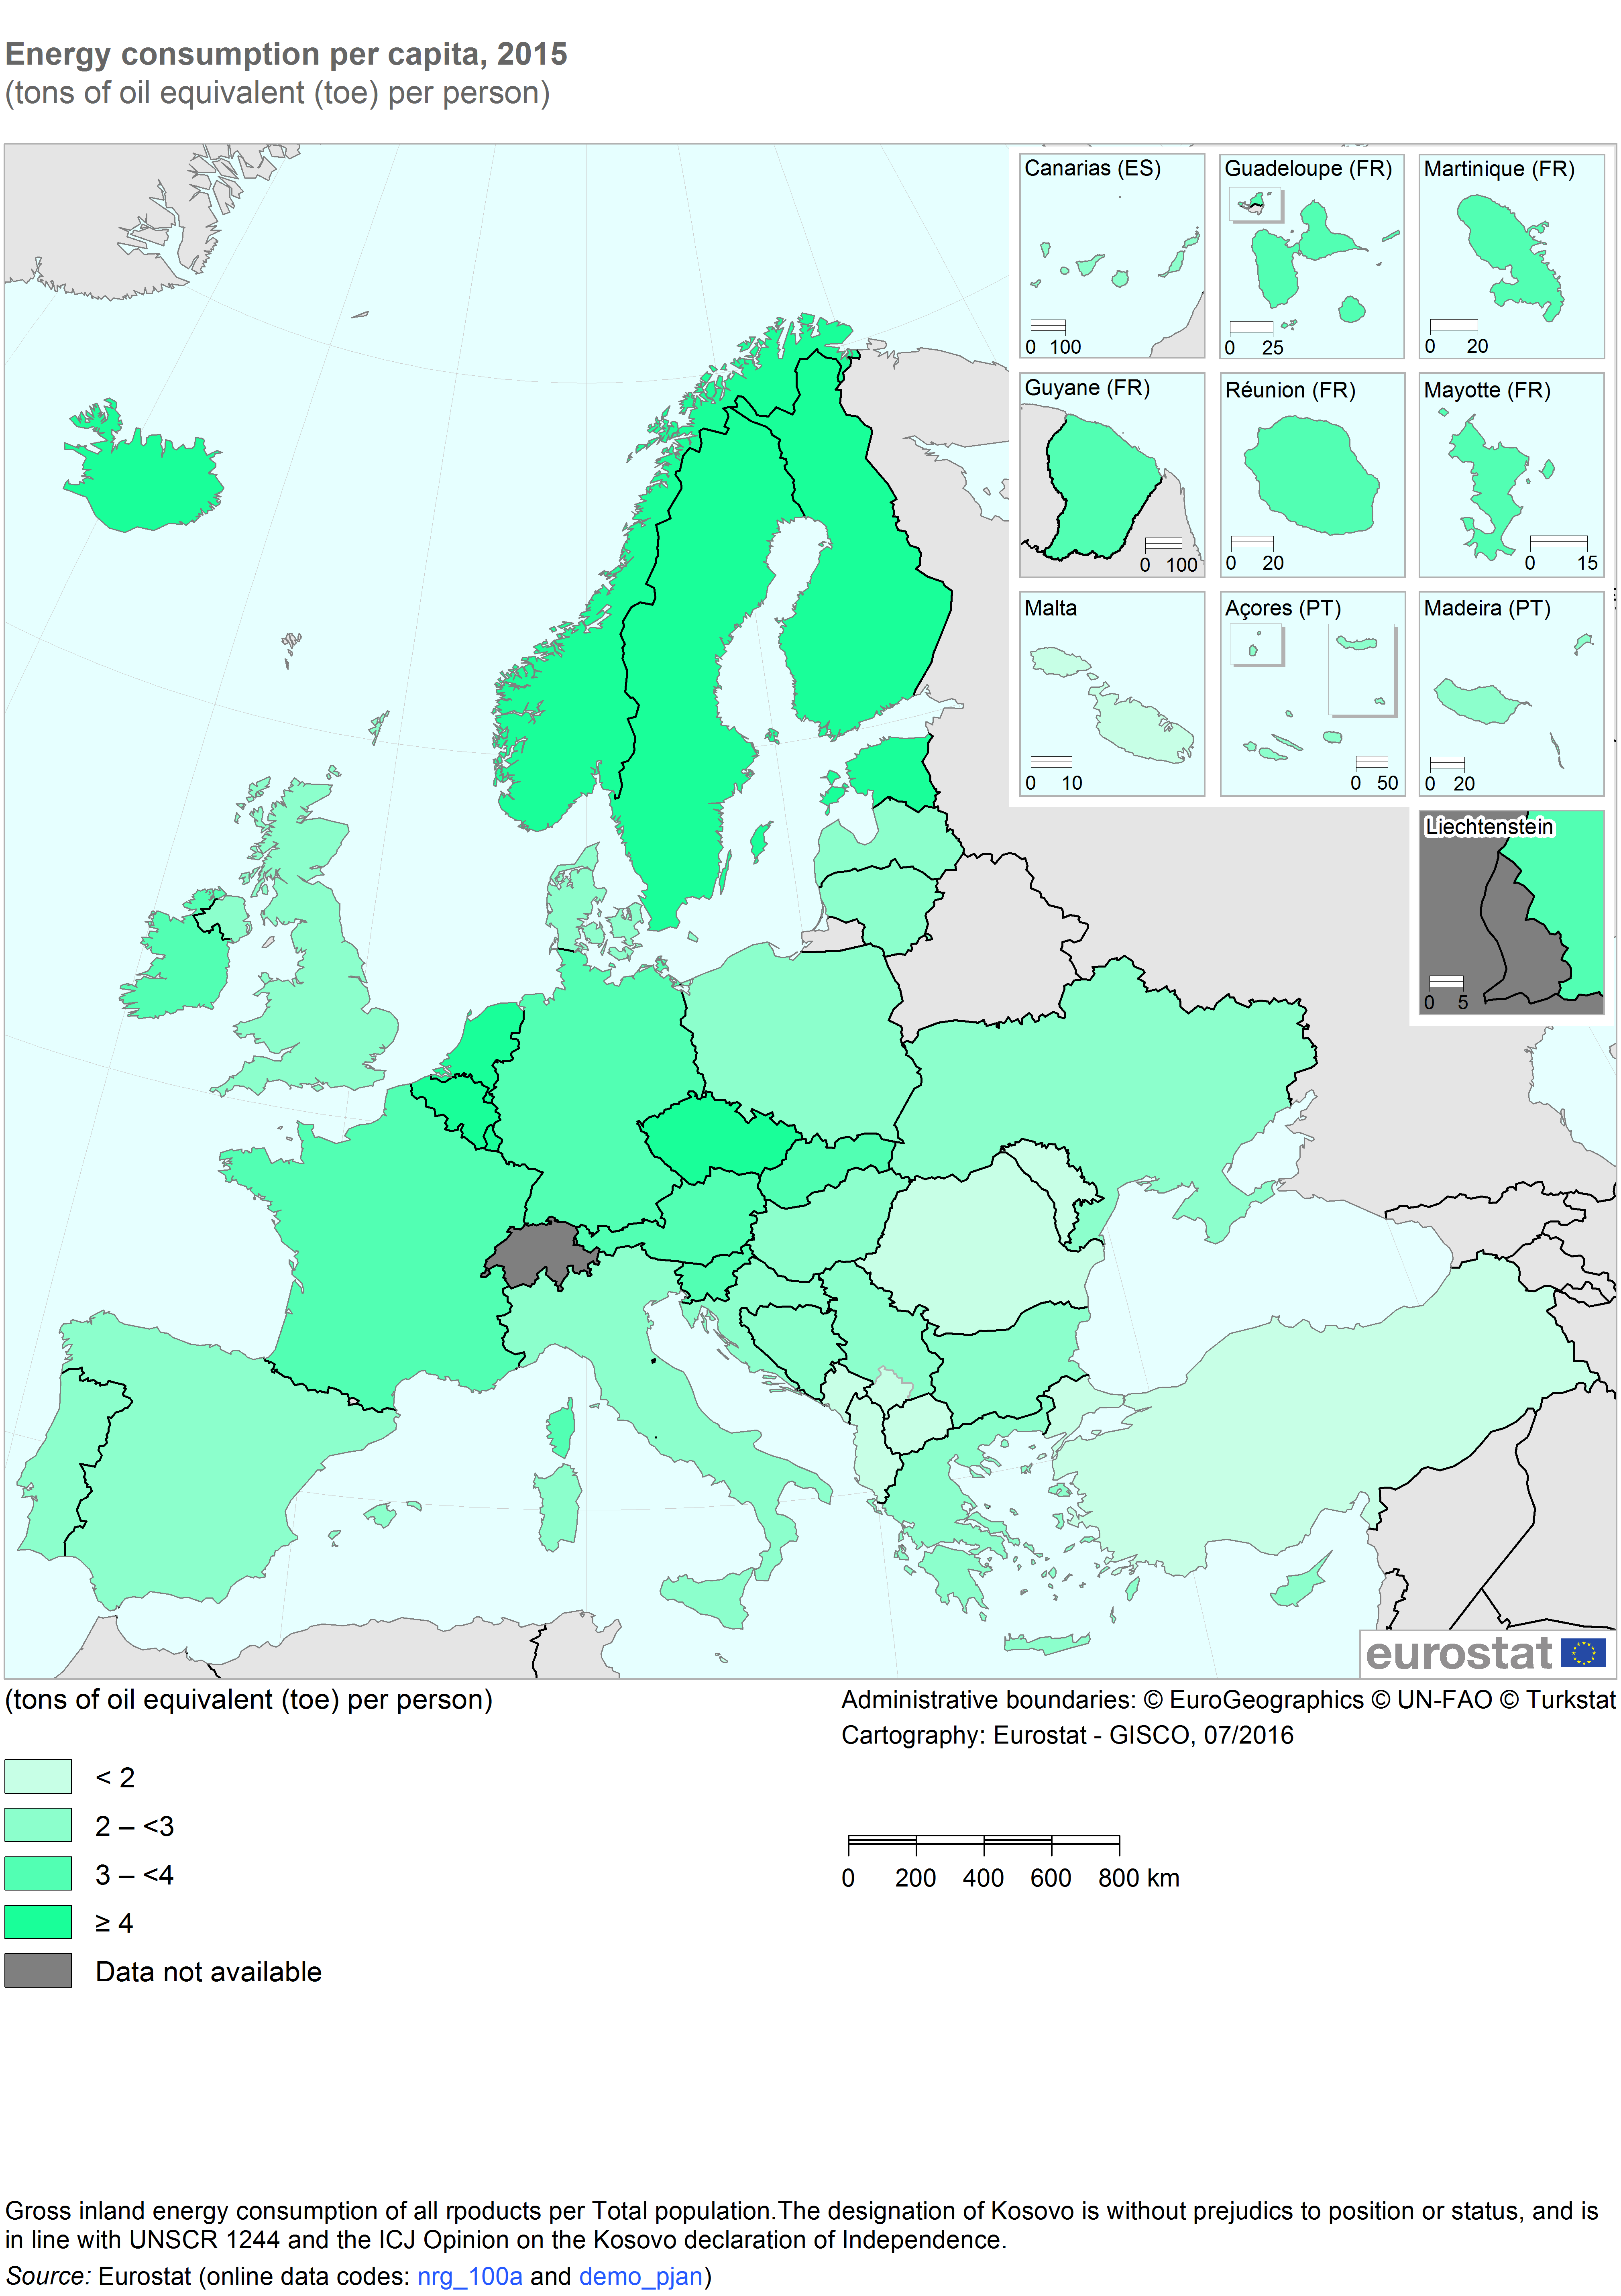
Map1 Energy consumption per capita, 2015.png
(
file
)
488 KB
1
09:18, 24 July 2017
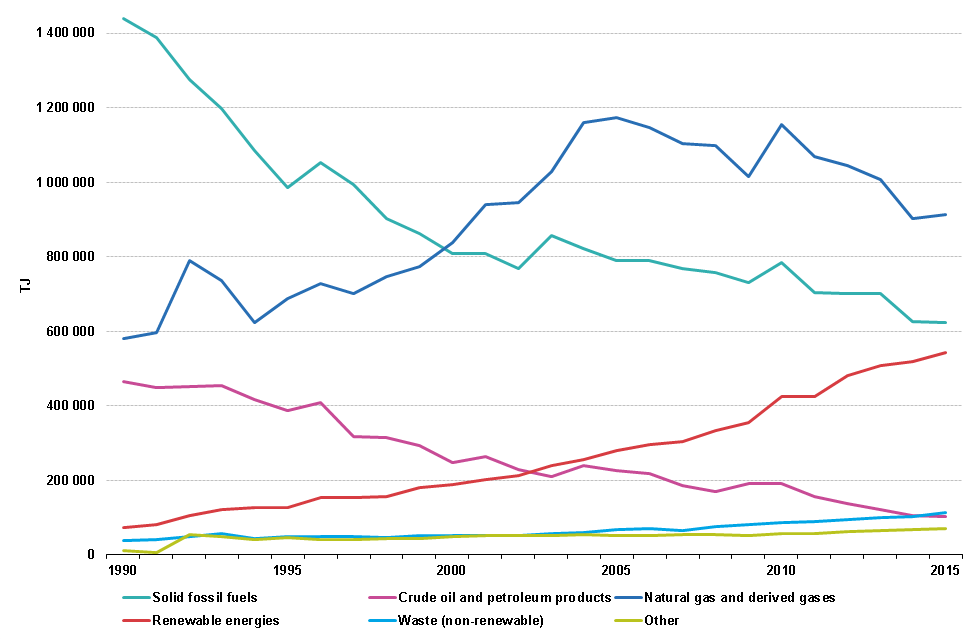
Gross derived heat production by fuel, TJ, EU-28, 1990-2015 F4.png
(
file
)
29 KB
1
09:18, 24 July 2017
Gross derived heat production by fuel, TJ, EU-28, 1990-2015 F3.png
(
file
)
29 KB
1
07:51, 21 July 2017
Waste statistics.xlsx
(
file
)
160 KB
1
07:47, 21 July 2017
Packaging waste.xlsx
(
file
)
154 KB
4
08:20, 18 July 2017
Energy dependency by fuel, EU-28, 1990-1995-2000-2010-2015, ktoe.png
(
file
)
32 KB
1
09:32, 16 July 2017
Price of wood in chips or particles sold, EU-28, 2005-2015.png
(
file
)
16 KB
1
11:01, 15 July 2017
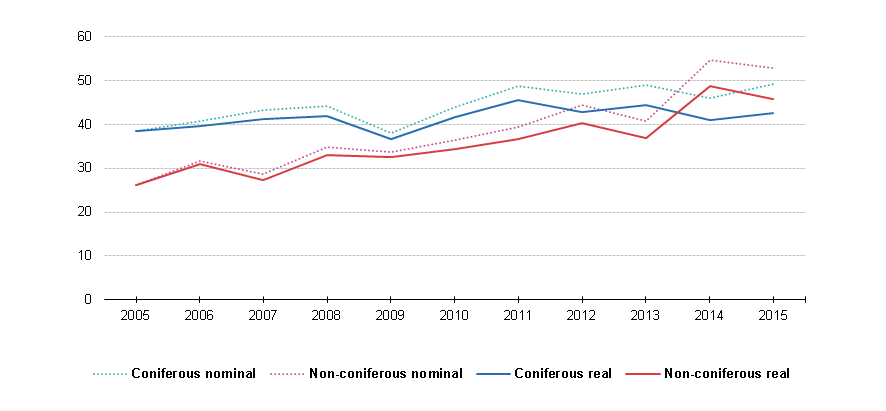
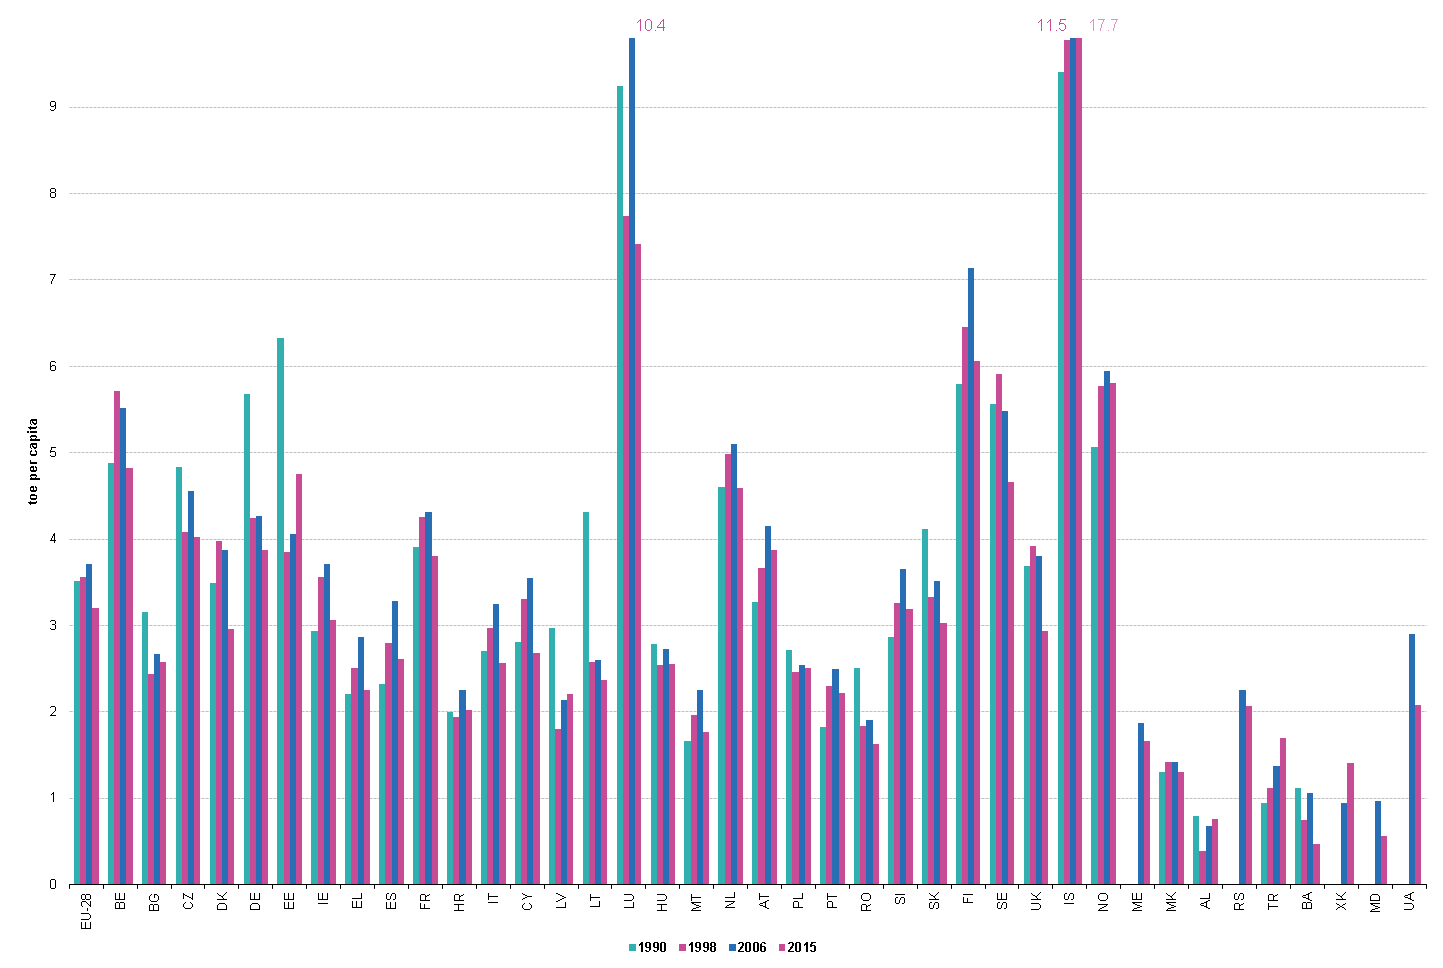
Gross inland energy consumption per capita,1990-1998-2006-2015, toe per capita.png
(
file
)
122 KB
1
13:41, 20 June 2017
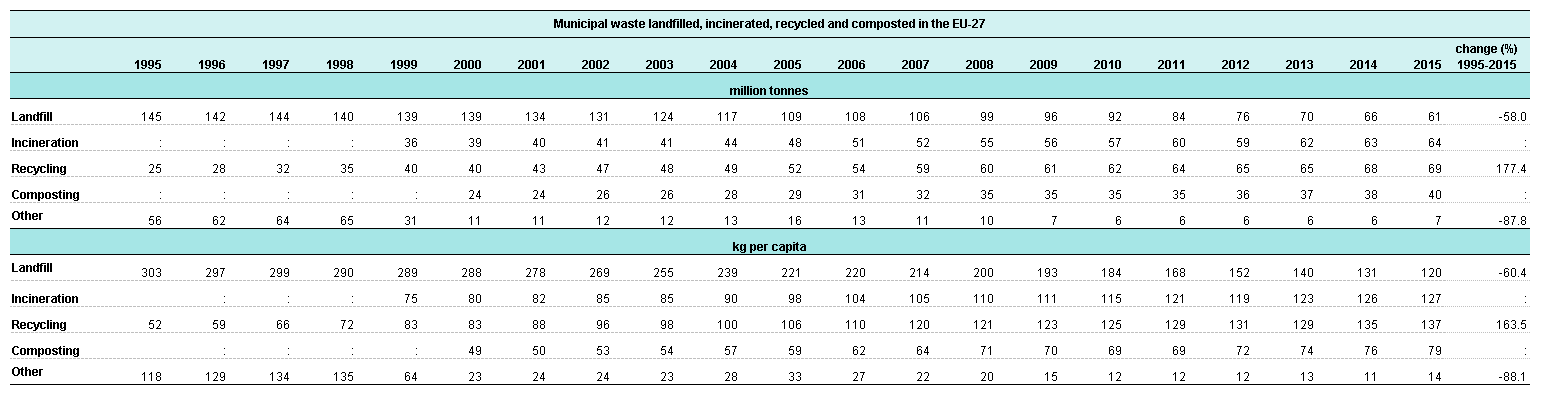
Municipal waste landfilled, incinerated, recycled and composted in the EU-27, 1995 to 2015 Rev.png
(
file
)
19 KB
1
13:40, 20 June 2017
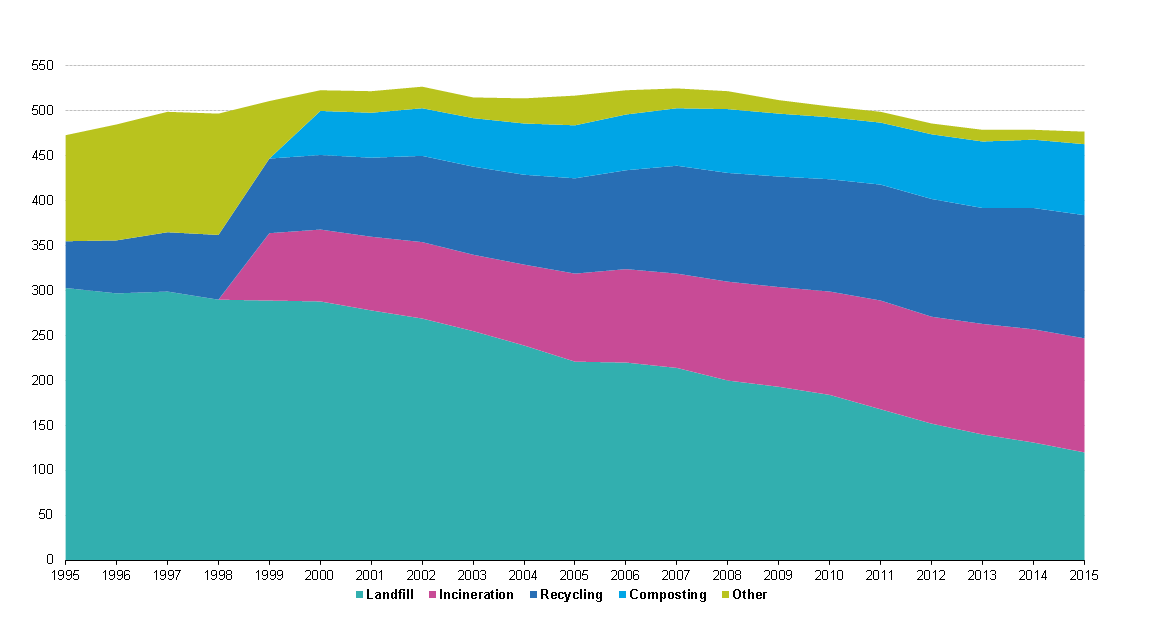
Municipal waste treatment, EU-27, (kg per capita) Rev.png
(
file
)
22 KB
1
11:10, 20 June 2017
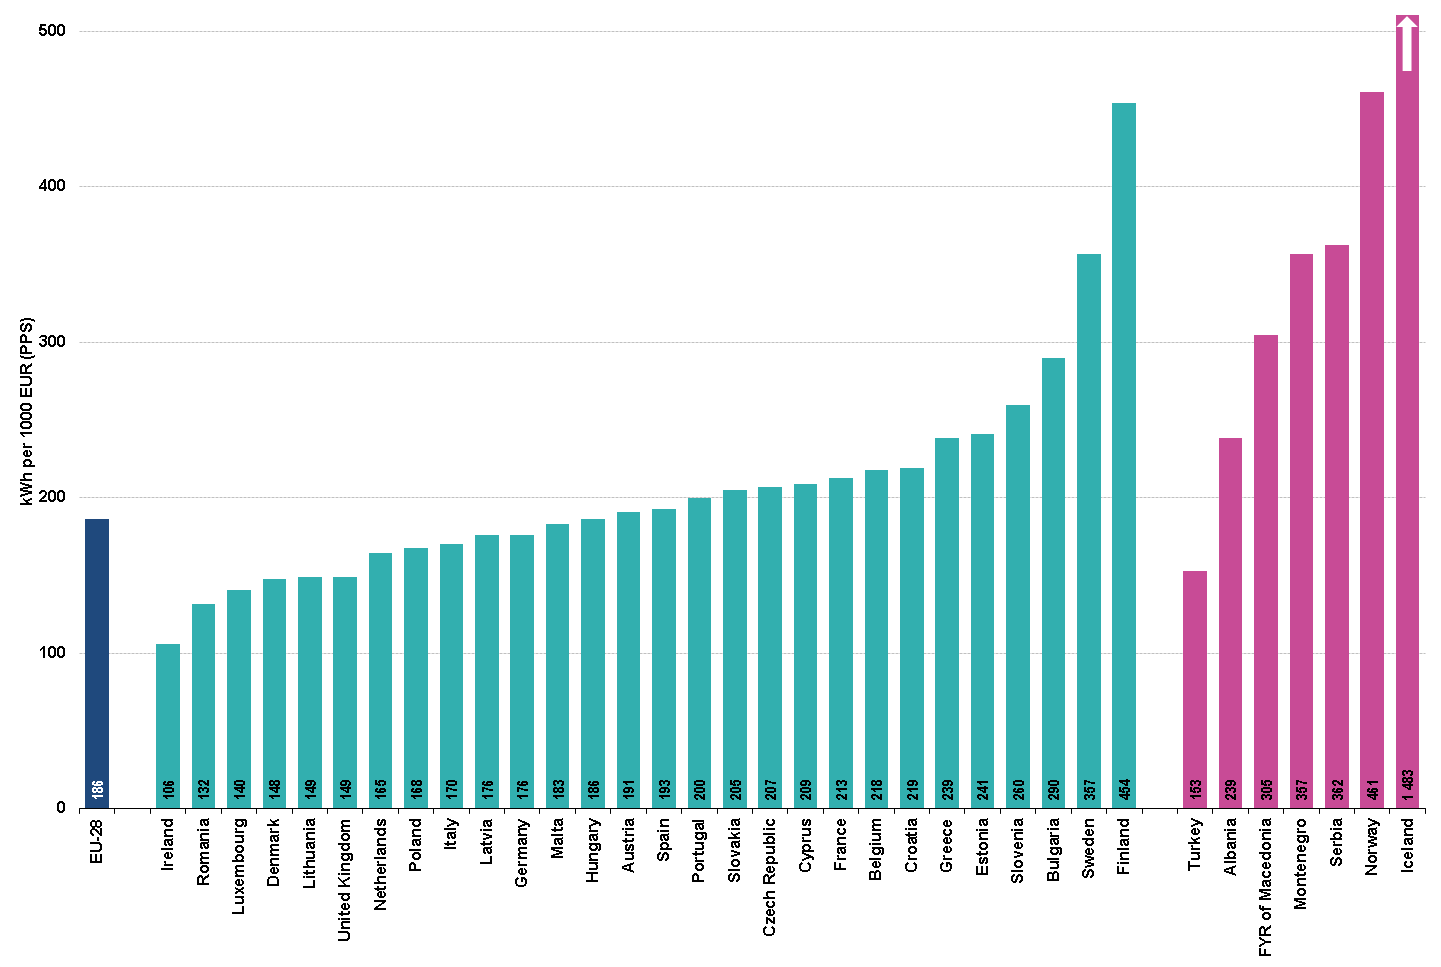
Final consumption of electricity per GDP (PPS), kWh per 1000 EUR (PPS), 2015 F7.png
(
file
)
69 KB
1
11:09, 20 June 2017
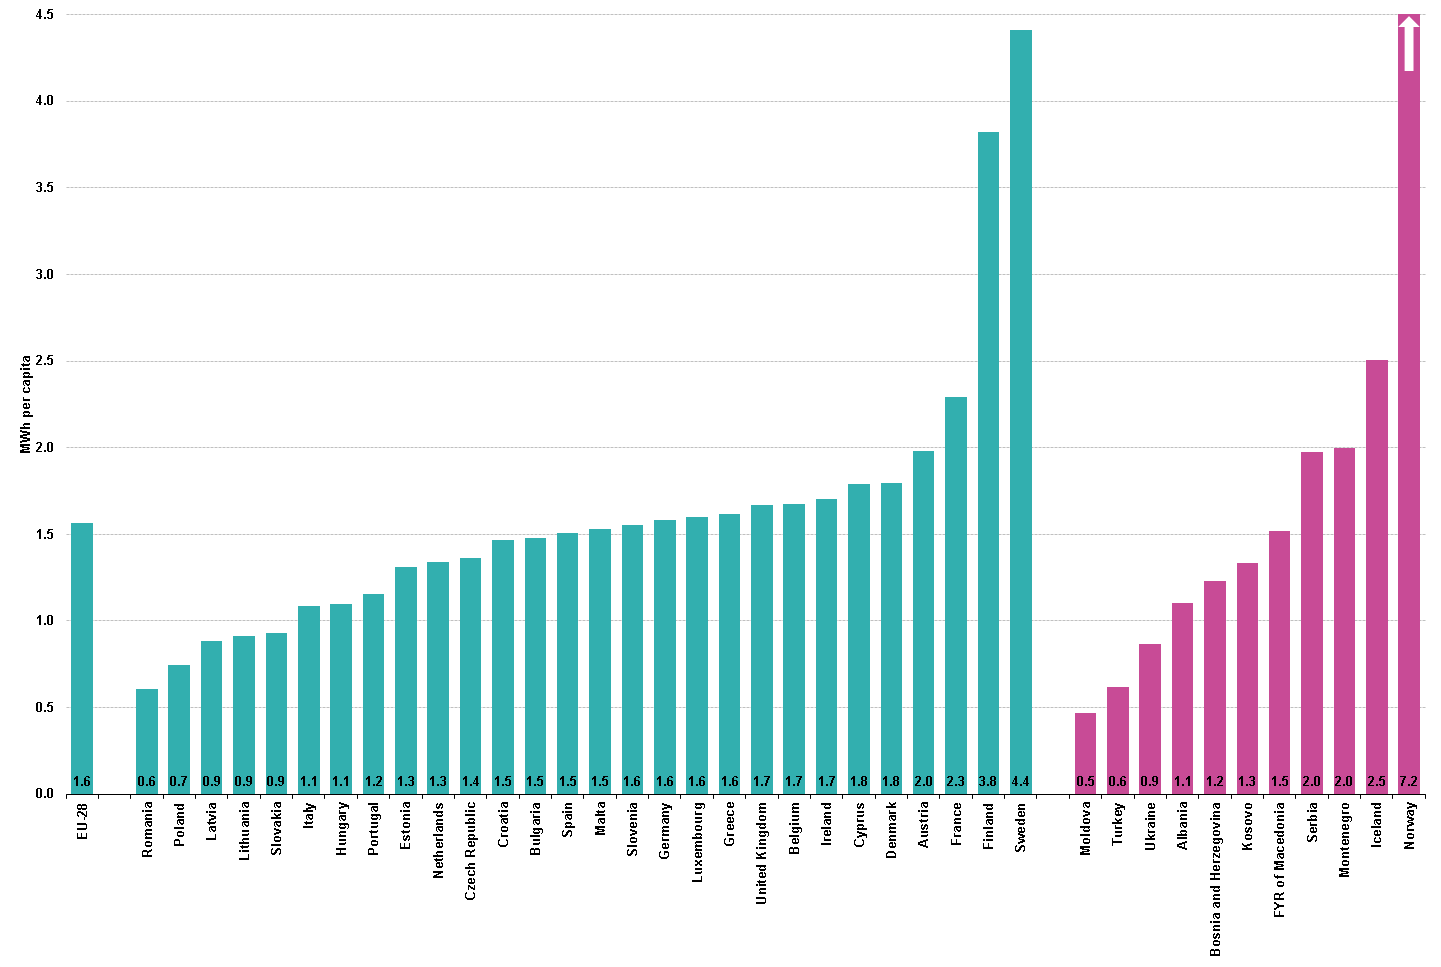
Households consumption of electricity per capita, MWh per capita, 2015 F6.png
(
file
)
60 KB
1
11:09, 20 June 2017
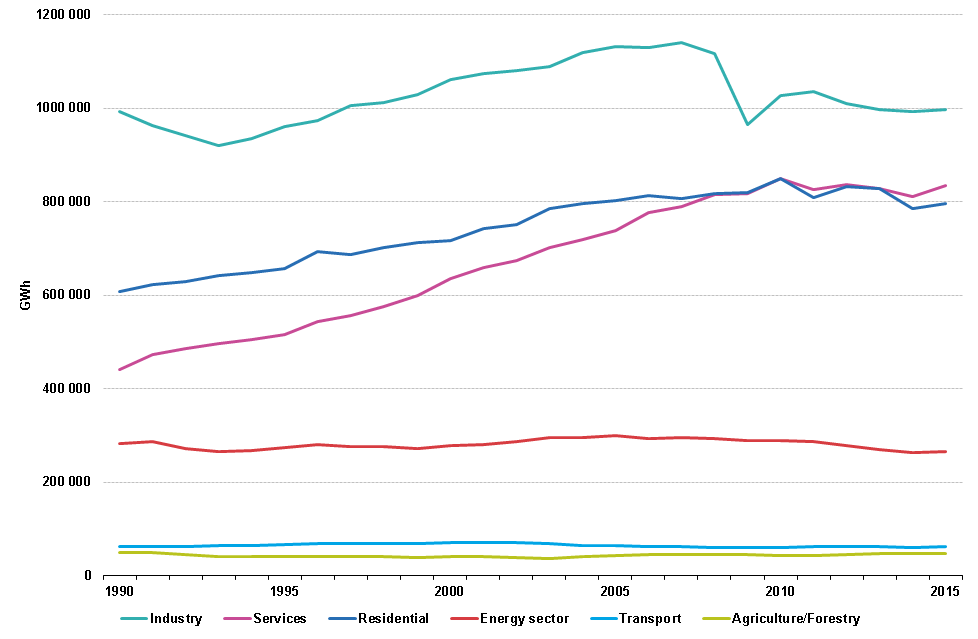
Consumption of electricity by sector, GWh, EU-28, 1990-2015 F5.png
(
file
)
21 KB
1
11:09, 20 June 2017
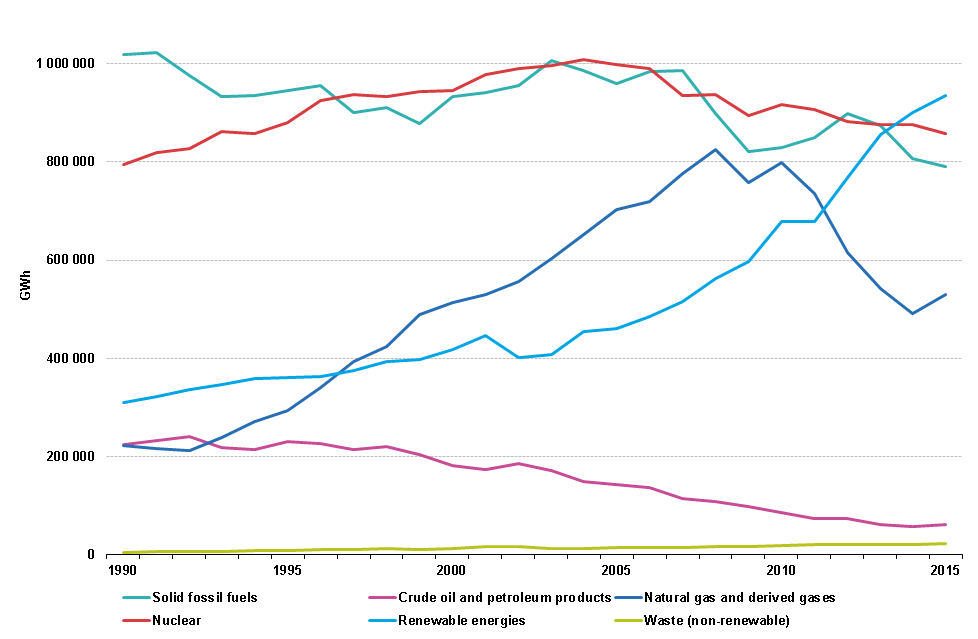
Gross derived heat production by fuel, GWh, EU-28, 1990-2015 F4.png
(
file
)
27 KB
1
11:08, 20 June 2017
Gross derived heat production by fuel, GWh, EU-28, 1990-2015 F3.png
(
file
)
30 KB
1
11:08, 20 June 2017
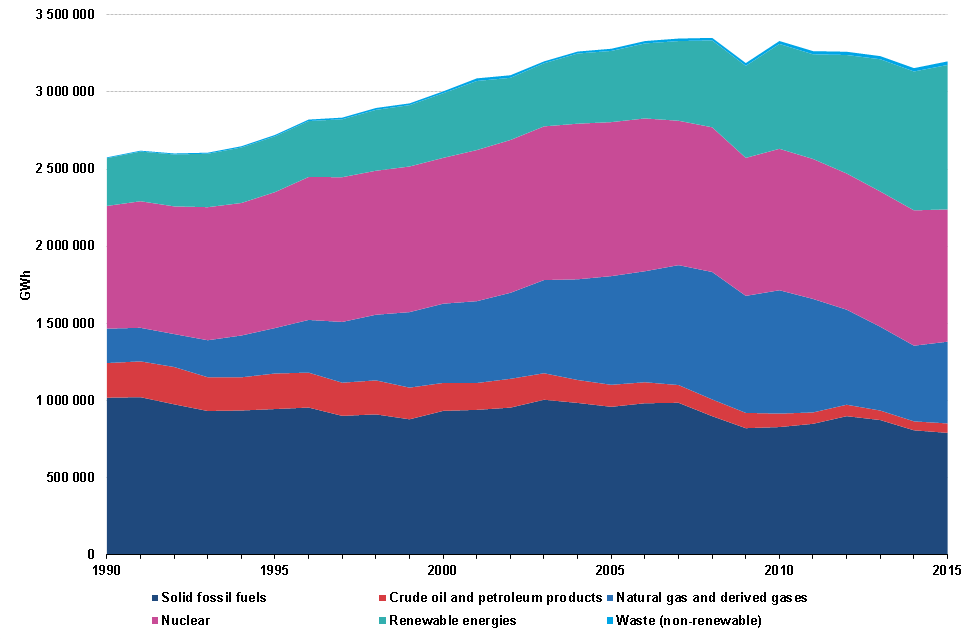
Gross electricity production by fuel, GWh, EU-28, 1990-2015 F2.png
(
file
)
22 KB
1
11:08, 20 June 2017
Gross electricity production by fuel, GWh, EU-28, 1990-2015 F1.png
(
file
)
31 KB
1
11:07, 20 June 2017
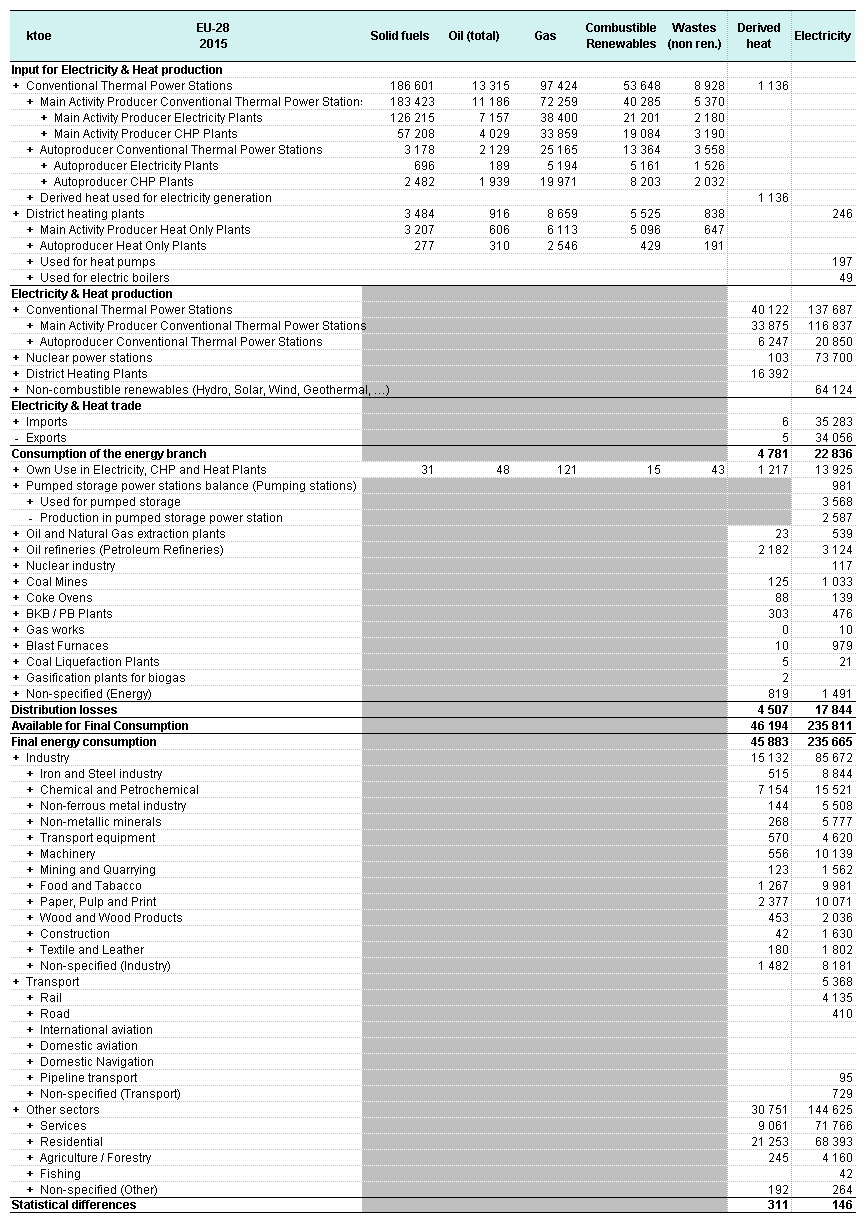
Simplified balance for electricity and derived heat, ktoe, EU-28, 2015 T5.png
(
file
)
60 KB
1
First page
Previous page
Next page
Last page
Special page
ISSN 2443-8219


_of_wood_products_and_storage_of_CO2,_1992%E2%80%932015.png)
,_EU-28,_1990%E2%80%932015.png)


_by_products,_2000-2015.png)


_Rev.png)
,_kWh_per_1000_EUR_(PPS),_2015_F7.png)


