Tutorials
Log in
Statistics Explained
menu
search
search
Navigation
Main page
Statistical themes
Glossary
Categories
Statistics 4 beginners
Tutorials
Help
Eurostat home
Education corner
Online publications
Regional yearbook
Sustainable development
Full list
Tools
User contributions
Logs
View user groups
Special pages
search
Navigation
Main page
Statistical themes
Glossary
Categories
Statistics 4 beginners
Tutorials
Help
Eurostat home
Education corner
Online publications
Regional yearbook
Sustainable development
Full list
Tools
User contributions
Logs
View user groups
Special pages
Navigation
Main page
Statistical themes
Glossary
Categories
Statistics 4 beginners
Tutorials
Help
Eurostat home
Education corner
Online publications
Regional yearbook
Sustainable development
Full list
Tools
User contributions
Logs
View user groups
Special pages
Uploads by Aseroge
This special page shows all uploaded files.
File list
Items per page:
20
50
100
250
500
Search for media name:
Username:
Include old versions of files
Go
First page
Previous page
Next page
Last page
Date
Name
Thumbnail
Size
Description
Versions
12:17, 3 March 2022
SBS overview 2022 ref19 final.xlsx
(
file
)
1.42 MB
3
11:57, 3 March 2022
Enterprise size class analysis of employment, EU-29, 2019 (percentage %).png
(
file
)
81 KB
1
11:04, 3 March 2022
Sectoral share of the number of enterprises within the non-financial business economy, EU, 2019 (%).png
(
file
)
83 KB
null
2
11:04, 3 March 2022
Gross operating rate within the non-financial business economy, EU, 2019 (%).png
(
file
)
83 KB
null
2
10:28, 3 March 2022
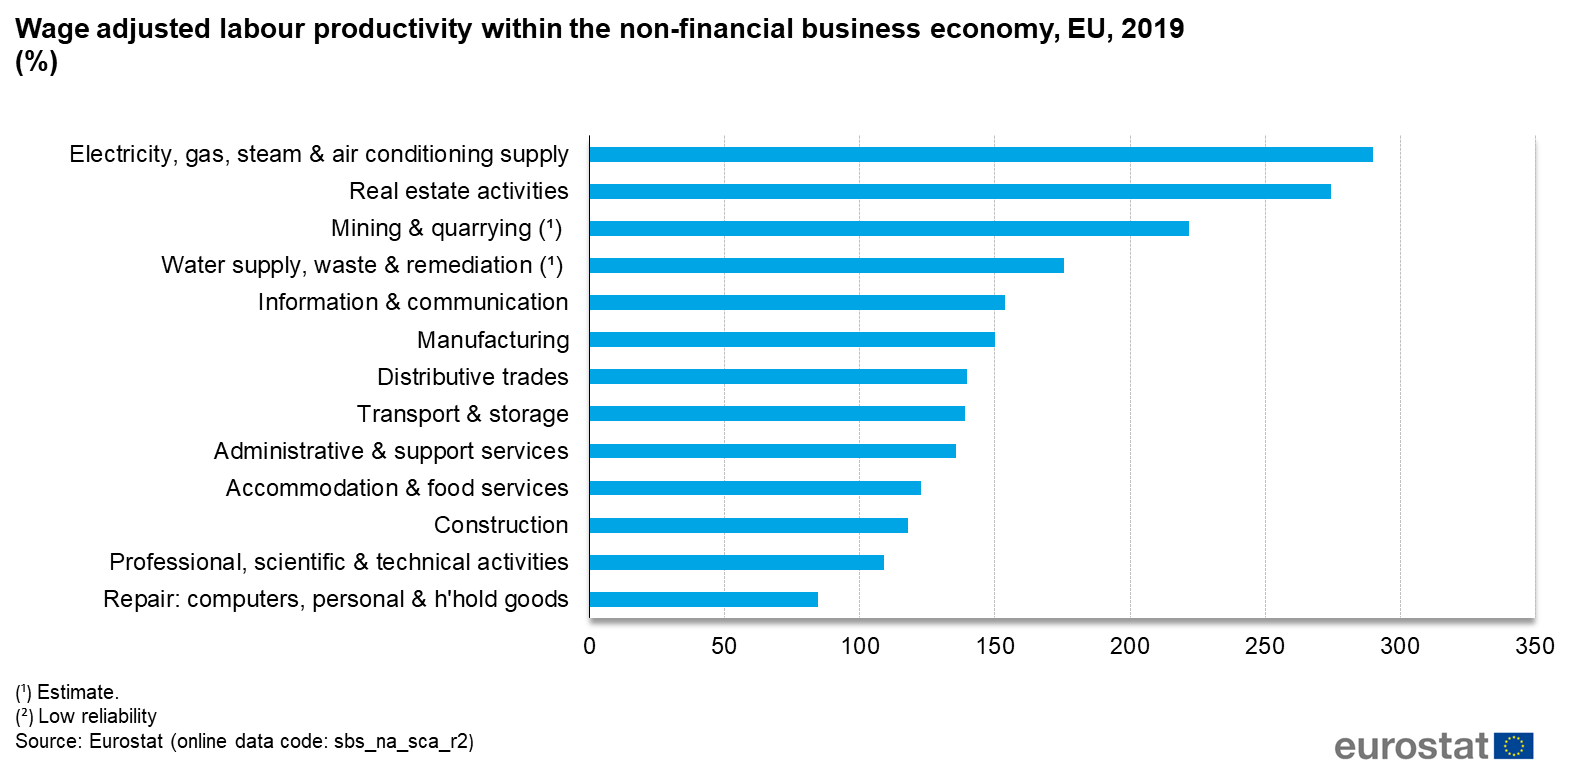
Wage adjusted labour productivity within the non-financial business economy, EU, 2019 (%).png
(
file
)
82 KB
2
17:58, 2 March 2022
Sectoral share of the number of enterprises within the non-financial business economy, EU, 2019(%).png
(
file
)
83 KB
1
17:46, 2 March 2022
Analysis of non-financial business economy value added and employment, EU, 2019 (% of non-financial business economy value added and employment).png
(
file
)
96 KB
null
1
17:46, 2 March 2022
Enterprise size class analysis of value added, EU, 2019 (% of sectoral total).png
(
file
)
105 KB
null
1
17:46, 2 March 2022
Enterprise size class analysis of employment, EU-28, 2019 (percentage %).png
(
file
)
80 KB
null
1
17:46, 2 March 2022
Enterprise size class analysis of employment, EU, 2019 (% of sectoral total).png
(
file
)
112 KB
null
1
11:29, 30 August 2021
Respiratory diseases 2021.xlsx
(
file
)
79 KB
2
11:18, 30 August 2021
Share of the population reporting they suffered from asthma, 2019 (%).png
(
file
)
100 KB
1
11:17, 30 August 2021
Share of the population reporting that they had chronic lower respiratory diseases (excluding asthma), 2019 (%).png
(
file
)
96 KB
1
11:16, 30 August 2021
Influenza vaccination rate, people aged 65 years and over, 2014 and 2019 (%).png
(
file
)
168 KB
1
00:16, 6 August 2021
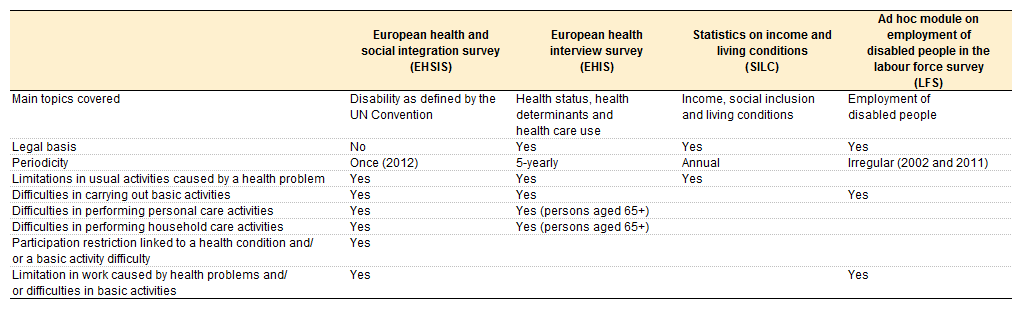
Overview of data sources for EU statistics on disability DIS2021.png
(
file
)
29 KB
1
23:59, 5 August 2021
Disability table.png
(
file
)
29 KB
1
17:17, 16 July 2021
Proportion of overweight women and men, 2019 (%).png
(
file
)
122 KB
2
12:24, 16 July 2021
Overweight and obesity Health2019.xlsx
(
file
)
67 KB
1
11:11, 16 July 2021
Proportion of women who were overweight, by educational level, 2019 (%).png
(
file
)
109 KB
null
1
11:11, 16 July 2021
Proportion of pre-obese women and men, 2019 (%).png
(
file
)
136 KB
null
1
11:11, 16 July 2021
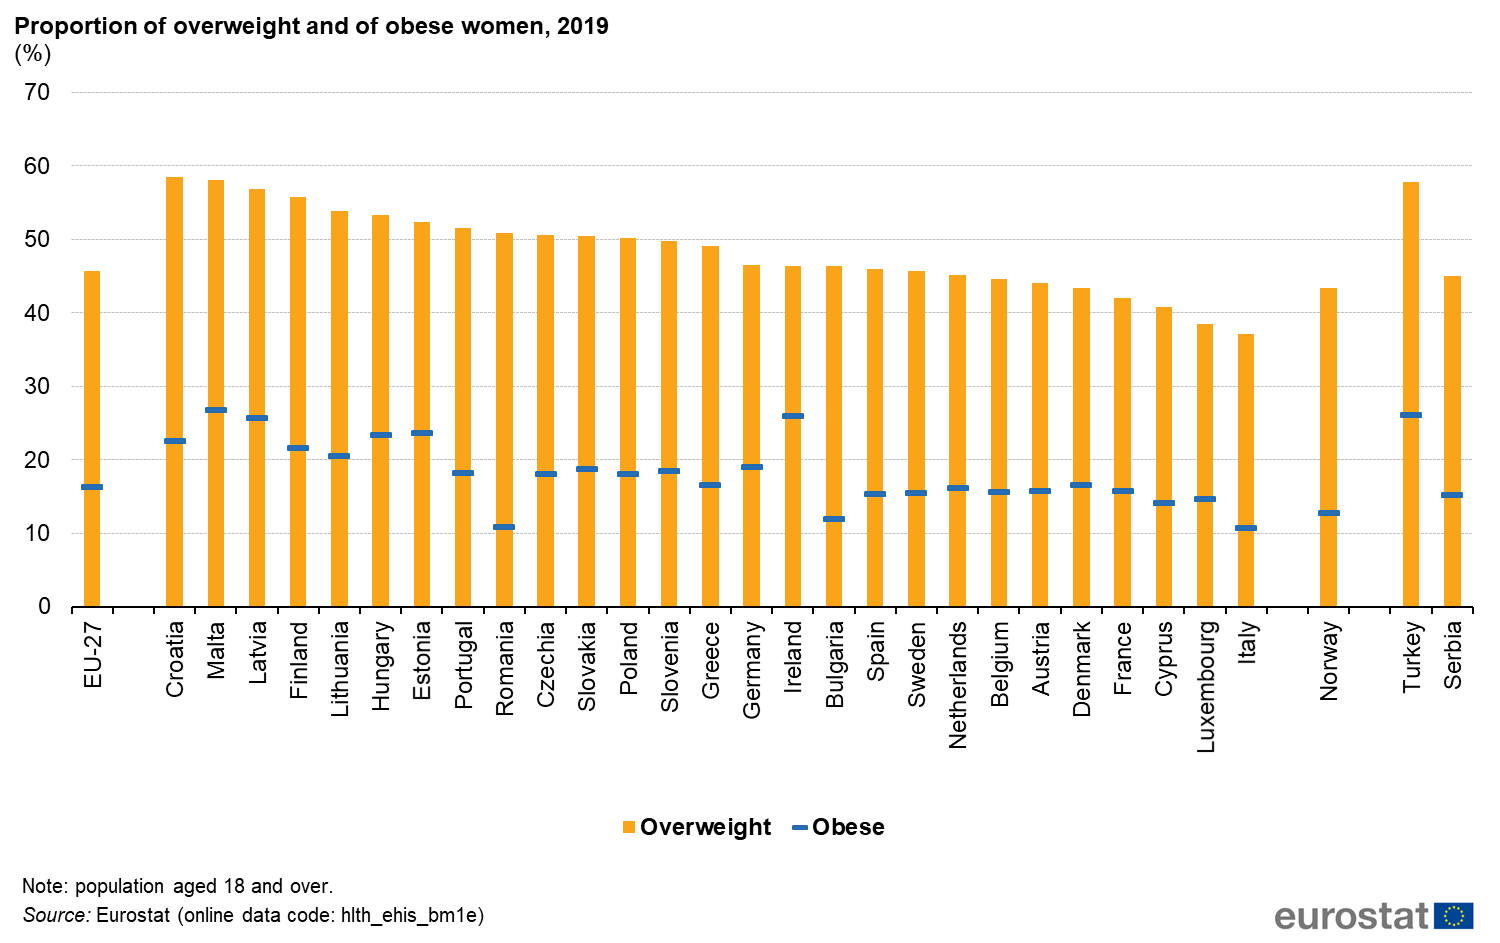
Proportion of overweight and of obese women, 2019 (%).png
(
file
)
131 KB
null
1
11:11, 16 July 2021
Proportion of overweight and of obese men, 2019 (%).png
(
file
)
118 KB
null
1
11:11, 16 July 2021
Proportion of men who were overweight, by educational level, 2019 (%).png
(
file
)
104 KB
null
1
16:01, 15 December 2020
Developments for constant price GDP and expenditure on benefits, EU-27, 2000-2018 (index, 2000=100) F4.png
(
file
)
86 KB
1
16:00, 15 December 2020
Developments for constant price expenditure on types of disability-related benefits, EU-27, 2000-2018 (index, 2000 = 100) F8.png
(
file
)
90 KB
1
15:59, 15 December 2020
Developments for constant price expenditure on detailed types of disability-related benefits, EU-27, 2000-2018 (index, 2000 = 100) F9.png
(
file
)
111 KB
1
15:55, 15 December 2020
Developments for constant price expenditure on types of disability-related benefits, EU-27, 2000-2018 (index, 2000 = 100).png
(
file
)
90 KB
Reverted to version as of 13:53, 15 December 2020
5
15:50, 15 December 2020
Developments for constant price GDP and expenditure on benefits, EU-27, 2000-2018 (index, 2000=100).png
(
file
)
86 KB
2
15:04, 15 December 2020
Overall change in expenditure on social benefits and disability-related benefits, 2000-2018 (%).png
(
file
)
92 KB
2
17:16, 10 December 2020
Expenditure on detailed types of disability-related benefits, 2018 (% of total expenditure on disability-related benefits).png
(
file
)
726 KB
1
17:13, 10 December 2020
Developments for constant price expenditure on detailed types of disability-related benefits, EU-27, 2000-2018 (index, 2000 = 100).png
(
file
)
111 KB
2
17:07, 10 December 2020
Expenditure on types of disability-related benefits, 2018 (% of expenditure on total disability-related benefits).png
(
file
)
125 KB
1
17:07, 10 December 2020
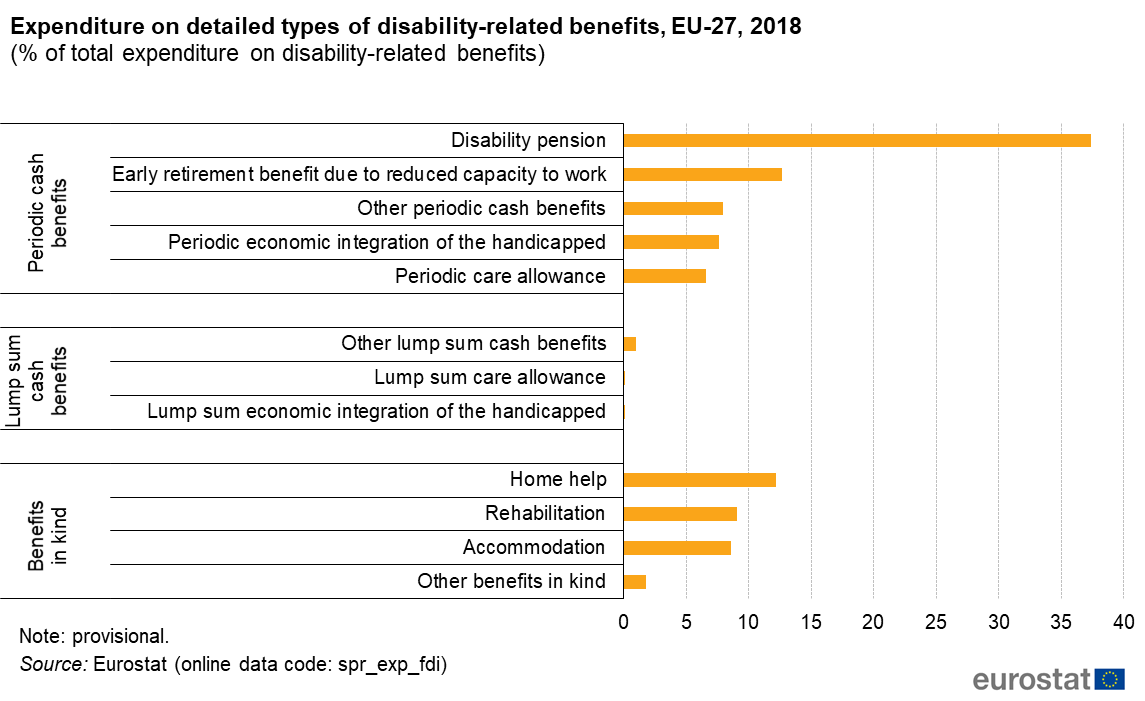
Expenditure on detailed types of disability-related benefits, EU-27, 2018 (% of total expenditure on disability-related benefits).png
(
file
)
75 KB
1
17:02, 10 December 2020
Expenditure on disability-related benefits per disabled person aged 16 years or more, 2018 (EUR and PPS per disabled person aged 16 years or more).png
(
file
)
106 KB
1
17:01, 10 December 2020
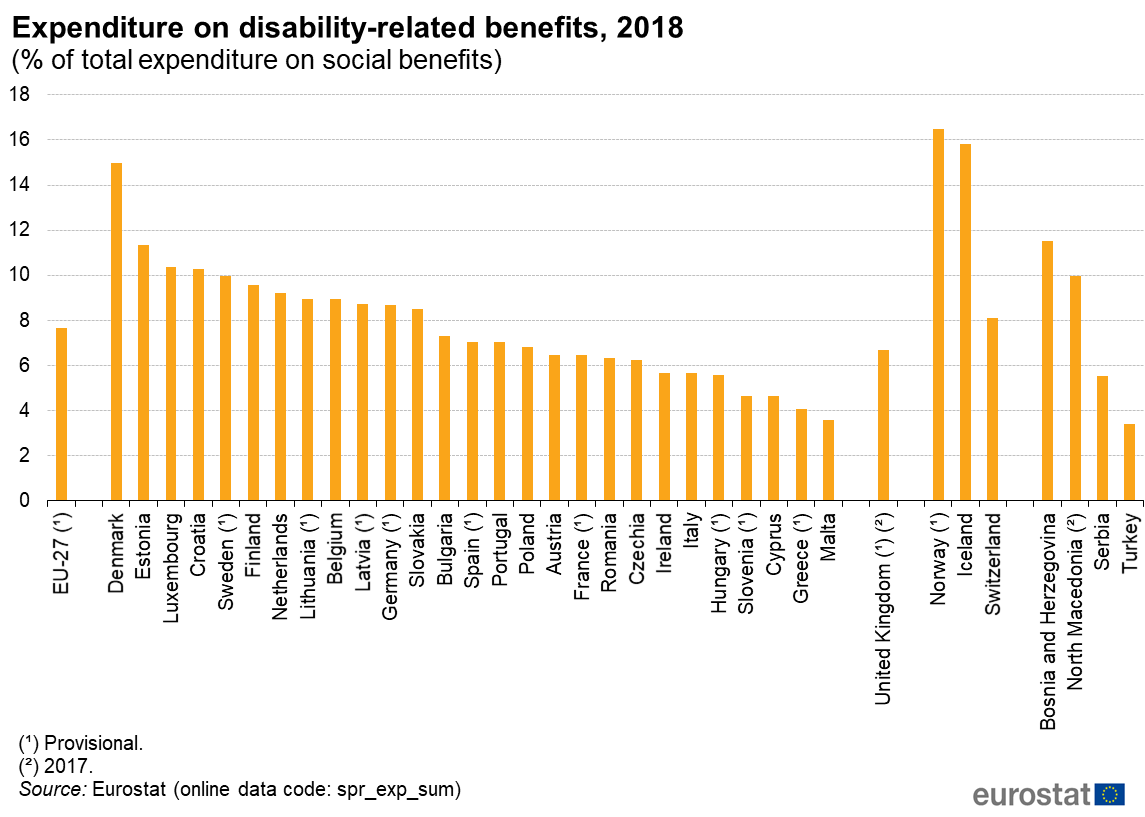
Expenditure on disability-related benefits, 2018 (% of total expenditure on social benefits).png
(
file
)
105 KB
1
17:01, 10 December 2020
Expenditure on disability-related benefits, 2018 (% relative to GDP).png
(
file
)
96 KB
1
16:35, 24 November 2020
Social protection statistics - social benefits SPS 241120.xlsx
(
file
)
58 KB
2
14:09, 24 November 2020
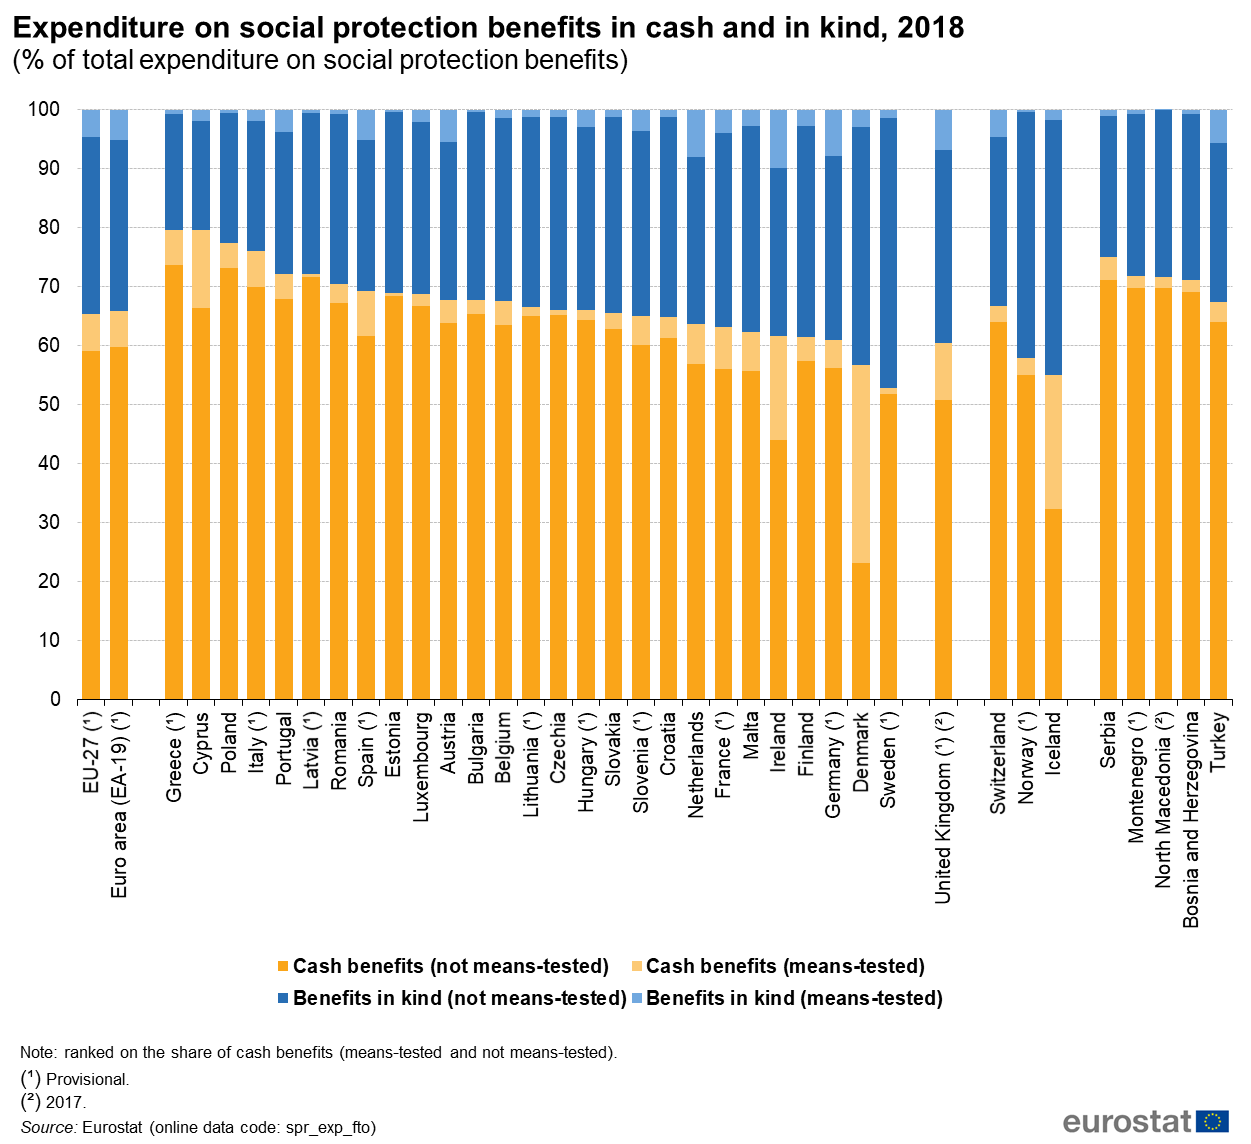
Expenditure on social protection benefits in cash and in kind, 2018v2 (% of total expenditure on social protection benefits).png
(
file
)
198 KB
1
12:05, 24 November 2020
Social protection statistics - social benefits SPS 201124.xlsx
(
file
)
58 KB
1
11:59, 24 November 2020
Expenditure on social protection benefits by function, 2018v2.png
(
file
)
709 KB
1
11:57, 24 November 2020
Expenditure on social protection benefits by function, 2018.png
(
file
)
709 KB
Reverted to version as of 09:53, 24 November 2020
12
17:02, 20 November 2020
Social protection statistics - social benefits SPS 201120.xlsx
(
file
)
58 KB
1
17:01, 20 November 2020
Expenditure on means-tested social protection benefits, 2018 (% of total expenditure on social protection benefits).png
(
file
)
102 KB
1
16:59, 20 November 2020
Expenditure on social protection benefits in cash and in kind, 2018 (% of total expenditure on social protection benefits).png
(
file
)
201 KB
1
16:54, 20 November 2020
Average annual growth rate of expenditure on social protection benefits, 2009-2018 (%).png
(
file
)
402 KB
1
16:43, 20 November 2020
Expenditure on social protection benefits, 2018 (%, relative to GDP).png
(
file
)
123 KB
1
17:38, 10 March 2020
Social protection statistics - family and children benefits-FP2020 ESTAT 200310.xlsx
(
file
)
107 KB
1
15:55, 23 October 2018
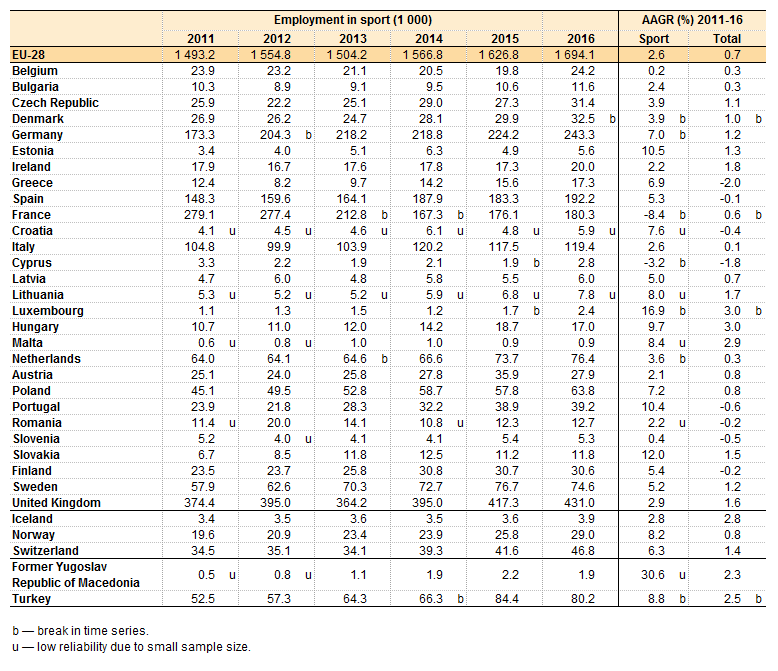
T1 Employment in sport and average annual growth rate.png
(
file
)
49 KB
2
15:59, 22 October 2018
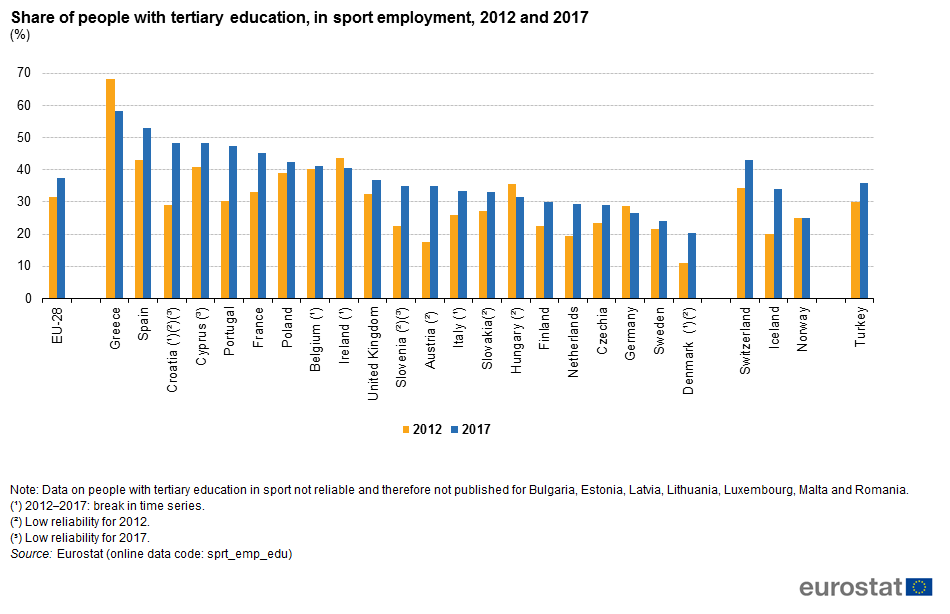
F5 People with tertiary education employed in sport.png
(
file
)
44 KB
1
15:59, 22 October 2018
F4 People with tertiary education employed in sport and in total employment.png
(
file
)
45 KB
1
First page
Previous page
Next page
Last page
Special page
ISSN 2443-8219
.png)
.png)
.png)
.png)
.png)
.png)
.png)
.png)
.png)
.png)
,_2019_(%25).png)
.png)


.png)
.png)
.png)
.png)
.png)
.png)
_F4.png)
_F8.png)
_F9.png)
.png)
.png)
.png)
.png)
.png)
.png)
.png)
.png)
.png)
.png)
.png)


.png)
.png)
.png)
.png)


