Data extracted in April 2021
Planned article update: July 2021
Highlights
Recent job starters and recent job leavers, EU-27, Q1 2008 - Q3 2020 (in million persons, age group 20-64, seasonally adjusted data)
Since the outbreak of the COVID-19 pandemic in early 2020 in Europe, many companies have been struggling with balancing the need to protect their clients and employees from infection and to find a way to continue to produce goods and provide services to preserve their existence. Many were not able to maintain the same levels of production as before the COVID crisis. To mitigate the social impact of the pandemic, the European Union (EU) and national governments introduced a variety of measures, including fiscal support or loans, to protect people from job loss in the situation of a less productive economy. Although protective measures to preserve the level of employment have been taken, a more cautious policy of enterprises in regards to hiring new employees could be expected. Also, there may be more reluctance to start new businesses, which could have also led to more employed people.
The aim of this article is to shed light on this topic and to report about developments for recent job starters. Information on recent job leavers is also presented to complement the picture of the labour market dynamics. The two groups are defined in the following way:
- Recent job leavers are people who reported that they left their job in the last 3 months before the interview;
- Recent job starters are people who reported that they started their employment in the last 3 months before the interview.
This article is based on quarterly results from the European Union Labour Force Survey (EU-LFS). Both the European and country approaches are presented in this article, which show the effect of the COVID-19 crisis at the global EU level and at the national level in the individual Member States, as well as in three EFTA countries (Iceland, Norway and Switzerland) and four candidate countries (Montenegro, North Macedonia, Serbia and Turkey).
This article is part of the online publication Labour market in the light of the COVID 19 pandemic - quarterly statistics along with the articles Employment, Absences from work and Hours of work.
Recent job starters outnumbered again recent job leavers in the third and fourth quarter of 2020
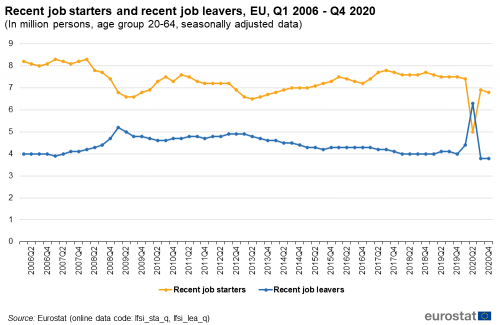
Figure 1 presents the development in the number of recent job starters and recent job leavers over the period 2006-2020 in the EU. The levels of the two groups got closer together and moved further apart from each other over time. For example, in the first quarter of 2009, a period that is associated with the financial recession from the late 2000s, the numbers of recent starters and leavers were very close to each other. In this quarter, 6.8 million people were newly employed, whereas 5.2 million had recently left their jobs.
However, despite the proximity of these two groups over the years, the number of recent job leavers has never surpassed the number of recent job starters, at least up to the second quarter of 2020 (Q2 2020). During this quarter, recent job leavers outnumbered recent job starters by 1.3 million, reaching a record high for the whole time series of 6.3 million. The number of recent job starters in the same quarter reached a historical low of 5.0 million in contrast.
The situation during the third quarter of 2020 (Q3 2020) changed, the number of recent job starters was again above that of recent job leavers. In detail, during this quarter there were 6.9 million recent job starters against 3.8 million recent job leavers. In the last quarter of 2020 (Q4 2020), the number of recent job leavers remained stable (3.8 million), whereas the number of recent job starters dropped slightly to 6.8 million.
Source: Eurostat (lfsi_sta_q), (lfsi_lea_q)
When comparing the results for the last two quarters of 2020 with the long-term trend, it can be noticed that the number of recent job leavers in Q3 and Q4 2020 is at an all-time low level since the start of the time series (i.e. since Q1 2006). On the other hand, the number of recent job starters in those two quarters, although substantially higher than the number in Q2 2020, was below its level from Q2 2014 to Q1 2020, moreover, it was similar to the number recorded during the financial recession from the late 2000s.
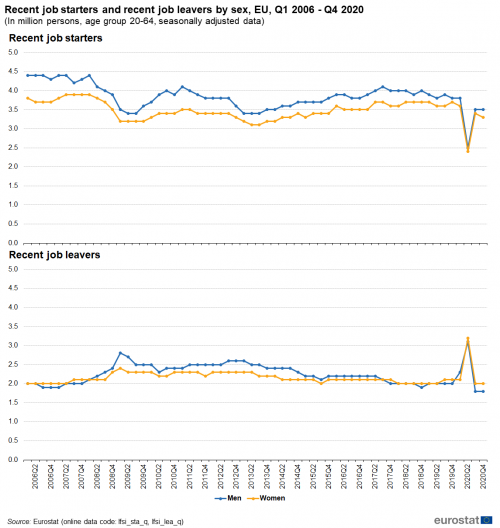
In the population of recent job starters, men have been always more than women, as shown in Figure 2. In Q2 2020, both genders almost equalized. But hereafter, the gap widened. In the population of recent job leavers, the pattern is not so conclusive over the years (in some quarters men are more, in some quarters women prevailed), however, in the last three quarters of 2020 the number of women recent job leavers is higher than the men’s.
Source: Eurostat (lfsi_sta_q), (lfsi_lea_q)
Focus on recent job starters
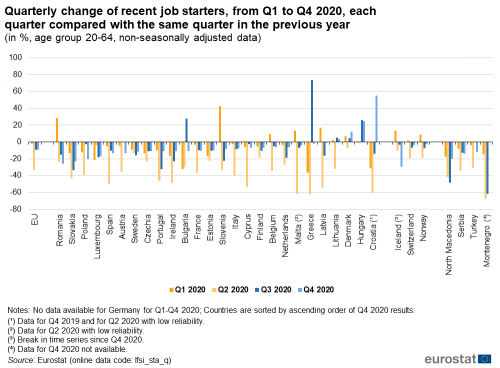
At the EU level, the number of recent job starters in Q1 2020 was 1.9 % lower than the number in Q1 2019. Comparing these two quarters, the situation among the EU Member states was diverse (see Figure 3). However, the majority of EU countries (19 out of 26 with available data) also experienced a decrease in the number of newly employed between Q1 2019 and Q1 2020. The decrease was most notable in Croatia (-30.9 %), Bulgaria (-32.4 %) and Greece (-36.5 %). In contrast, the number of recent job starters increased between Q1 2019 and Q1 2020 in the other seven EU countries, with an increase ranging from +1.8 % in Lithuania to +42.5 % in Slovenia.
Source: Eurostat (lfsi_sta_q)
The decrease in the number of recent job starters between the second quarter of 2019 (Q2 2019) and the second quarter of 2020 (Q2 2020) was huge in comparison with the decrease between Q1 2019 and Q1 2020 in the EU. The number of people who had started a job recently at the EU level in Q2 2020 was one third less (-33.6 %) than in Q2 2019. Moreover, all Member States in Q2 2020 recorded a decline in the number of recent job starters in comparison with Q2 2019. The drop between Q2 2019 and Q2 2020 even exceeded -50 % in Cyprus (-53.1 %), Latvia (-54.5 %), Croatia (-60.2 %, low reliability), Malta (-61.6 %, low reliability) and Greece (-61.8 %). In contrast, Denmark (-7.6 %), Luxembourg (-3.6 %) and Hungary (-0.8 %) corresponded to a decrease of less than -10 %.
Looking at the EU level, the change in the number of newly employed people between the third quarter of 2019 (Q3 2019) and the third quarter of 2020 (Q3 2020) was smaller than the change between the second quarters of 2019 and 2020. However, the change was still negative and equal to -9.5 %. Focusing on the national level, between Q3 2019 and Q3 2020, 20 Member States also registered a fall in the number of newly employed people, with the most pronounced drops in Slovenia (-22.4 %), Ireland (-23.1 %), Portugal (-32.3 %) and Slovakia (-33.8 %). In contrast, the number of recent job starters increased between Q3 2019 and Q3 2020 in the remaining six EU countries, where the highest growths were found in Hungary (+26.1 %), Bulgaria (+27.5 %) and Greece (+73.3 %). Note that Greece, which showed the largest decrease in the number of recent job starters from Q1 2019 to Q1 2020 and from Q2 2019 to Q2 2020, experienced the largest increase from Q3 2019 to Q3 2020.
With -8.9 % the change at the EU level between Q4 2020 and Q4 2019 was slightly smaller than the change between Q3 2020 and Q3 2020. At a national level, 22 EU countries also had a negative change in the numbers of newly employed from Q4 2019 to Q4 2020. The biggest drops were in Poland (-20.3 %), Slovakia (-22.8 %) and Romania (-26.0 %). Four countries were at the other side of the zero value, i.e. with a larger number of recent job starters in Q4 2020 than in Q4 2019: Lithuania (+3.6 %), Denmark (+12.4 %), Hungary (+24.9 %) and Croatia (+55.2 %). It is worth noting that the situation in Croatia was also very dynamic in 2020, as this country showed one of the biggest decreases from Q1 2019 to Q1 2020 and from Q2 2019 to Q2 2020, but also the largest increase in the number of recent job starters from Q4 2019 to Q4 2020.
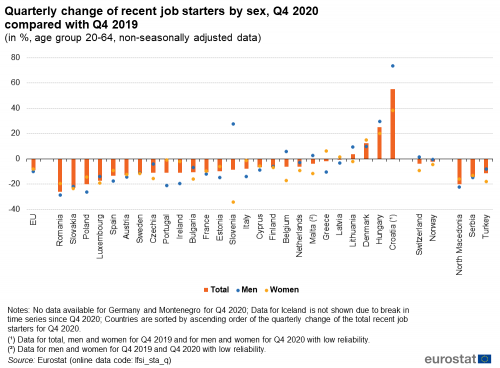
The development between Q4 2019 and Q4 2020 for men and women among the population of recent job starters is presented in Figure 4. At the EU level, both genders experienced a decrease in terms of percentage change between those two quarters. However, the decrease for men was more pronounced than the decrease for women: -10.0 % for men compared with -7.9 % for women.
Source: Eurostat (lfsi_sta_q)
Only seven EU countries saw their number of male recent job starters increasing between Q4 2019 and Q4 2020. The increase was the largest in Croatia (+73.5 %, low reliability), followed by Hungary (+29.7 %) and Slovenia (+27.7 %). In the remaining 19 EU countries, the number of men who had started a job recently before the interview decreased when comparing Q4 2020 with Q4 2019. The largest cuts were in Slovakia (-22.1 %), Poland (-26.1 %) and Romania (-28.7 %).
The number of women who were recent job starters increased between Q4 2019 and Q4 2020 in only five Member States. As for men, the increase for women was the most significant in Croatia (+38.3 %, but with low reliability) and Hungary (+20.0 %), but in this case, followed by Denmark (+15.0 %) in the third place. Note that the increase for women in Croatia and Hungary is less pronounced than the increase for men. In the vast majority of Member States (the remaining 21 countries), the number of newly employed women decreased between Q4 2019 and Q4 2020. The sharpest drops were recorded in Luxembourg (-19.1 %), Romania (-19.4 %), Slovakia (-23.7 %) and Slovenia (-34.3 %). This makes Slovenia, the country with one of the biggest increase in the number of men among the newly employed and at the same time with the biggest cut in the number of women among this population.
Focus on recent job leavers
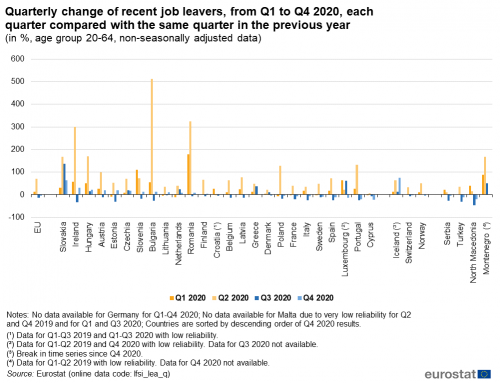
Between Q1 2019 and Q1 2020, the number of recent job leavers increased by +14.2 % at the EU level (see Figure 5). The majority of Member States (18 out of 25 with available data) also experienced an increase in the population of recent ex-workers. This increase was most significant in Slovenia and Romania, where the number of people who had left their jobs recently in Q1 2020 doubled and tripled respectively the corresponding number in Q1 2019. In the remaining seven EU countries, the number of recent job leavers decreased between Q1 2019 and Q1 2020, with the slowest drop in Sweden and France (-0.1 % for both), and the sharpest one in the Netherlands (-10.8 %).
Source: Eurostat (lfsi_lea_q)
When Q2 2020 is compared with Q2 2019, the quarterly change takes much more significant dimensions than if Q1 2020 and Q1 2019 are set side by side. This is observed at the EU level, where the number of recent job leavers in Q2 2020 was 71.1 % higher than in Q2 2019. Only one Member State experienced a drop, namely Croatia (-1.2 %, low reliability). Also, only Cyprus (+5.6 %) had an increase in the number of recent job leavers of less than +20 %. In contrast, the number of people who had left their jobs recently tripled between Q2 2019 and Q2 2020 in Hungary and Slovakia and quadrupled in Romania and Ireland. However, the largest increase could be found in Bulgaria, with six times more recent job leavers in Q2 2020 than in Q2 2019.
The quarterly change in the number of recent job leavers between Q3 2019 and Q3 2020 at the EU level (-14.2 %) was the same size as the quarterly change between Q1 2019 and Q1 2020 (+14.2 %) but in a different direction. The majority of Member States (18 EU countries) had a reduction in the population of new ex-workers in Q3 2020 compared with Q3 2019. The decrease was the most notable in Ireland (-34.2 %), followed by Estonia (-31.3 %) and Bulgaria (-25.8 %). Please note that Ireland and Bulgaria both had a very large percentage increase in recent job leavers between Q2 2019 and Q2 2020. On the contrary, the number of recent job leavers rose in the remaining seven EU countries, with increases ranging from +9.9 % in Denmark to +136.5 % in Slovakia. This makes Slovakia the Member State with the largest increase in the number of recent job leavers, and also with the largest decrease in the number of recent job starters (as seen in the previous section), between Q3 2019 and Q3 2020.
From Q4 2019 to Q4 2020, the number of recent job leavers dropped by -4.0 % at the EU level. Nine EU countries also had a lower number of recent job leavers in Q4 2020 than in Q4 2019. The cut ranged from -3.6 % in Denmark to -22.1 % in Cyprus. In Greece, the number of recent job leavers remained stable. And in 15 other Member States, the group of recent job leavers increased its size. Same as from Q3 2019 to Q3 2020, and from Q4 2019 to Q4 2020, Slovakia (+63.0 %) had the largest increase in the number of people who had left their jobs recently. Following Slovakia, Ireland (+31.2 %) and Hungary (+22.0 %) had the second and third largest increase in the number of this category.
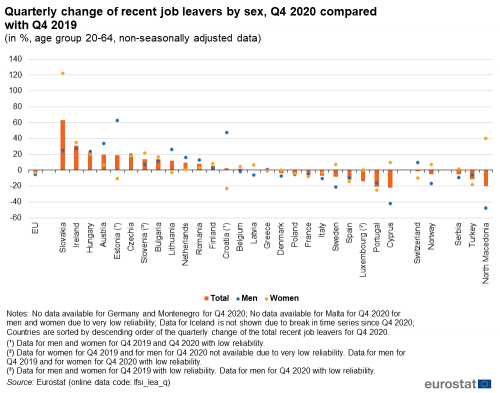
The next figure of the article (i.e. Figure 6) displays the change between Q4 2019 and Q4 2020 in the number of men and women who had left their job recently. At the EU level, the number of men in this situation decreased by -5.1 %, whereas the number of women dropped by -2.8 %.
Source: Eurostat (lfsi_lea_q)
All in all, the number of women recent job leavers was larger in Q4 2020 than the number recorded in Q4 2019 in more than half of the Member States (14 countries out of 24 with available data). Slovakia was the Member State to record the largest increase in the number of women recent job leavers: two times more women in this category in Q4 2020 than in Q4 2019. It is also worth mentioning that Slovakia had the largest difference between the quarterly change for men and women. In this country, men who had left their job recently in Q4 2020 were with one quarter more (+24.8 %) than in Q4 2019, while the quarterly change for women was +122.1 % (i.e. 97.3 persentage points higher). Following Slovakia, by a large distance, the number of women recent job leavers increased the most in Ireland (+35.1 %) and Slovenia (+21.6 %, low reliability). On the opposite side of the scale, nine EU countries had a lower number of women recent job leavers in Q4 2020 than in Q4 2019, with the largest reductions found in Spain (-14.5 %), Croatia (-23.1 %, low reliability) and Portugal (-25.2 %). Finally, Denmark had the same number in Q4 2019 and Q4 2020.
The number of men among recent job leavers decreased in 10 EU countries. The decrease for men was biggest in Portugal (-16.2 %), Sweden (-21.3 %) and Cyprus (-42.2 %). Out of the 14 EU countries, which had an increase in the number of recent job leavers from Q4 2019 to Q4 2020, Estonia (+63.0 %, low reliability), Croatia (+47.5 %, low reliability) stand out as the countries to record the most sizable increases but the results for them are with low reliability. Following Estonia and Croatia, the increase for men was the highest in Austria (+34.0 %), Ireland (+27.6 %) and Lithuania (+26.2 %).
Ratio of recent job leavers to recent job starters
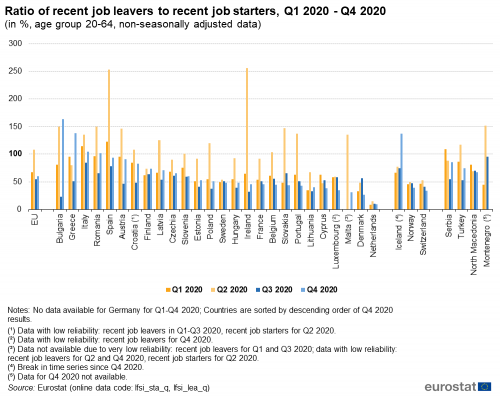
This section of the article aims to answer whether recent job leavers were more than recent job starters throughout 2020. As already mentioned at the beginning, at the EU level recent job leavers in Q2 2020 were more than recent job starts. Figure 7 confirms: the ratio of the number of recent job leavers to the number of recent job starters in Q2 2020 was 108.3 %, in other words in this quarter recent job leavers were 8.3 % more than those who started work recently.
Source: Eurostat (lfsi_sta_q), (lfsi_lea_q)
This phenomenon was observed already in Q1 2020 in Italy and Spain, where the number of recent job leavers was 23.0 % and 14.4 % respectively higher than the number of recent job starters (ratios of 123.0 % and 114.4 %).
Following that, in Q2 2020, 14 Member States (out of 26 with available data), had a ratio surpassing 100 %, i.e. these countries had more recent job leavers than recent job starters. The highest ratios were in Spain (253.1 %) and Ireland (255.8 %) where the number of recent job leavers nearly tripled those of recent job starters.
In Q3 2020, in all EU countries, the ratio dropped below 100 % with lower levels of recent job leavers than recent job starters. Then, in the final quarter of 2020 (Q4 2020), four Member States afloat above the 100 % margin, with a higher number of recent job leavers than recent job starts. These were Romania, Italy, Greece and Bulgaria, where people who had left their job recently were respectively 2.2 %, 4.5 %, 37.9 % and 63.3 % more than the newly employed.
Source data for tables and graphs
Data sources
All figures in this article are based on quarterly results from the European Union Labour Force Survey (EU-LFS).
Source: The European Union Labour Force Survey (EU-LFS) is the largest European household sample survey providing mostly quarterly and annual results on labour participation of people aged 15 and over as well as on persons outside the labour force. It covers residents in private households. Conscripts in military or community service are not included in the results. The EU-LFS is based on the same target populations and uses the same definitions in all countries, which means that the results are comparable between countries.
European aggregates: EU refers to the sum of the EU-27 Member States. If data is unavailable for a country, the calculation of the corresponding aggregates is computed with estimates. Such cases are indicated.
Country note: In Germany, from the first quarter of 2020 onwards, the Labour Force Survey (LFS) is part of a new system of integrated household surveys. Unfortunately, technical issues and the COVID-19 crisis has had a large impact on data collection processes, resulting in low response rates and a biased sample. For this reason, additional data from other integrated household surveys has been used in addition to the LFS subsample, to estimate a restricted set of indicators for the first three quarters of 2020, for the production of LFS Main Indicators. These estimates have been used for the publication of German results, but also in the calculation of EU and EA aggregates. By contrast, EU and EA aggregates published in the Detailed quarterly results (showing more and different breakdowns than the LFS Main Indicators) have been computed using only available data from the LFS subsample. As a consequence, small differences in the EU and EA aggregates in tables from both collections may be observed. For more information, see here.
For more information on recent job starters and leavers, please consult pages 22, 41-43 and 80-82 from EU Labour Force Survey Explanatory Notes
Also, five different articles on detailed technical and methodological information are available from the overview page of the online publication EU Labour Force Survey.
Context
The COVID-19 health crisis hit Europe in January and February 2020, with the first cases confirmed in Spain, France and Italy. COVID-19 infections have now been diagnosed in all European Union Member States. To fight the pandemic, EU Member States have taken a wide variety of measures. From the second week of March, most countries closed retail shops apart from supermarkets, pharmacies and banks. Bars, restaurants and hotels have also been closed. In Italy and Spain, non-essential production was stopped and several countries imposed regional or even national lock-down measures which further stifled the economic activities in many areas. In addition, schools were closed, public events were cancelled and private gatherings (with numbers of persons varying from 2 to 50) were banned in most Member States.
The large majority of the prevention measures were taken during mid-March 2020 and most of the measures and restrictions were kept for the whole period of April and May 2020. The first quarter of 2020 is consequently the first quarter in which the labour market across the EU has been affected by COVID-19 measures taken by the Member States.
Employment and unemployment as defined by the ILO concept are, in this particular situation, not sufficient to describe the developments taking place in the labour market. In this first phase of the crisis, active measures to contain employment losses led to absences from work rather than dismissals, and individuals could not search for work or were not available due to the containment measures, thus not counting as unemployed.
Explore further
Other articles
Database
Thematic section
Selected datasets
</methodology>
