Inland waterway transport statistics by product category
Data extracted in June 2023
Planned article update: September 2024
Highlights
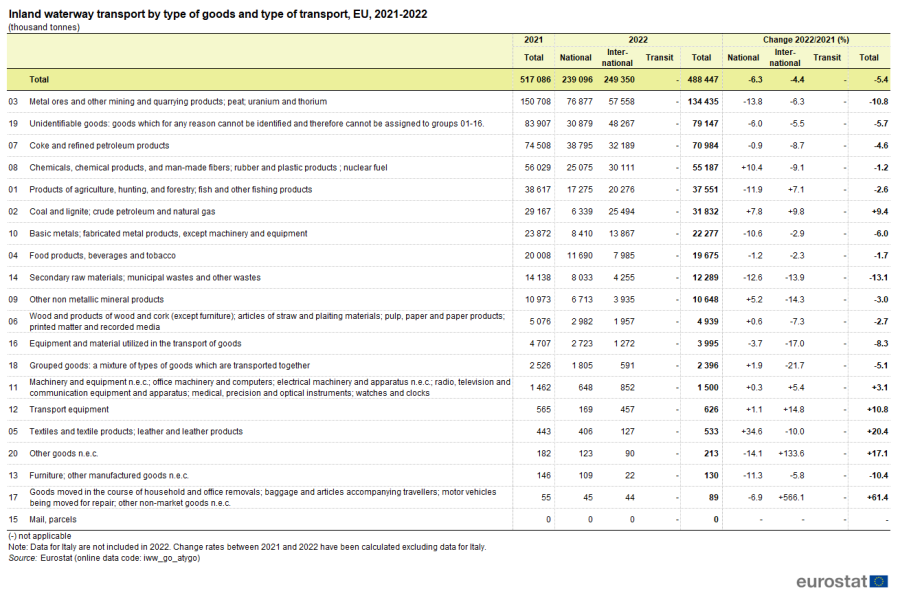
In 2022, the total volume of goods transported on European inland waterways was 488 million tonnes, a decrease of 5.4 % compared with 2021.
'Metal ores and other mining and quarrying products' was the main product category transported on EU inland waterways in 2022, accounting for 23 % of the total tonne-kilometres performed for all products and 28 % of the total tonnes transported.
The Netherlands, Germany and Belgium figure in the top of the international country flows for the two main product categories transported.
Source: Eurostat - (iww_go_atygo)
This article presents inland waterway goods transport in the European Union (EU) and other countries connected to the EU inland waterway network. It focuses on the main products transported, based on annual data for 2022 and comparisons with the previous year. For an overview on the annual and quarterly inland waterway transport, please refer to the Statistics Explained article Inland waterway freight transport - quarterly and annual data.
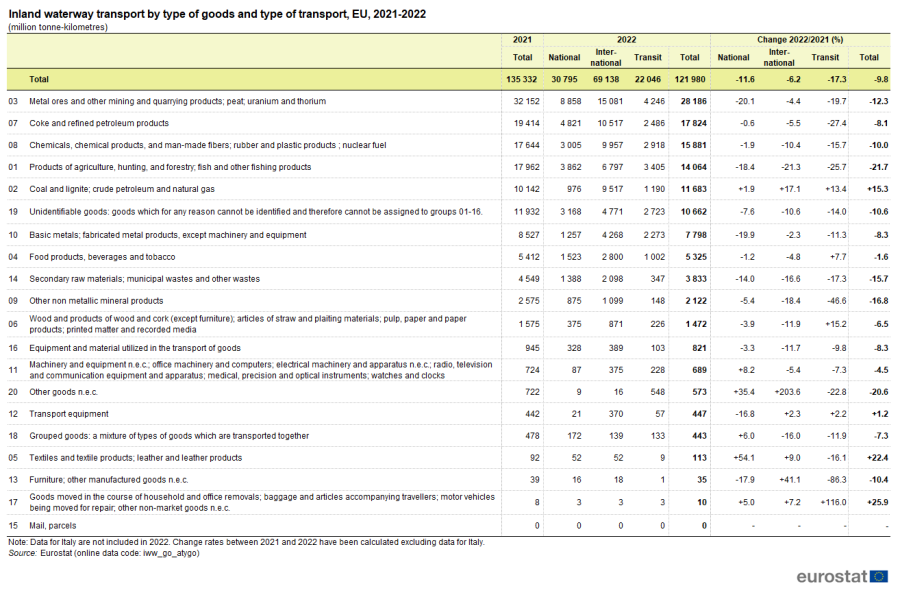
In 2022, the total volume of goods transported on European inland waterways was 488 million tonnes, a decrease of 5.4 % compared with the previous year. The total transport performed reached 122 billion tonne-kilometres, down 9.8 % from the previous year (Table 1). The main product categories transported by inland waterways were 'metal ores and other mining and quarrying products' and 'coke and refined petroleum products'. The European countries with the largest inland waterway transport for all product categories were the Netherlands and Germany.
Full article
'Metal ores and other mining and quarrying products' and 'coke and refined petroleum products’ – top two product categories transported
'Metal ores and other mining and quarrying products; peat; uranium and thorium' (NST2007 division ‘03’) was the main product category transported on EU inland waterways in 2022, both in terms of tonne-kilometres (Table 1) and in terms of tonnes (Table 2). This product category accounted for nearly one fourth (23 %) of the tonne-kilometres performed in total for all products and more than one fourth (28 %) of total tonnes transported. However, a noticeable decrease in the metal ores transport performance in tonne-kilometres was recorded in 2022 compared with 2021 (-12.3 %). A substantial fall was also observed in the tonnes transported (-10.8 %). When looking into this product category in terms of the different types of transport, national transport showed the largest decrease in tonne-kilometres (-20.1 %), followed by transit transport (-19.7 %). International transport registered a more moderate decrease by 4.4 %. When analysing the tonnes transported in 2022, national transport significantly decreased by 13.8 %, while international transport declined by 6.3 % compared with 2021.
(million tonne-kilometres)
Source: Eurostat - (iww_go_atygo)
'Coke and refined petroleum products' (NST2007 division ‘07’) constituted the second most significant product category transported on EU inland waterways in 2022, both in terms of tonne-kilometres and tonnes. It represented 15 % of the tonne-kilometres performed and of the total tonnes transported. The transported tonnage of this category was 47 % less than the tonnage of 'metal ores and other mining and quarrying products; peat; uranium and thorium'. Compared with 2021, transport of 'coke and refined petroleum products' showed a decrease for both tonnes (-4.6 %) and tonne-kilometres (-8.1 %).
For both the largest product categories for EU inland waterway transport, national transport accounted for the majority in terms of tonnes (57 % for ‘metal ores and other mining and quarrying products’ and 55 % for ‘coke and refined petroleum products’). When looking at tonne-kilometres, international transport accounted for 54 % of total tonne-kilometres travelled for ‘metal ores and other mining and quarrying products’ (national transport represented 31 %) and 59 % for ‘Coke and refined petroleum products’ (national transport represented 27 %). This is a reflection of international journeys being generally longer than national ones.
The third most important product category transported on EU inland waterways in 2022 in terms of tonnes was 'chemicals, chemical products, and man-made fibers; rubber and plastic products; nuclear fuel' (NST2007 division ‘08’). The transported tonnage of this category was 22 % less than the tonnage of 'coke and refined petroleum products'.
(thousand tonnes)
Source: Eurostat - (iww_go_atygo)
The highest growth between 2021 and 2022 was recorded for the product category ‘goods moved in the course of household and office removals; baggage and articles accompanying travellers; motor vehicles being moved for repair; other non-market goods n.e.c.’ (NST2007 division ‘17’), with +61.4 % for tonnes transported and +25.9 % for tonne-kilometres performed. From 2021 to 2022, only three other product categories ‘Textiles and textile products; leather and leather products’ (NST2007 division ‘05’), ‘Transport equipment’ (NST2007 division ‘12’) and ‘Coal and lignite; crude petroleum and natural gas’(NST2007 division ‘02’) recorded growths both in terms of tonnes transported (+20.4 %, +10.8 %, and +9.4% nbsp;%, respectively) and tonne-kilometres performed (+22.4 %, +1.2 %, and +15.3 %, respectively).
Some product categories reported decreases in 2022 compared with 2021 in terms of tonne-kilometres performed, the largest of them recorded by ‘Products of agriculture, hunting, and forestry; fish and other fishing products’ (NST2007 division ‘01’), down 21.7 %; ‘Other goods n.e.c.’ (NST2007 division ‘20’) that declined by 20.6 %; and ‘Other non-metallic mineral products’(NST2007 division ‘09’) that decreased by 16.8 %. The biggest decreases in terms of tonnes transported were presented by ‘Secondary raw materials; municipal wastes and other wastes’(NST2007 division ‘14’), down 13.1 %; ‘Metal ores and other mining and quarrying products; peat; uranium and thorium’(NST2007 division ‘03’) which declined by 10.8 %, and ‘Furniture; other manufactured goods n.e.c.’ (NST2007 division ‘13’) that decreased by 10.4 %.
The Netherlands, Germany and Belgium dominated transport of ‘metal ores and other mining and quarrying products'
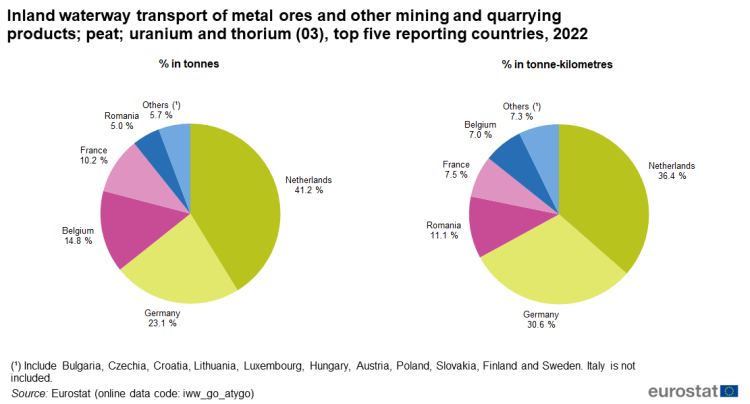
In 2022, the main country involved in the EU inland waterway transport of ‘metal ores and other mining and quarrying products’ was the Netherlands, which alone accounted for 41.2 % of the tonnes transported and 36.4 % of the tonne-kilometres performed (Figure 1). Germany came second on both measures, with 23.1 % of the tonnes transported and 30.6 % of the tonne-kilometres performed. This is not surprising, as both countries have extensive inland waterway networks that play an important role in their national transport systems. These networks are also connected to major ports such as Rotterdam and Hamburg, which are key hubs for imports to and exports from the EU.

Source: Eurostat - (iww_go_atygo)
The next three countries in the top five were Belgium, France and Romania. However, the ranking of these three countries was different when looking at tonnes or tonne-kilometres. In terms of tonnes transported, Belgium came third with a share of 14.8 %, followed by France (10.2 %) and Romania (5.0 %). In terms of tonne-kilometres performed, Romania was in third place with a share of 11.1 %, followed by France (7.5 %) and Belgium (7.0 %) (Figure 1).
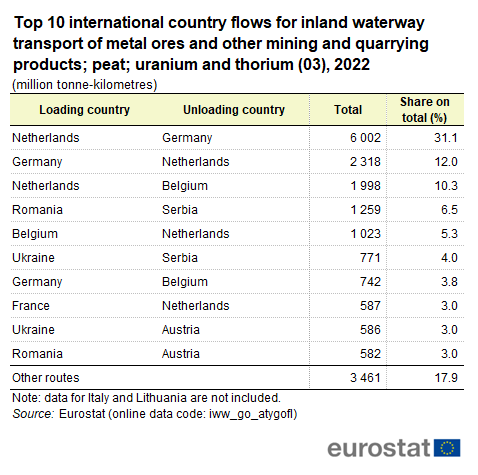
The main route for inland waterway transport of ‘metal ores and other mining and quarrying products’, in terms of tonne-kilometres performed, was between the Netherlands and Germany, accounting for more than two fifths (43.0 %) of the EU total (Table 3). The main flow was the one from the Netherlands to Germany (31.1 %), while the same route in the opposite direction, from Germany to the Netherlands, was in second place (12.0 %). The Netherlands was the loading or unloading country in four of the top five country-to-country flows and in five of the top 10 country-to-country flows for ‘metal ores and other mining and quarrying products’. Germany and Belgium were each the loading or unloading country in three of the top 10 flows. Romania, Serbia, Ukraine and Austria each made two appearances in the top 10 flows. France appeared once in the top 10 flows. Three flows involved non-EU Member States, namely Serbia and Ukraine. The flows from Romania and Ukraine to Serbia were in fourth and sixth places, respectively, while the flow from Ukraine to Austria was in ninth place.
(million tonne-kilometres)
Source: Eurostat - (iww_go_atygofl)
When looking at volumes in tonnes, the main route observed was also between the Netherlands and Germany, accounting for nearly a half (49.4 %) of the EU total (Table 4). The main country-to-country flow was the one from the Netherlands to Germany (37.8 %). The top 10 flows in terms of tonnes were dominated by four countries: the Netherlands and Germany (with five appearances each), Belgium (with four appearances) and France (with two appearances). The picture is completed by the flows from Slovakia to Austria in the seventh place and from Romania to Serbia in the eighth place.
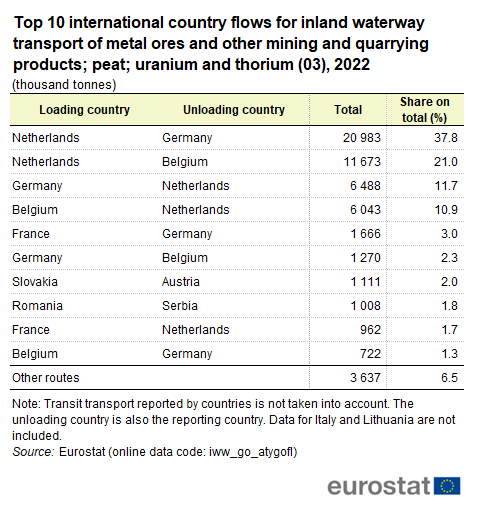
(thousand tonnes)
Source: Eurostat - (iww_go_atygofl)
The Netherlands, Germany and Belgium were also the top transporters of ‘coke and refined petroleum products'
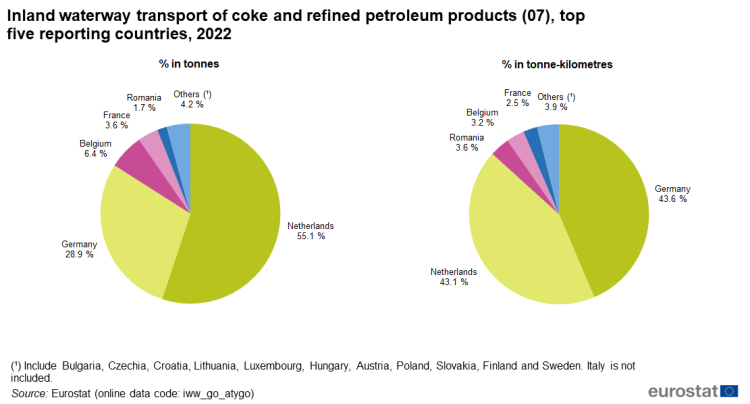
In 2021, the main countries involved in the EU inland waterway transport of ‘coke and refined petroleum products’ were, as in previous years, the Netherlands and Germany (Figure 2). The Netherlands ranked first with 55.1 % of the total tonnes transported in Europe, and second with 43.1 % of the tonne-kilometres performed. Germany appears in first place concerning tonne-kilometres performed, with 43.6 %, and in second place concerning tonnes transported, with 28.9 %. This reflects the longer distances performed by vessels passing through German inland waterways. In terms of tonnes transported, Belgium ranked third with a share of 6.4 %, followed by France (3.6 %) and Romania (1.7 %). In terms of tonne-kilometres performed, Romania, with a share of 3.6 %, was in third place, followed by Belgium (3.2 %) and France (2.5 %).
Source: Eurostat - (iww_go_atygo)
In terms of tonne-kilometres performed for ‘coke and refined petroleum products’, the flows between the Netherlands, Germany and Belgium occupied the first five of the top 10 country-to-country flows, as well as the seventh flow, and accounted for 71.5 % of total tonne-kilometres performed on inland waterways in Europe (Table 5). The main flow is from the Netherlands to Germany, accounting for 19.8 % of the total tonne-kilometres performed. Switzerland and France also appear in the top 10 as unloading countries receiving goods loaded in Germany, the Netherlands and Belgium.
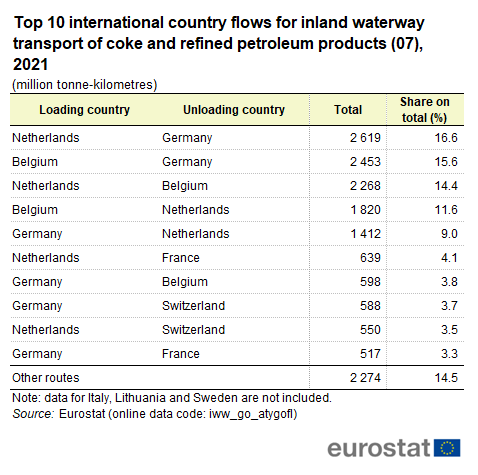
(million tonne-kilometres)
Source: Eurostat - (iww_go_atygofl)
When looking at volumes of ‘coke and refined petroleum products’ transported in tonnes, the picture is like the one for tonne-kilometres (Table 6). There is a predominance of the Netherlands, Germany and Belgium in the top 10 flows. The eight first flows involved one of these three countries. France appeared twice among unloading countries and Switzerland once. The flows from Austria to Hungary and from Romania to Moldova completed the top 10 in the last two positions. The main flow is from the Netherlands to Belgium, accounting for 40.7 % of the total tonnes transported. This flow was third in terms of tonne-kilometres (13.1 %), indicating shorter journey lengths between the two countries.
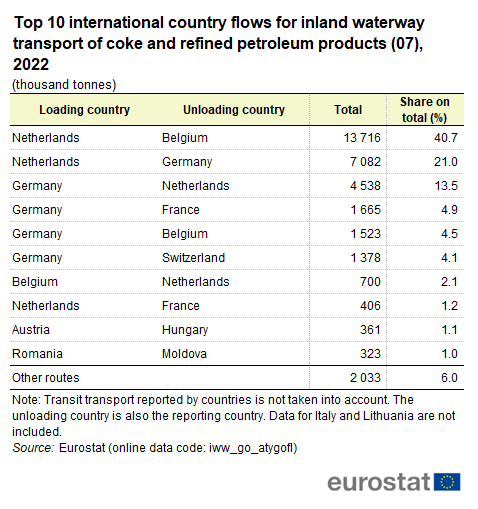
(thousand tonnes)
Source: Eurostat - (iww_go_atygofl)
Source data for tables and figures (MS Excel)
Data sources
All figures presented in this article have been extracted from the Eurostat online inland waterways transport database. The related datasets are collected according to Regulation (EU) No 2018/974 of the European Parliament and of the Council on statistics of goods transport by inland waterways. Regulation (EU) No 2018/974 consolidated the initial Regulation (EC) No 1365/2006 on statistics of goods transport by inland waterways and all its implementing and amending legal acts: Commission Regulation (EC) No 425/2007 (implementing regulation), Commission Regulation (EC) No 1304/2007 (amending regulation) and Regulation (EU) No 2016/1954 (amending regulation).
Regulation (EU) 2018/974 states that data must be supplied by all Member States for which the total volume of goods transported annually by inland waterways exceeds one million tonnes. Currently, 17 Member States provide data on mandatory or voluntary basis: Belgium (BE), Bulgaria (BG), Czechia (CZ), Germany (DE), France (FR), Croatia (HR), Italy (IT), Lithuania (LT), Luxembourg (LU), Hungary (HU), the Netherlands (NL), Austria (AT), Poland (PL), Romania (RO), Slovakia (SK), Finland (FI) and Sweden (SE). The legal act requires only the provision of a reduced annual dataset for countries exceeding the one million tonnes threshold but where no international or transit traffic exists.
Definitions National inland waterway transport: Inland waterway transport between two ports of a national territory irrespective of the nationality of vessel.
International inland waterway transport: Inland waterway transport between two ports located in different national territories.
Transit inland waterway transport: Inland waterway transport through a national territory between two ports both located in another national territory or national territories provided that in the total journey within the national territory there is no transshipment.
EU includes data for all Member States providing data.
Calculation of EU aggregates: In Table 2, EU international and total goods transport in tonnes is calculated excluding double counting. EU total international transport is calculated by adding the international unloadings plus the international loading for which the unloading country is not in the EU. Then, the EU total transport is calculated by adding national transport and the total international transport.
For transit transport measured in tonnes, an EU aggregate equal to the sum of the country figures is not valid because volumes of freight transported are reported by all transit countries through which the transport takes place before reaching the unloading destination. Therefore, the same volume may be reported two, three, or more times without the possibility to eliminate multiple counting. At the same time, figures for transit transport are included in the EU national or international transport as they are reported not only by the transit countries but also by the loading and unloading countries. Therefore, for the EU total volume of freight, it is enough to sum the total national and international figures.
Calculation of country flows: In Tables 3 and 5, presenting the tonne-kilometres results, international and transit transport reported by the Member States are taken into account. In Tables 4 and 6, presenting the results in tonnes, only international transport reported by the Member States is taken into account in order to avoid double counting. In addition, the loading country in these two tables also corresponds to the reporting country. Data from Italy, Lithuania, Finland, Sweden and the United Kingdom are not included in these tables.
Country-specific notes
Bulgaria: Transit data supplied include Romanian national IWW transport data equivalent to Bulgarian transit transport.
Italy: No data available for 2022. Data are delivered on a voluntary basis. Only a simplified annual dataset is provided.
Lithuania: Data are delivered on a voluntary basis. Only a simplified annual dataset is provided.
Romania: Transit data supplied include Bulgarian national IWW transport data equivalent to Romanian transit transport.
Sweden: No traffic was conducted by Swedish registered vessels certified for inland waterway traffic in Sweden since no certificates have been issued at the Swedish Transport Agency.
Breakdown by group of goods
The NST 2007 classification is available on RAMON.
Symbols
- ":" not available
- "-" not applicable or real zero
- "0" less than half of the unit used and thus rounded to zero
Context
The content of this statistical article is based on data collected within the framework of Regulation (EU) 2018/974 of the European Parliament and of the Council on statistics of goods transport by inland waterways.
Direct access to
- Transport, see table under 'Inland waterways transport':
- Inland waterways transport (t_iww)
- Goods transport by inland waterways (ttr00007)
- Transport, see:
- Inland waterways transport (iww)
- Inland waterways transport infrastructure (iww_if)
- Inland waterways transport equipment (iww_eq)
- Inland waterways transport - Enterprises, economic performances and employment (iww_ec)
- Inland waterways transport measurement - goods (iww_go)
- Inland waterways - accidents (iww_ac)
- Regulation (EU) No 2018/974 of the European Parliament and of the Council on statistics of goods transport by inland waterways
- Summaries of EU legislation: EU statistics of goods transport by inland waterways
- Regulation (EC) No 1365/2006 on statistics of goods transport by inland waterways
- Commission Regulation (EC) No 425/2007 (implementing regulation)
- Commission Regulation (EC) No 1304/2007 (amending regulation)
- Regulation (EU) No 2016/1954 (amending regulation)