Households - statistics on financial assets and liabilities
Data extracted on 26 October 2023.
Planned article update: November 2024.
Highlights
Total financial assets of households in the EU were valued at €33 546 billion in 2022, which was 3.6 times as high as the value of their financial liabilities, which stood at €9 350 billion.
In 2022, the assets of households in the EU were composed mainly of currency and deposits (34.1 %), equity and investment fund shares (32.8 %), and insurance, pensions and standardised guarantees (27.8 %), whereas liabilities largely consisted of loans (93.2 %).
(%, change over previous year)
Source: Eurostat (nasa_10_f_bs)
This article focuses on the annual stock of financial assets and liabilities for households and non-profit institutions serving households (NPISH). Note that there are complementary articles that provide similar information on non-financial corporations and financial corporations. A comparison between these sectors (excluding general government) is available in the article on non-financial corporations.
Across the European Union (EU), the financial assets of households mainly comprise equity and investment fund shares, currency and deposits, and assets held with life insurance companies and pension funds. The financial liabilities of households mainly comprise mortgages and other types of loans.
The data presented in this article relate to a detailed set of consolidated financial balance sheets for households and NPISH, as released by Eurostat. Note that statistics detailing the financial accounts may be consolidated or non-consolidated; the latter record not only transactions and positions between sectors (in other words, households and NPISH with other actors in the economy) but also transactions and positions within the same sector (in other words, between households and/or NPISH).
This article provides an analysis of financial assets and liabilities in the EU and the euro area (EA), as well as for individual EU Member States, one of the EFTA countries (Norway) and two of the enlargement countries (Albania and Türkiye) for the latest year available (2022). Some indicators are presented in relation to gross domestic product (GDP), which is beneficial for making cross-country comparisons, especially between countries of different size.
In this article, data for the households sector always include information for the NPISH sector. It should be noted that the size of the NPISH sector is relatively small compared with the household sector, accounting for around 2 % of the combined total financial assets and liabilities of these two sectors.
Full article
Assets and liabilities
Total financial assets of households in the EU were valued at €33 546 billion in 2022, 3.6 times as high as their financial liabilities, which were valued at €9 350 billion
Total financial assets of households in the EU were valued at €33 546 in 2022. This was 3.6 times as high as the value of their financial liabilities that stood at €9 350 billion, resulting in a net difference of €24 196 billion (or 72.1 % of the value of the assets). This was lower than the same value in 2021, which stood at €26 193 billion (or 74.1 %).
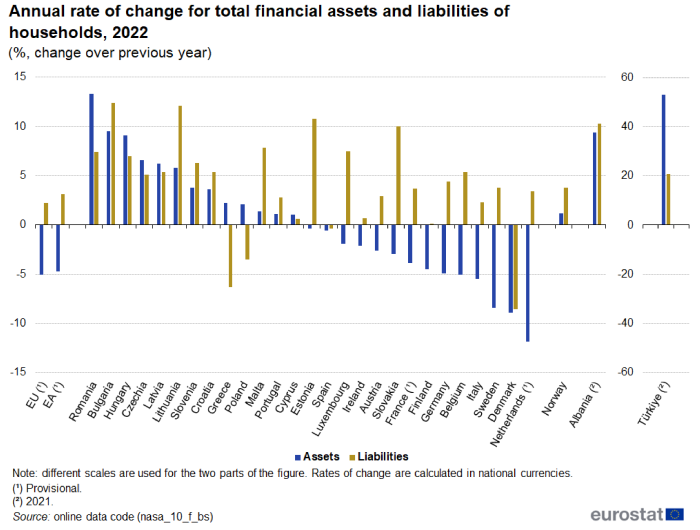
The annual rate of change for total financial assets and liabilities of households is presented in Figure 1. The EU recorded growth in 2022 of 2.2 % for liabilities and a decrease of 5.1 % for assets.
It should be noted that rates of change are calculated in national currencies. In the EU Member States, the highest annual growth rates for assets in 2022 were observed in Romania (13.3 %), Bulgaria (9.5 %) and Hungary (9.1 %). For liabilities, the Member States with the highest annual growth rates were Bulgaria (12.4 %), Lithuania (12.1 %), Estonia (10.8 %) and Slovakia (10.0 %). Among the non-EU countries included in Figure 1, Türkiye (2021 data) had even higher annual growth rates: 53.2 % for assets and 20.8 % for liabilities. Among the Member States, 14 had a negative annual rate of change for assets, with the largest negative rates recorded in the Netherlands (-11.9 %), Denmark (-8.9 %) and Sweden (-8.4 %). For liabilities, negative annual rates of change were registered for Denmark (-8.6 %), Greece (-6.3 %), Poland (-3.5 %) and Spain (-0.4 %).
The Netherlands had the largest difference between the rates of change for assets and liabilities, 15.3 percentage points (pp), resulting from a decrease in assets and an increase in liabilities. Differences of at least 10.0 pp were also recorded for Slovakia, Sweden, Estonia and Belgium, also all with a decrease in assets and an increase in liabilities. The largest difference resulting from an increase in assets and a decrease in liabilities (8.5 pp difference) was observed in Greece. Among the non-EU countries, a particularly large difference was recorded in Türkiye (2021 data), as the increase in assets was 32.4 pp larger than that for liabilities.

(%, change over previous year)
Source: Eurostat (nasa_10_f_bs)
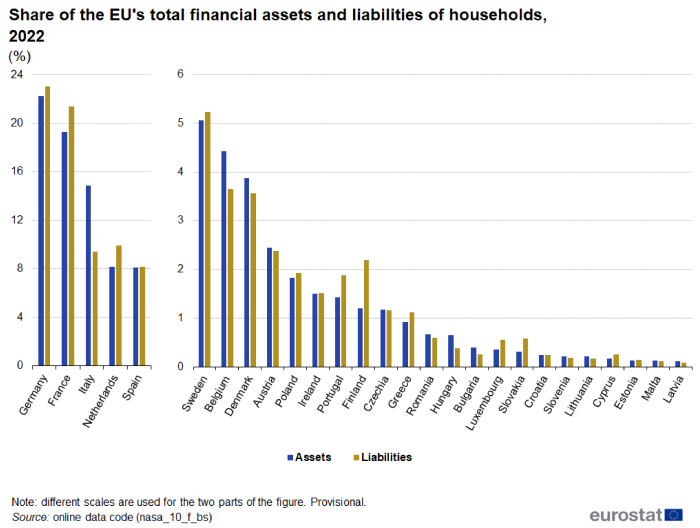
The share of each EU Member State in the EU's total financial assets and liabilities of households in 2022 is presented in Figure 2. Germany held more than one fifth of the financial assets (22.2 %) and liabilities (23.0 %) of households in the EU, while France's shares were just under a fifth for assets (19.3 %) and just over a fifth for liabilities (21.4 %). These two were followed by Italy with 14.9 % of financial assets and a notably lower share (9.4 %) of financial liabilities and the Netherlands with 8.1 % of financial assets and 9.9 % of financial liabilities. Apart from Spain and Sweden, the other Member States held less than 5.0 % each. Five Member States – Germany, France, Italy, the Netherlands and Spain – collectively accounted for 72.6 % of the financial assets and 71.9 % of the financial liabilities of households in the EU.
(%)
Source: Eurostat (nasa_10_f_bs)
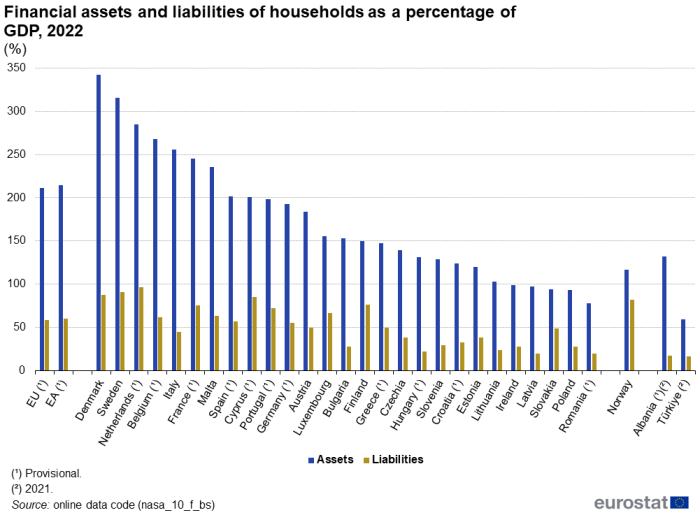
Figure 3 presents the financial assets and liabilities of households as a percentage of GDP. In 2022, these assets were valued in the EU at 210.9 % of GDP, while these liabilities were valued at 58.8 % of GDP, resulting in net assets equivalent to 152.1 % of GDP.
In Slovakia and Finland, households' financial assets were, respectively, 1.9 and 2.0 times as high as their liabilities, the two lowest such ratios among the EU Member States. Elsewhere, financial assets were at least 3.0 times as high in 22 Member States and at least 4.0 times as high in eight Member States. The three highest ratios were in Bulgaria (5.6 times as high), Italy (5.7 times as high) and Hungary (6.0 times as high).
The value of households' financial assets as a percentage of GDP was above 100.0 % in 2022 for all EU Member States except for Ireland, Latvia, Slovakia, Poland and Romania. This ratio was highest in Denmark (341.9 %) and Sweden (315.9 %). However, the value of liabilities as a percentage of GDP was below 100.0 % for all Member States. It was highest in the Netherlands (96.4 %).
(%)
Source: Eurostat (nasa_10_f_bs)
Structure of assets and liabilities
The largest shares of households' financial assets were equity and investment fund shares, currency and deposits, and insurances, pensions and standardised guarantees
The vast majority of households' financial liabilities were loans
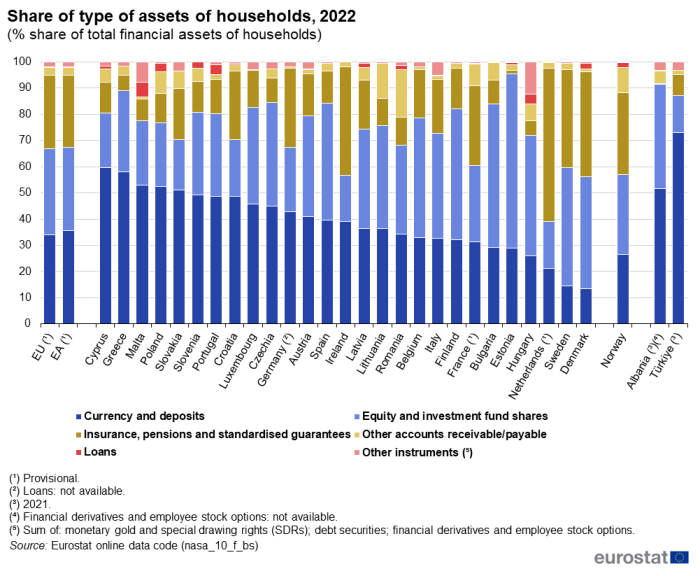
In this article, financial assets and liabilities are presented for five main types of instruments: currency and deposits; loans; equity and investment fund shares; insurances, pensions and standardised guarantees; and other accounts receivable/payable. Three other types of assets and liabilities accounted for small shares of total financial assets of EU households in 2022 and are grouped together in Figure 4 as other instruments (with a collective share of 1.8 % of the total): monetary gold and special drawing rights (SDRs); debt securities; and financial derivatives and employee stock options. Notably, the category of monetary gold and SDRs was valued at zero for all EU Member States for the households sector.
Out of the total financial assets of EU households in 2022, currency and deposits accounted for the largest share (34.1 %) – see Figure 4. This was closely followed by equity and investment fund shares (32.8 %), and insurance, pensions and standardised guarantees (27.8 %). Smaller shares were recorded for other accounts receivable/payable (3.1 %), other instruments (1.8 %) and loans (0.3 %).
Among the EU Member States, the main types of assets held by households in 2022 were generally currency and deposits, equity and investment fund shares, and insurance, pensions and standardised guarantees.
- The category of currency and deposits was the largest instrument in 14 Member States and accounted for over half of the total in five of them: Cyprus (59.7 %), Greece (58.0 %), Malta (52.9 %), Poland (52.3 %) and Slovakia (51.0 %).
- The category of equity and investment fund shares was the largest instrument in 11 Member States, where their share ranged between 37.7 % and 66.4 %.
- The category of insurance, pensions and standardised guarantees was the largest instrument in two Member States: the Netherlands (58.6 %) and Ireland (41.5 %).
Loans accounted for 93.2 % of total financial liabilities of EU households in 2022. Other accounts receivable/payable accounted for the rest (6.8 % of the total). The main type of households' liabilities in each of the EU Member States in 2022 was loans, accounting for at least 82.1 % of the total except in Romania where the share was 71.3 %. The lowest contributions from other accounts receivable/payable were 0.0 % in Luxembourg and 1.1 % in Germany; the highest shares were 16.1 % in Cyprus, 16.2 % in Bulgaria, 16.3 % in Portugal and 19.4 % in Romania.
(% share of total financial assets of households)
Source: Eurostat (nasa_10_f_bs)
Developments
The value of households' financial assets as a percentage of GDP decreased in all EU Member States
Total financial assets of EU households grew almost continuously during the period 2012–2021, falling only in 2018 (down 0.5 %). This development changed in 2022, when the value fell 5.1 %. Their total value increased from €22 525 billion in 2012 to €35 345 billion in 2021 (a 56.9 % overall increase) before falling to €33 546 in 2022 (48.9 % above the 2012 value).
Total financial liabilities fell slightly between 2012 and 2014 but increased each year thereafter through to 2022. Total financial liabilities increased from €7 608 billion in 2012 to €9 350 billion in 2022, an overall increase of 22.9 %.
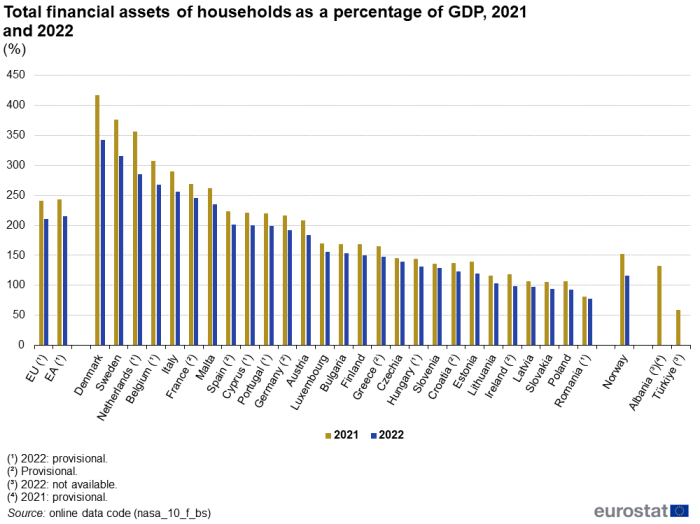
The value of households' financial assets as a percentage of GDP was 30.5 pp lower in 2022 than in 2021 in the EU (see Figure 5). This ratio decreased in all EU Member States, most notably (in percentage point terms) in Denmark and the Netherlands; it also decreased in Norway.
The value of households' financial liabilities as a percentage of GDP decreased 3.7 pp in the EU between 2021 and 2022. This ratio decreased in 25 EU Member States, most notably in Denmark; it also decreased greatly in Norway. By contrast, increases were observed in Luxembourg and Slovakia.
(%)
Source: Eurostat (nasa_10_f_bs)
Source data for tables and graphs
Data sources
The compilation of financial accounts follows the European System of Accounts 2010 (ESA 2010).
The financial account and balance sheet
Eurostat's website includes detailed financial accounts by country. Financial accounts are published in consolidated and non-consolidated forms; within this article, the former are presented. As a rule, the accounting entries in ESA 2010 are non-consolidated, as a consolidated financial account requires information on the counterpart grouping of institutional units. Note that data for the EU and EA aggregates are calculated as a sum of data for EU Member States; no adjustment is made for flows between Member States.
The household sector
Data for 2012 and more recent years are available separately for the household sector and for the NPISH sector. For data before 2012, these sectors were combined under a single heading. The NPISH sector is relatively small.
In general, sole proprietorships and most partnerships that do not have an independent legal status are considered to be part of the household sector, rather than as corporations (financial or non-financial). However, there are sometimes practical difficulties in delineating 'quasi-corporations' (unincorporated businesses with the characteristics of companies) between corporations on one hand and the household sector on the other. This may influence the scope and comparability of the data presented as well as the internal consistency of the full set of accounts.
Context
Financial accounts form part of the national accounting framework and are compiled in the EU in accordance with ESA 2010. They are a significant tool for analysing financial developments and policy decisions, and provide key statistical information on financial transactions, other financial flows, and financial balance sheets by institutional sector, including the household sector. Particular issues relating to the household sector include the growth and level of indebtedness, one of the main origins of the global financial and economic crisis.
Financial accounts show how borrowers obtain resources by incurring liabilities or reducing assets, and how lenders allocate their surpluses by acquiring assets or reducing liabilities. Financial assets held by households form an important part of overall wealth and are also an important source of revenue or property income (such as interest payments and dividends). The structure of financial assets held by households may be used in economic analyses to study issues such as asset bubbles, or to assess financial risk, vulnerability and welfare.
Direct access to
- Financial flows and stocks (nasa_10_f)
- Financial balance sheets - annual data (nasa_10_f_bs)