Statistics Explained

Extra-EU trade by invoicing currency


Data extracted in May 2022 (Figures 1-8) and May 2021 (Figures 9-15)

Planned update: 31 May 2023

Highlights


In 2020, the euro was the most used currency for EU exports with a share of 48% ahead of the US dollar with 29%.

The US dollar was the most used currency for imports into the EU with a share of 48% in 2020 ahead of the euro with 38%.

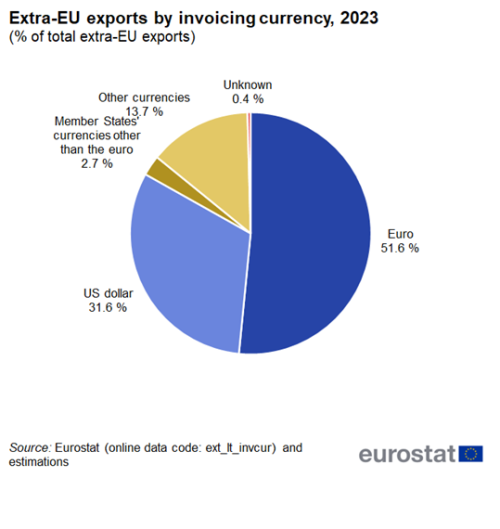
Extra EU imports and exports by invoicing currency 2020.png


Goods imported and exported by the European Union (EU) can be invoiced in a range of currencies. This article focuses on the trade in goods by invoicing currency (TIC) of the EU with countries outside the EU in 2020. It provides information about the share of trade declared in euro, US dollars, EU Member States' currencies other than the euro and currencies of countries outside the EU (further denoted as other currencies) for imports and exports.

The TIC data collection is only mandatory in even reference years. Therefore this article is split in two parts. The first part (Figures 1 to 8) deals with reference year 2021 for which data is available for 15 Member States and 7 other countries. The second part (Figures 9 to 15) deals with reference year 2020 but only presents data for the EU and its Member States.

This article is part of an online publication providing recent statistics on international trade in goods, covering information on the EU's main partners, main products traded, specific characteristics of trade as well as background information.


Full article


As the trade by invoicing currency data collection is only mandatary for even reference years, the data collection for reference year 2021 is not complete. The aggregate presented in Figures 1 to 8 contains only the following Member States: Germany, Estonia, Ireland, Greece, Spain, Cyprus, Latvia, Lithuania, the Netherlands, Poland, Portugal, Romania, Slovenia, Slovakia and Finland. These 15 Member States accounted for 61 % of EU imports and 59 % of EU exports. In addition to these 15 Member States, Figures 5 to 8 contain data for Montenegro, North Macedonia, Bosnia-Herzegovina, Kosovo*, Serbia (referred to as Western Balkan countries), Iceland and Turkey.


*This designation is without prejudice to positions on status, and is in line with UNSCR 1244/1999 and the ICJ Opinion on the Kosovo Declaration of Independence.


US dollar most used for EU imports, euro most used for EU exports in 2021

Comparing the euro to the US dollar shows that the euro is the leading currency for EU exports while the US dollar is the leading currency for EU imports. Moreover, between 2020 and 2021, shares for imports invoiced in US dollar increased by 1.6 percentage points (pp) which was more than the 0.3 pp increase for the euro (Figure 1).

Figure 1: Share of extra-EU imports by main invoicing currency, 2020-2021
Source: Eurostat (ext_lt_invcur) and DS-018995

In exports, the reverse was true, with the share for the US dollar increasing by just 0.8 pp while the share for the euro increased by 4.6 pp (Figure 2).

Figure 2: Share of extra-EU exports by main invoicing currency, 2020-2021
Source: Eurostat (ext_lt_invcur) and DS-018995

Large increase for share of primary goods invoiced in euro

When breaking down the shares of imports invoiced in euro by main product category there are small decreases for oil (-0.6 pp) and manufactured goods (-0.4 pp) and an 8.8 pp increase for primary goods other than oil (Figure 3).

Figure 3: Share of extra-EU imports invoiced in €
Source: Eurostat (ext_lt_invcur) and DS-018995

In exports, the increase for primary goods other than oil was even larger (11.1 pp) and there was also an increase for manufactured goods (4.0 pp) while for oil (-3.8 pp) the share of exports invoiced in euro decreased (Figure 4).

Figure 4: Share of extra-EU exports invoiced in €
Source: Eurostat (ext_lt_invcur) and DS-018995

Share of goods invoiced in euros highest in Slovenia

Figure 5 shows that among Member States, the shares of extra-EU imports invoiced in euro were highest in Slovenia (74.6 %) and Latvia (65.0 %) and lowest in Finland (19.1 %) and Ireland (22.1 %). In non-EU countries, the share of total imports invoiced in euro was above 80 % in Western Balkan countries and below 50 % in Iceland (41.5 %) and Turkey (28.5 %)

Figure 5: Imports by invoicing currency, 2021
Source: Eurostat (ext_lt_invcur)

Figure 6 shows that among Member States, the shares of extra-EU exports invoiced in euro were highest in Slovenia (87.0 %) and Lithuania (72.3 %) and lowest in Ireland (12.6 %). In non-EU countries, the share of total exports invoiced in euro was above 70 % in Western Balkan countries and below 50 % in Turkey (46.1 %) and Iceland (29.3 %).

Figure 6: Exports by invoicing currency, 2021
Source: Eurostat (ext_lt_invcur)

Trade invoiced in euro increases in Member States

Among Member States, the share of extra-EU imports invoiced in euro between 2020 and 2021 increased in 11 of the 15 Member States for which data was available (Figure 7). The largest increases were in Latvia (+9.4 pp) and Ireland (+8.1 pp) while there were sharp decreases for Finland (-10.4 pp) and Cyprus (-8.0 pp). In six of the seven non-EU countries shown, the share for euro decreased by between 0.2 pp (Iceland) and 2.9 pp (Turkey). Only North Macedonia recorded an increase of 1.4 pp.

Figure 7: Share of the € as invoicing currency for imports, 2020-2021
Source: Eurostat (ext_lt_invcur)

Among Member States, the share of extra-EU exports invoiced in euro between 2020 and 2021 increased in 11 of the 15 Member States for which data was available for both years (Figure 8). There were double-digit increases for Cyprus (15.9 pp), the Netherlands (13.9 pp) and Portugal (11.9 pp) while the largest decrease was seen in Estonia (-4.7 pp). In six of the seven non-EU countries shown, the share for euro decreased by between 1.8pp (Turkey) and 5.4 pp (Montenegro). Only North Macedonia recorded an increase of 1.0 pp.

Figure 8: Share of the € as invoicing currency for exports, 2020-2021
Source: Eurostat (ext_lt_invcur)

The remainder of this article presents data referring to the year 2020.

US dollar most used for EU imports, euro most used for EU exports in 2020

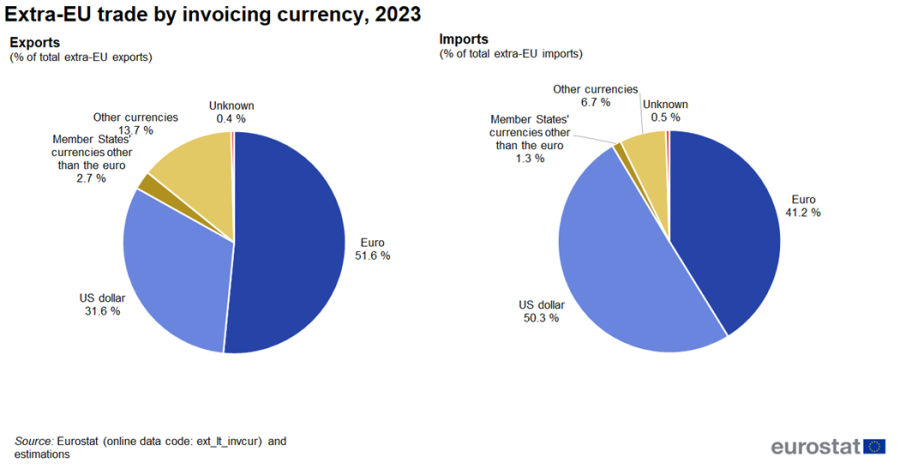
Figure 9 shows that in total extra-EU trade in goods (imports plus exports), the euro was the most used currency in 2020, with a share of 43 %. The US dollar followed with a share of 38 %. Member States' currencies other than the euro had a share of 2 %, the share of other currencies was 9 % while the currency was unknown for 8 % of trade. However, the shares are rather different when looking at imports and exports separately.

Figure 9: Extra-EU trade by invoicing currency, 2020
Source: Eurostat (ext_lt_invcur)

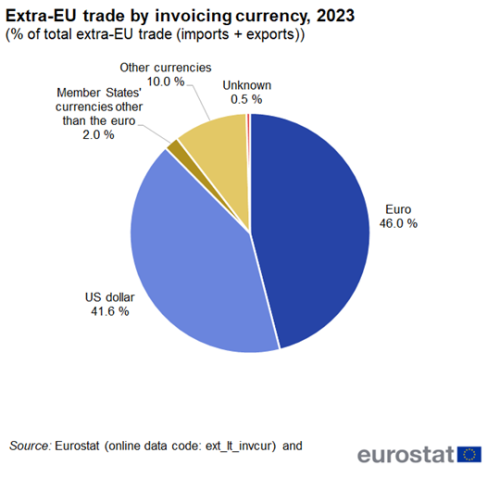
Figure 10 shows that the US dollar was the most used currency for imports into the EU in 2020, with a share of 48 %. The euro was the second most used currency with a share of 38 %. The share of Member States' currencies other than the euro was 2 %. Other currencies had a share of 5 % while for 7 % of imports the currency was unknown.

Figure 10: Extra-EU imports by invoicing currency, 2020
Source: Eurostat (ext_lt_invcur)


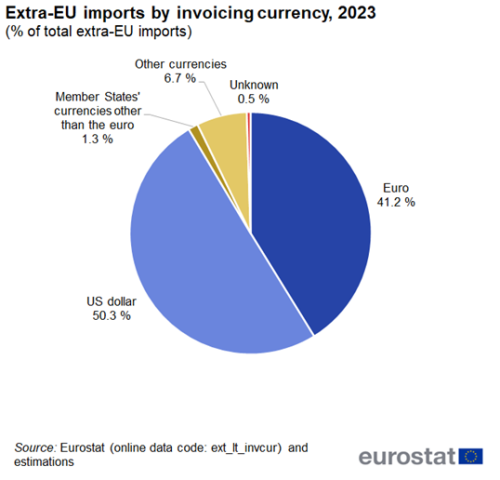
Compared with imports, the positions of the euro and the US dollar are reversed for EU exports (see Figure 11). The share for the euro in 2020 was 48 %, ahead of the US dollar with 29 %. Member States' currencies other than the euro had a share of 1 % and other currencies had a share of 12 %. For 10 % of exports the currency was unknown.

Figure 11: Extra-EU exports by invoicing currency, 2020
Source: Eurostat (ext_lt_invcur)

Slovenia had the highest share for the euro in both imports and exports, Ireland, Denmark and Sweden the lowest

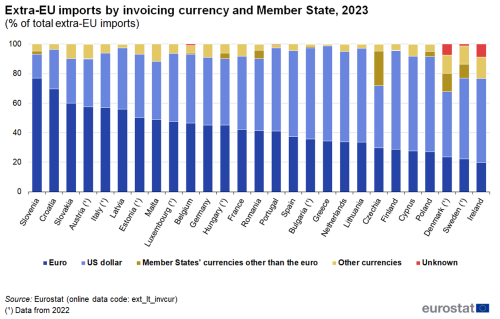
In 22 of the 27 Member States the US dollar was the most used currency for extra-EU imports of goods in 2020 (Figure 12). Its share was highest in Greece (64 %) and lowest in Slovenia (19 %). The euro was the most used currency in five Member States. Slovenia (74 %), Croatia (57 %), Latvia (56 %), Slovakia (55 %) and Austria (50 %). Member States' currencies other than the euro had a share above 10 % only in Czechia (20 %), Sweden and Denmark (both 13 %). Finally, other currencies had a share above 10 % only in Sweden (25 %), Denmark (12 %), Austria (11 %) and Poland (10 %).

Figure 12: Extra-EU imports of goods by invoicing currency and Member State, 201820
(% of total extra-EU exports)
Source: Eurostat (ext_lt_invcur)

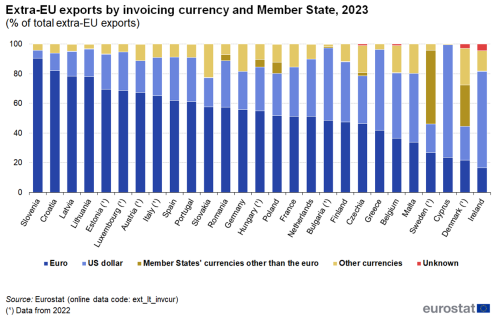
In 20 of the 27 Member States the euro was the most used currency for extra-EU exports of goods in 2020 (Figure 13). Its share was above 60 % in Slovenia (82 %), Croatia (72 %), Lithuania (67 %), Austria, Latvia and Italy (all three 62 %) and lowest in Ireland (9 %). The US dollar was the most used currency in seven Member States. Its share was highest in Ireland and Cyprus (both 67 %). Member States' currencies other than the euro had a share above 10 % only in Sweden (20 %) and Denmark (14 %). Lastly, other currencies had a share above 10 % in ten countries. It was above 20 % in Poland (30 %), Malta (23 %), Denmark and Sweden (both 25 %).

Figure 13: Extra-EU exports by invoicing currency and Member State, 2020
(% of total extra-EU imports)
Source: Eurostat (ext_lt_invcur)

Oil predominantly traded in US dollars, primary goods more often in euro

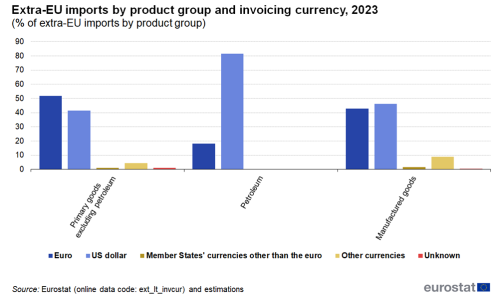
Looking at imports based on the Standard International Trade Classification (SITC) sections (see Figure 14), the US dollar stands out as the main currency used for imports of petroleum products (SITC 33) (80 % in 2020). In manufactured goods (SITC 5-8) the US dollar (45 %) was also the main currency ahead of the euro (40 %). In primary goods (SITC 0-4) excluding petroleum, the euro (45 %) had the highest share ahead of the US dollar (42 %).

Figure 14: Extra-EU imports by product group and invoicing currency, 2020
(% of extra EU imports by product group)Source: Eurostat (ext_lt_invcur)

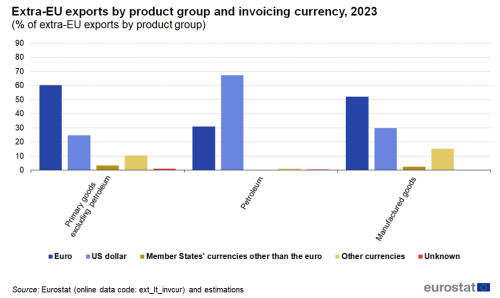
In extra-EU exports of petroleum products, the US dollar (56 %) is also the most used currency, although somewhat less dominant than in imports. With 46 % the euro is the most used currency in primary goods ahead of the US dollar with 28 %. In manufactured goods the euro has a share of 48 % and the US dollar had 29 % (see Figure 15).

Figure 15: Extra-EU exports by product group and invoicing currency, 2020
(% of extra EU exports by product group)Source: Eurostat (ext_lt_invcur)

Data sources

Data on trade by invoicing currency (TIC) is collected by using the customs declarations. Trade operators fulfilling their reporting obligations to the customs authorities in a Member State provide at the same occasion these statistical data elements, including the invoicing currency. The Member States collect, compile and transmit TIC data to Eurostat in line with the legislation in force. The data source shall be the information recorded from customs declarations according to Article 4(1) of Regulation (EC) No 471/2009. However, if the invoicing currency for exports is not available on the customs declaration, Member States shall carry out a survey for compiling exports broken down by invoicing currency which provides statistics with accurate results. The first reference year for which extra-EU trade by invoicing currency is available is 2010. Data are compiled for every second calendar year since then, i.e. 2012, 2014, 2016 etc.

The United Kingdom is considered as an extra-EU partner country for the EU for the whole period covered by this article. However, the United Kingdom was still part of the internal market until the end of the transitory period (31 December 2020), meaning that data on trade with the United Kingdom are still based on statistical concepts applicable to trade between the EU Member States. Consequently, while imports from any other extra-EU trade partner are grouped by country of origin, the United Kingdom data reflect the country of consignment. In practice this means that the goods imported by the EU from the United Kingdom were physically transported from the United Kingdom but part of these goods could have been of other origin than the United Kingdom. For this reason, data on trade with the United Kingdom are not fully comparable with data on trade with other extra-EU trade partners.

Product classification

Information on exported and imported goods are presented according to the Standard international trade classification (SITC) at a more general level.

  • SITC 5-8 Manufactured goods
  • SITC 33 Petroleum, petroleum products and related materials
  • SITC 0-4A Primary goods excluding SITC division 33
  • Total All products

A full description is available from Eurostat’s classification server RAMON.

Determination of currency For trade relating simultaneously to reference year 2020 and transactions between the Member States and the United Kingdom, the invoicing currency is likely to be unknown as the Intrastat declaration remains the means of collection during the transition period (February-December 2020). For trade related to reference years before 2020 statistics should be accurate enough to avoid the use of the unknown category. Residual trade that cannot be attributed to any code is proportionally distributed to each currency. Only if such a distribution would bias the data in a significant way, trade is attributed to the unknown category. Therefor the unknown category relates mainly to trade transactions with UK.


Context

Currencies are the means by which wealth is stored, protected and exchanged between countries, organisations and individuals. A global currency, such as the euro, does this on a global scale. As well as serving as the currency of the euro area, the euro has a strong international presence. Since its introduction in 1999, it has firmly established itself as a major international currency, second only to the US dollar. The size, stability and strength of the euro-area economy make the euro increasingly attractive beyond its borders, too. Public and private sectors in third countries acquire and use the euro for many purposes, including for trade or as currency reserves.

Direct access to

Other articles
Tables
Database
Dedicated section
Publications
Methodology
Visualisations


Main tables

International trade in goods – long-term indicators (t_ext_go_lti)
EU trade by Member State, partner and product group (t_ext_go_lti_ext)
Extra-EU imports by Member State, shares by invoicing currency (tet00067)
Extra-EU exports by Member State, shares by invoicing currency (tet00068)

Dedicated section