EU statistics on income and living conditions (EU-SILC) methodology - Intersections between sub-populations of Europe 2030 indicators on poverty and social exclusion
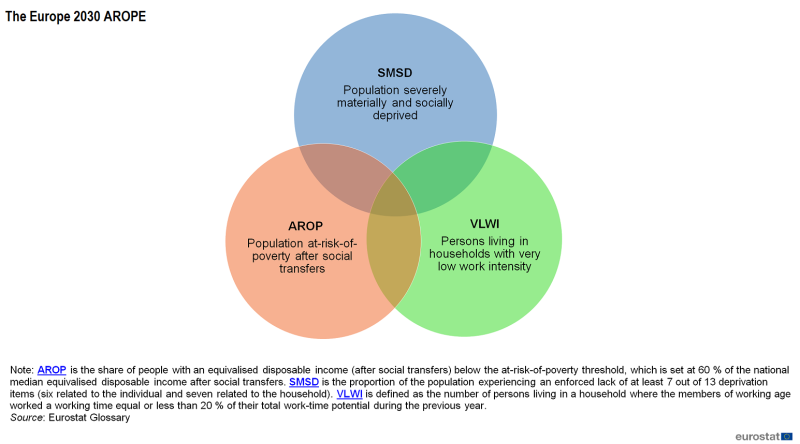
Intersections between sub-populations of the indicators included in the Europe 2030 target on poverty and social exclusion comprise eight sub-indicators of multidimensional structure that can be analysed simultaneously across the three different components of the at-risk-of-poverty or social exclusion rate (AROPE): at-risk-of-poverty rate (AROP), severe material and social deprivation (SMSD), and persons living in a household with very low work intensity (VLWI).
Full article
Description
The dataset intersections between the sub-populations of the Europe 2030 target on poverty and social exclusion (ilc_pees01n) covers the following sub-indicators:
- Population at-risk-of-poverty, severely materially and socially deprived and living in a household with very low work intensity;
- Population at-risk-of-poverty, severely materially and socially deprived but not living in a household with very low work intensity;
- Population at-risk-of-poverty but not severely materially and socially deprived and not living in a household with very low work intensity;
- Population at-risk-of-poverty but not severely materially and socially deprived but living in a household with very low work intensity;
- Population not at-risk-of-poverty, not severely materially and socially deprived but living in a household with very low work intensity;
- Population not at-risk-of-poverty but severely materially and socially deprived and not living in a household with very low work intensity;
- Population not at-risk-of-poverty but severely materially and socially deprived and living in a household with very low work intensity;
- Population neither at-risk-of-poverty nor severely materially and socially deprived nor living in a household with very low work intensity).
Each indicator shows that part of the population who faces exclusively one or combinations of the three different types of risks of poverty and social exclusion: AROP, SMSD, VLWI.
Calculation method
For the calculation of the intersections, the AROPE rate is broken down into each combination of dimensions (k) by dividing the percentage of people in each k who face the risk of poverty or social exclusion (defined by the intersections of the three main risks by the total population in that k.
The weight variable used is the Adjusted Cross Sectional Weight (RB050a).
- [math]AROPE[A]_{at\_k}=\frac{\sum\limits_{\forall {i\in\;A\_at\_k}}RB050a_i}{\sum\limits_{\forall {i\in\;A}} RB050a_i }\times 100[/math]
- [math]AROPE[A]_{at\_k}=\frac{\sum\limits_{\forall {i\in\;A\_at\_k}}\;RB050a_{i}}{1000}[/math]
where A is one of the subpopulations that are represented by the indicators listed in the section above.
Regarding the calculation of the AROPE indicator, the methodological considerations explained in “people at risk of poverty or social exclusion” should be taken into account.
SAS codes
SAS programming routines developed for the computation of the indicators from the Income and living conditions (ilc) database, including the intersections between sub-populations of Europe 2030 target indicators on poverty and social exclusion, are available in [1].
Main concepts used
Additional information for the computation of the intersections between sub-populations of Europe 2030 on poverty and social exclusion can be found below:
Direct access to
- EU statistics on income and living conditions (EU-SILC) methodology (overview of all articles)
- Living conditions in Europe - poverty and social exclusion
- Living conditions in Europe – severe material deprivation and economic strain
- Living conditions in Europe - income distribution and income inequality
- Living conditions in Europe - work intensity
- Living conditions and welfare (livcon), see:
- Person at risk of poverty or social exclusion (Europe 2030 strategy) (ilc_pe)
- Intersections between sub-populations of Europe 2030 target indicators on poverty and social exclusion (ilc_pees)
- Person at risk of poverty or social exclusion (Europe 2030 strategy) (ilc_pe)
