Archive:Urban Europe - statistics on cities, towns and suburbs - green cities
Data extracted in February–April 2016
This Statistics Explained article has been archived on 3 December 2020.
Highlights
In 2014, one fifth of EU city-dwellers lived in an area with problems related to pollution, grime or other environmental issues, compared with 13 % for people living in towns and suburbs and 8 % in rural areas.
In 2013, people living in cities were less likely to be satisfied with their recreational and green areas than those living in towns and suburbs or rural areas.
_(%25)_Cities16.png)
(%)
Source: Eurostat (urb_percep) and (urb_cpop1)
This chapter is part of an online publication that is based on Eurostat’s flagship publication Urban Europe — statistics on cities, towns and suburbs (which also exists as a PDF).
Definitions of territorial units
The various territorial units that are presented within Urban Europe — statistics on cities, towns and suburbs are described in more detail within the introduction. Readers are encouraged to read this carefully in order to help their understanding and interpretation of the data presented in the remainder of the publication.
Full article
Green cities
Chapter 2 covered a range of urban paradoxes, highlighting that while urbanisation has the potential to raise wealth, it may do so at the expense of increasing, for example, pollution or other forms of environmental damage. Although the on-going process of urbanisation has created some of the biggest challenges facing the planet, it also provides potential, insofar as cities are creative hubs and may provide possible solutions to a range of environmental issues.
Do cities damage the environment?
As cities account for the highest share of the EU-28 population, it is apparent that urban development policies have a considerable impact on environmental issues and sustainability. Most people think of cities as consuming considerable amounts of energy, generating high levels of air pollution or waste. This may be true for suburban and peri-urban (hybrid areas of fragmented urban and rural characteristics) developments which are often characterised by a high number of low-density, energy-intensive new builds in the form of detached houses, with a high level of dependency on the car as a means of transport. Indeed, urban sprawl can lead to increased energy demand, carbon emissions and air pollution, while putting pressure on ecosystems and resulting in a loss of biodiversity.
However, it is increasingly recognised that compact cities are resource-efficient ways for people to live and for businesses to exist, as close proximity provides potential efficiency gains. New technologies can be used to improve the environmental performance of urban areas, for example, public transport systems or the construction and functioning of buildings, to reduce resource and energy consumption. In addition, infrastructure — such as roads, telecoms, water and sewage systems — can be delivered at a much lower cost, when people live in compact areas close to each other. Furthermore, city-dwellers are more likely to make shorter trips to work or school, and a higher proportion make such journeys by foot, bicycle or public transport. They are also more likely to live in flats and townhouses which generally require less energy to heat and cool, when compared with larger, detached houses that are more common in suburban and rural areas.
Climate change: the European policy context
The Europe 2020 strategy is designed to deliver smart, sustainable and inclusive growth. The commitment to sustainable growth implies a move towards a low-carbon economy, for which the following targets have been set (to be achieved by 2020):
- greenhouse gas emissions to be 20 % (or even 30 %, if the conditions are right) lower than in 1990;
- 20 % of energy to come from renewables;
- a 20 % increase in energy efficiency.
Sustainable development in the context of the Europe 2020 strategy envisages the delivery of resource-efficient processes/technologies; it foresees a focus on green technologies to combat climate change, encouraging the use of low-carbon technologies, enhancing the use of renewable energies, and increasing energy efficiency.
Many European cities have demonstrated their commitment to reducing their environmental impact by joining the Covenant of Mayors for climate and energy. Initially, signatories pledged to cut their carbon emissions by at least 20 % by 2020 (in line with the Europe 2020 strategy). In October 2015, a renewed covenant was agreed and new signatories pledged to reduce their carbon emissions by at least 40 % by 2030, while providing formal plans for how they intend to go about reducing their carbon footprint.
Some cities have tried to attract the development of green industries in or close to their city boundaries, often in the form of high-technology clusters which draw on the knowledge of universities and/or research centres. Other cities choose to address green issues by designing sustainable development strategies, whereby their economic growth is driven by investments that are designed to reduce carbon emissions and pollution, enhance resource efficiency, or prevent the loss of biodiversity.
As such, the attractiveness of a city may be as much about the quality of life that it offers to (potential) residents as it is about the competitiveness of its urban economy for (potential) businesses. Cities are therefore increasingly branding themselves as ‘green’, ‘creative’ or ‘cultural’, trying to increase their attractiveness by promoting, for example, their environmental assets.
Environmental issues
In 2014, almost one fifth of the EU-28 population living in cities declared that they were living in an area with problems related to pollution, grime or other environmental issues (see Figure 1). This analysis by degree of urbanisation reveals that the exposure of city-dwellers to these environmental problems was higher than that experienced by people living in towns and suburbs (13.2 %) or rural areas (8.2 %), as those living in cities were 2.3 times as likely as those living in rural areas to report that they were living in an area with problems related to pollution, grime or other environmental issues during 2014.
People living in cities were more likely to be exposed to environmental problems
A particularly high share (40.0 %) of city-dwellers from Malta (the vast majority of this island’s population) reported that they were living in an area with problems related to pollution, grime or other environmental issues; this share was also high among those living in the cities of Greece (36.3 %) and Germany (32.5 %). At the other end of the range, less than 1 in 10 of those living in the cities of Croatia, the United Kingdom and Ireland declared that they were living in an area with problems related to pollution, grime or other environmental issues during 2014.
The disparities in exposure to such environmental problems between city-dwellers and those living in rural areas were greatest in Denmark, Greece and Italy, as people living in cities were at least four times as likely to report exposure to these issues; this pattern of a higher share of city-dwellers (compared with those living in rural areas) living in an area with problems related to pollution, grime or other environmental issues was repeated in each of the EU Member States. However, in Norway just 5.5 % of city-dwellers declared that they were living in an area with problems related to pollution, grime or other environmental issues, compared with 9.2 % of those living in rural areas. Note also that in Luxembourg and Cyprus, a higher proportion of people living in towns and suburbs (compared with those living in cities) reported that they were living in an area with problems related to pollution, grime or other environmental issues.
_Cities16.png)
(%)
Source: Eurostat (ilc_mddw05)
Green urban areas
The character of a city is defined, to some degree, by the way that its streets and public spaces are laid out; for example, contrast a city characterised by tree-lined boulevards and a generous number of public parks, with one that is tightly packed with apartment blocks.
Green urban areas have the potential to play an important role in cities: on the one hand, they can contribute to climate change mitigation by absorbing carbon from the atmosphere, as well as providing an area to absorb rainwater, and offering shade; and on the other they can improve general and mental health, by providing an opportunity for social interaction and increasing an individual’s quality of life.
European green capital award
The EU’s green capital programme is based on an assessment of cities covering aspects such as green urban spaces, biodiversity and how cities deal with the challenges of, among others, air pollution, waste and noise. The award is given each year to a city which leads the way in environmentally-friendly, urban living and which can thus act as a role model to inspire others.

Source: European Commission, Directorate-General for Environment (http://ec.europa.eu/environment/europeangreencapital/winning-cities/index.html)
People living in cities were less likely to be satisfied with their recreational and green areas
An analysis by degree of urbanisation of satisfaction levels with recreational and green areas is presented in Figure 2. Based on the average scores recorded across the EU-28 (on a scale of 0–10), the level of satisfaction among people living in cities (6.9) was somewhat lower than for those living in towns and suburbs (7.2) or rural areas (7.4).
Although this pattern was repeated in most of the EU Member States, there were some exceptions, as people living in cities were more satisfied (than those living in rural areas) in Croatia and Finland, while there was no significant difference in Bulgaria, Ireland, Cyprus, Portugal, Italy or Hungary. Among those Member States where people living in rural areas were more satisfied with their recreational and green areas, Greece, Austria and the United Kingdom stood out, as their average level of satisfaction was more than 1.0 point higher than for those living in cities.
_Cities16.png)
(rating, 0–10)
Source: Eurostat (ilc_pw02)
Map 1 presents information on the proportion of green urban areas and sports and leisure facilities for a range of cities in the EU, Norway and Switzerland. Among those presented, the highest share was recorded in the spa city of Karlovy Vary (the Czech Republic), as green urban areas and sports and leisure facilities accounted for more than one quarter (26.3 %) of its total area. The second highest share was recorded in the Swedish capital of Stockholm (24.1 %), which was the inaugural winner of the European green capital award, followed by the French capital of Paris (23.2 %) and the northern German city of Hannover (22.3 %); aside from these four, the share of green urban areas and sports and leisure facilities did not rise above 20.0 % in any of the remaining cities for which data are available.
Relatively low shares of green urban areas were often recorded for many of the cities located in eastern and particularly southern EU Member States. One explanation for their relatively low share of green spaces could be the climate, which may discourage local administrations from investing in watering systems for use during the summer months or in periods of drought.
_(%25_of_land_area)_Cities16.png)
(% of land area)
Source: Eurostat (urb_cenv) and (urb_cpop1)
Map 2 presents the considerable differences in urban morphological zones between the Swedish capital of Stockholm and the southern Italian city of Matera. The data shown relate to land use within the functional urban areas (cities and their commuting zones) of each city. The map for Stockholm is characterised by a relatively high share of both green urban areas and forests. By contrast, the city of Matera was largely characterised by its urban fabric, which was generally quite dense.
_and_Matera_(Italy),_2012_(%25_of_total_area)_Cities16.png)
(% of total area)
Source: Copernicus Urban Atlas (http://land.copernicus.eu/local/urban-atlas/urban-atlas-2012/view/)
Contrasting patterns — green urban areas
City planners are increasingly aware of the need to improve the quality of life by ensuring that there are ample green areas for local inhabitants and visitors to enjoy. That said, due to a lack of space, some historical cities may be characterised by narrow streets, densely populated areas and little or no green urban areas.
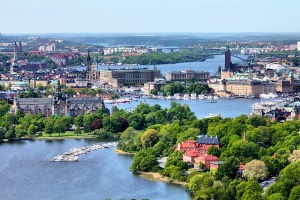
Stockholm (Sweden); © Tupungato – stock.adobe.com
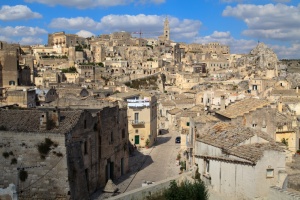
Matera (Italy); © Andreas Edelmann – stock.adobe.com


Resource efficiency, waste and pollution
According to the European Environment Agency (EEA), air pollution is the single largest environmental health risk in Europe, as more than half of the EU-28 population living in cities was exposed in 2013 to levels of air pollutants that exceeded World Health Organisation air quality guidelines.
Cities have a role to play in relation to delivering sustainable economic growth and alleviating the problems associated with climate change. There are a wide range of potential policies that may be used to increase resource efficiency and lower pollution levels, for example, the promotion of: recycling schemes for a range of waste streams; higher energy performance for buildings; cleaner transport; or schemes that are designed to eliminate congestion.
The use of water was highest in cities characterised by heavy industries
Figure 3 shows levels of water usage for a number of cities in the EU. Note that the volume of water used in many cities could reflect their degree of industrial specialisation, rather than large differences in personal/household consumption. For example, some of the highest levels of water use in 2012 were recorded in the Bulgarian cities of Burgas (petroleum) and Ruse (power generation, petroleum and chemicals) or the German cities of Duisburg (steel production), Bottrop (coal, chemicals and textiles) and Wilhelmshaven (power generation and chemicals).
_(m%C2%B3_per_inhabitant)_Cities16.png)
(m³ per inhabitant)
Source: Eurostat (urb_cenv) and (urb_cpop1)
Municipal waste per inhabitant was relatively high in cities characterised as tourist destinations
Across the whole of the EU-28, each person generated an average of 481 kg of municipal waste in 2013. Figure 4 shows, for each EU Member State, the city with the highest level of municipal waste generated per inhabitant. This rose to more than twice the EU-28 average in Fuengirola in Spain (on the Costa del Sol; 2010 data) and the Communauté d’agglomération de Sophia-Antipolis in France (close to Cannes/Antibes; 2011 data). It is likely that these figures are inflated, to some degree, by the associated waste streams from visitors to hotels and other forms of accommodation/lodging; such high levels of waste may raise concerns over the sustainable nature of tourism. At the other end of the range, every city in Latvia, Estonia, Slovenia and the Czech Republic (among those for which data are available) recorded a level of municipal waste generation per inhabitant that was below the EU-28 average.
An analysis for the 10 cities in the EU-28 with the highest levels of municipal waste per inhabitant shows that aside from the two coastal cities of Fuengirola and the Communauté d’agglomération de Sophia-Antipolis (mentioned above), six of the remaining eight cities were also located on or close to the Mediterranean coastline. The second highest level of municipal waste was generated in Marbella (also on the Costa del Sol in Spain), while the other cities included Fréjus in the south of France, and four Italian cities, Massa, Pisa (both in Tuscany), Rimini and Ravenna (both in Emilia-Romagna). The top 10 was completed by Cherbourg (a port on the northern coastline of France) and Westminster (central London, the United Kingdom).
Subcity statistics are available for London and these show that the level of municipal waste generated in Westminster (820 kg per inhabitant) was considerably higher than in any of the other London boroughs in 2014; note that these statistics may include waste streams similar to those generated in households, but instead coming from shops or offices. The next highest level of municipal waste per inhabitant in the British capital was recorded in the relatively affluent borough of Kensington and Chelsea (514 kg); on the other hand, the amount of waste generated in the Outer London borough of Brent and the Inner London borough of Wandsworth was much lower at 337 kg and 329 kg respectively.
_(kg_per_inhabitant)_Cities16.png)
(kg per inhabitant)
Source: Eurostat (urb_cenv), (urb_cpop1) and (tsdpc240)
Air pollution was often concentrated in some of the most congested cities
Together with carbon dioxide, concentrations of nitrogen oxides, particulate matter and ozone are some of the most common forms of air pollution. European air quality standards are set in a Directive (2008/50/EC) on ambient air quality and cleaner air for Europe, with a limit of 40 μg/m³ for the annual mean concentration of nitrogen dioxide. Road transport (particularly diesel engines) is the principal emitter of nitrogen oxide/dioxide emissions. Given the congestion in many of Europe’s cities it is not surprising that the highest concentrations of these emissions are recorded next to roads in major agglomerations.
The statistics shown in Figure 5 are calculated as an average for the whole of a city; as such, there are likely to be sites where pollutions levels are considerably higher and others where they are lower. Furthermore, the data refer to annual averages and there could be much higher peaks in pollution levels during rush-hour periods or under specific atmospheric or climatic conditions. These issues are addressed by air quality standards, and in the case of nitrogen dioxide there are also hourly thresholds which have been established (200 μg/m³ not to be exceeded for more than 18 hours in a year).
The highest annual concentration of nitrogen dioxide (among those cities for which data are available) was recorded in Paris (39.3 μg/m³; 2013 data), while pollution levels were also relatively high in another major French city, Marseille, the German cities of Ingolstadt and Frankfurt am Main, as well as the Dutch city of Schiedam (in the eastern suburbs of Rotterdam).
Fresher information for 2014 from Airparif — the air quality monitoring body for the French capital — suggests that around 2.3 million inhabitants within the Île-de-France (Greater Paris) were potentially exposed to levels above the annual limit and that the limit was exceeded in a number of popular sites in the city, including the Champs Elysées, Place de la Bastille or the Place de l’Opéra.
_(%C2%B5g_m%C2%B3)_Cities16.png)
(µg/m³)
Source: Eurostat (urb_cenv)
The highest concentrations of particulate matter were recorded in eastern and southern EU Member States …
As with nitrogen dioxide, there are short and long-term air quality limits for particulate matter (relatively large particles of dust, pollen, soot and smoke suspended in the air, whose size ranges from 2.5 to 10 µm (PM10). The short-term limit is set at not more than 35 days per year with a daily average concentration exceeding 50 μg/m³, while the long-term limit is a mean annual concentration that does not exceed 40 μg/m³.
Air pollution from particulate matter is also linked to vehicle emissions from diesel engines, while (surface) coal mining and other heavy industries can also cause high levels of this pollutant. The concentration of particulate matter can also be affected by atmospheric/climatic conditions, with pollution levels rising as a result of sunshine and higher temperatures. This may explain, to some degree, why the highest concentrations among those cities for which data are available tended to be recorded in eastern and southern EU Member States (see Figure 6). This was particularly the case for several cities in Bulgaria, with the mean concentration of particulate matter peaking in Bulgaria’s second city of Plovdiv (62.2μg/m³ in 2013). There were eight other cities in Bulgaria — including the capital of Sofia — where the average concentration of particulate matter rose above 40 μg/m³, and this was also the case in the three Czech cities of Havírov, Karviná and Ostrava (all of which are in the easternmost region of Moravian-Silesian, which has traditionally been an area characterised by coal mining). On the other hand, those cities with relatively low levels of air pollution were often located in the Nordic and the Baltic Member States.
,_selected_European_cities,_2013_(%C2%B9)_(%C2%B5g_m%C2%B3)_Cities16.png)
(PM10), selected European cities, 2013 (1)
(µg/m³)
Source: Eurostat (urb_cenv)
… while some of the highest concentrations of ozone were generally recorded in southern EU Member States
Ozone is not directly emitted into the atmosphere but is rather formed as a result of complex chemical reactions. Exposure to ozone can cause breathing and cardiovascular problems, asthma or lung disease. The World Health Organisation estimates that the average baseline level for ozone is 70μg/m³, while the EU air quality directive stipulates that the maximum daily 8-hour mean concentration of ozone should not exceed 120μg/m³ on more than 25 days per year.
Map 3 shows how many hours each day the concentration of ozone exceeded 70μg/m³; the map presents the accumulation of ozone concentrations above this threshold. In 2013, the highest ozone concentrations (among those cities for which data are available) were recorded in the Italian cities of Bergamo, Lecce (2012 data), Lecco and Udine, the Spanish cities of Almería, Benidorm and Córdoba, the Romanian city of Craiova (2012 data), the Hungarian city of Pécs and the Swiss city of Lugano. By contrast, there were three cities shown in Map 3 where there were zero hours during the course of 2013 with an accumulated concentration of ozone above 70μg/m³; they were the central and south eastern Romanian cities of Brașov and Buzău, and Saint-Denis (France).
_Cities16.png)
(sum of hours each day by which maximum daily 8-hour concentrations of ozone exceed 70 μg/m³)
Source: Eurostat (urb_cenv) and (urb_cpop1)
Environmental issues as perceived by city-dwellers
Maps 4–6 provide information from a perception survey on the quality of life in 79 European cities that was conducted during May and June 2015.
In three French cities more than three quarters of the population agreed that their city was committed to fighting climate change
In 2015, a majority of the population in 55 out of 79 cities agreed that their city was committed to the fight against climate change. The highest shares of agreement with this statement were recorded in three French cities, namely, Bordeaux (82 %), Strasbourg (81 %) and Rennes (76 %); the corresponding share for Greater Paris was considerably lower at 54 %. By contrast, no more than one third of respondents in the two Italian cities of Roma (33 %) and Palermo (32 %), or the three capitals of Rīga (Latvia; 32 %), Bratislava (Slovakia; 31 %) and Madrid (Spain; 30 %) agreed that their city was committed to the fight against climate change. A low proportion of people living in capital cities generally agreed with the statement, with higher shares being recorded for provincial cities in most EU Member States; the main exceptions where a high share of population agreed that their city was committed to the fight against climate change were the Austrian capital city (Wien; 75% agreed) and Luxembourg (73%).
(%)
Source: Eurostat (urb_percep) and (urb_cpop1)
A high proportion of city-dwellers in the Nordic Member States and the United Kingdom were satisfied with the level of noise in their city
A majority of respondents in 62 out of the 79 cities covered by the perception survey declared that they were satisfied with the level of noise in their city. The highest satisfaction levels were recorded in Oulu (Finland), where 88 % of respondents were satisfied, followed by the Danish city of Aalborg (87 %), and two cities from the United Kingdom, Tyneside (Greater Newcastle) and Belfast (86 %). More generally, relatively high satisfaction levels were recorded for many of the cities in the Nordic Member States and the United Kingdom, while this was also true in the Irish capital of Dublin (the only city surveyed in that EU Member State).
No more than half of the inhabitants in 17 of the perception survey cities were satisfied with the level of noise in their city. The share of respondents who were satisfied was no more than one third in Palermo (33 %) and the Romanian capital of Bucureşti (31 %); this was also the case in the Turkish city of Istanbul (28 %). Once again, respondents living in capitals were generally less likely to be satisfied with noise levels than those living in other cities.
_(%25)_Cities16.png)
(%)
Source: Eurostat (urb_percep) and (urb_cpop1)
There were only six European cities where a majority of city-dwellers were unsatisfied with the green areas in their city
The majority of people living in 73 out of the 79 cities covered by the perception survey declared that they were satisfied with the green areas in their city. There were 14 cities where more than 9 out of 10 inhabitants were satisfied: they included the three German cities of München, Leipzig and Hamburg, as well as Białystok (Poland), Luxembourg (Luxembourg), Wien (Austria), Groningen (the Netherlands), Stockholm and Malmö (both Sweden), Helsinki (Finland) and Greater London (the United Kingdom), as well as the Norwegian capital of Oslo and the two Swiss cities of Genève and Zürich. The highest level of satisfaction with green areas was recorded in Malmö (97 %).
There were six cities where less than half the respondents expressed satisfaction with the green areas in their city: Greater Athina and Irakleio in Greece, Valletta in Malta and Palermo and Napoli in Italy; the same was also true for Istanbul in Turkey.
_(%25)_Cities16.png)
(%)
Source: Eurostat (urb_percep) and (urb_cpop1)
Source data for tables and graphs
Direct access to
- Urban Europe — statistics on cities, towns and suburbs (online publication)
- Degree of urbanisation classification - 2011 revision
- Environment (all articles on the environment)
- Eurostat regional yearbook
- Statistics on regional typologies in the EU
- Regions and cities (all articles on regions and cities)
- Territorial typologies
- Territorial typologies for European cities and metropolitan regions
- What is a city?
- Perception survey on quality of life in 79 European cities
- Urban audit (ESMS metadata file — urb_esms)
- Regional statistics by typology (ESMS metadata file — reg_typ_esms)
- European Commission, Directorate-General for Regional and Urban Policy, Urban development
- European Commission, Directorate-General for Regional and Urban Policy, A harmonised definition of cities and rural areas: the new degree of urbanisation
- European Commission, European green capital
- European green cities network
- OECD, Redefining urban — a new way to measure metropolitan areas