Archive:Tobacco processing statistics - NACE Rev. 1.1
This Statistics Explained article is outdated and has been archived - for recent articles on structural business statistics see here.
- Data from January 2009. Most recent data: Further Eurostat information, Main tables and Database.
This article belongs to a set of statistical articles which analyse the structure, development and characteristics of the various economic activities in the European Union (EU). The present article covers manufacture of all tobacco products, corresponding to NACE Rev 1.1 Division 16, which is part of the food, beverages and tobacco sector. Tobacco products consist of:
- cigarettes;
- cigarette tobacco;
- cigars;
- pipe tobacco;
- chewing tobacco;
- snuff.
Main statistical findings
Structural profile
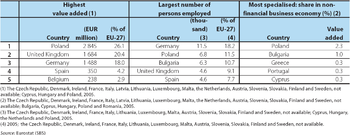
The number of enterprises across the EU-27 with tobacco manufacturing (NACE Division 16) as their main activity was just 0.3 thousand in 2006, demonstrating that this activity is particularly dominated by a few, extremely large multi-national enterprises. There were an estimated 64.0 thousand persons employed within the EU-27’s tobacco manufacturing activities in 2006, which equated to just 1.4 % of the food, beverages and tobacco manufacturing workforce. Nonetheless, these activities generated EUR 8.3 billion of value added, which was a significantly higher share (4.2 %) of sectoral value added. Tobacco manufacturing was highly concentrated within the EU-27 in geographical terms too, with almost two thirds of the EU-27’s value added coming from Poland (26.1 % in 2005), the United Kingdom (20.4 % in 2006) and Germany (18.0 % in 2006). The Netherlands is also a key tobacco manufacturing Member State, although data are not yet available for years later than 2004 (when it accounted for 15.5 % of the EU-27 total).
In relative terms, the value added generated by the tobacco manufacturing sectors of Poland and Bulgaria made much more significant contributions to total value added within their respective non-financial business economies than the EU average. The relative contribution of these activities in Poland was about ten times as high as the EU-27 average in 2005, and in Bulgaria it was about five times as high.
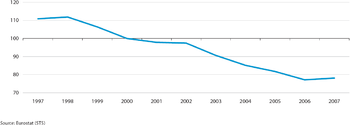
There was a strong downward trend in the production index of tobacco products across the EU-27 during the ten years through until 2007 with an average decline of 3.4 % per year. The EU-27’s output of tobacco products in 2007 remained close to its most recent low point recorded in 2006. In the Netherlands output grew rapidly through until 2002, after which there was a sharp decline, although the production index for 2007 remained 4.6 % higher than in 1997. In Poland, there were considerable fluctuations from one year to the next, although the overall evolution of output followed a downward trend (losing an average of 1.5 % per year), despite a considerable upturn in production in 2007. In Germany and the United Kingdom the downward trend was much more pronounced and sustained. In the United Kingdom, the production index in 2007 stood at 50 % of its level of a decade earlier (corresponding to an average decline of 6.7 % per year). The rate of decline in tobacco products manufacturing output in Germany was even more pronounced after 2000 (falling no average by 8.4 % per year between 2000 and 2007).
Expenditure and productivity
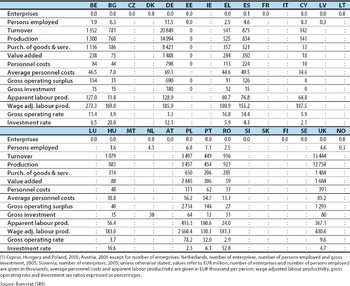
Personnel costs across the EU-27’s tobacco manufacturing sector accounted for 12.2 % of total operating expenditure in 2006, slightly below the average for the food, beverages and tobacco manufacturing sector. However, average personnel costs for tobacco manufacturing (EUR 47.3 thousand per employee in 2005) were much higher than for any of the other nine NACE groups within food, beverages and tobacco manufacturing.
Despite this high level of average personnel costs, the wage-adjusted labour productivity ratio of those working in the tobacco manufacturing sector averaged 339.5 % among those countries for which data are available [1], slightly more than double the ratio for the food, beverages and tobacco manufacturing sector. This high level of wage-adjusted labour productivity was based on EUR 170.0 thousand of value added being generated by each person employed in the EU-27’s tobacco manufacturing sector in 2005, which was a little more than four times the corresponding level of the food, beverages and tobacco manufacturing sector.
The wage adjusted labour productivity ratio of those working in Poland’s tobacco products manufacturing sector was particularly high (2 560 % in 2005), which, at least in part, helps explain why this ratio was particularly high for food, beverages and tobacco manufacturing as a whole (361.7 % in 2005).
Data sources and availability
The main part of the analysis in this article is derived from structural business statistics (SBS), including core, business statistics which are disseminated regularly, as well as information compiled on a multi-yearly basis, and the latest results from development projects.
Other data sources include short-term statistics (STS), the Labour force survey (LFS), the COMEXT database for external trade and the Confederation of Food and Drink Industries (CIAA).
Context
The food, beverages and tobacco manufacturing sector in the EU is comprised of a relatively small number of enterprises that have a considerable global market presence, which operate alongside a high number of relatively small enterprises that serve more local, regional and national markets.
As these enterprises not only produce goods for final consumption but also intermediate products for other manufacturing activities, they are affected by a broad scope of legislation. The main legislative areas affecting the EU’s food, beverages and tobacco manufacturing sector, however, tend to involve international trade agreements, or food and feed legislation. As a majority of the EU’s agricultural production is processed by the food, beverages and tobacco manufacturing sector, developments in Common Agricultural Policy and associated Common Market Organisations can have important implications for costs and processes in the food chain. Regarding food legislation, the European Parliament and the Council proposed an update of the laws regarding the provision of information to consumers (COM(2008) 40 final) in 2008, in order to clarify and consolidate existing regulations. In part, this proposal was built on a 2007 White Paper covering a Strategy for Europe on Nutrition, Overweight and Obesity (COM(2007) 279 final), which stressed the need for consumers to have access to clear, consistent and evidence-based nutritional information.
In July 2008, the European Commission presented a report and a proposal for a Directive (COM(2008) 459 final) to amend current EU excise duty legislation on tobacco. The draft Directive foresees a gradual increase in minimum taxation levels on cigarettes and fine cut tobacco up to 2014. The proposal also aims to contribute to reducing tobacco consumption by 10 % within the next 5 years. The European Commission also reported on the implementation of the EU tobacco advertising Directive (COM(2008) 330 final) and the application of the tobacco products Directive (COM(2007) 754 final) as part of its drive to curb avoidable, tobacco-related deaths in EU.
Further Eurostat information
Publications
Main tables
Database
Dedicated section
Other information
- COM(2007) 279 final - A Strategy for Europe on Nutrition, Overweight and Obesity related health issues
- Proposal COM(2008) 40 final for a Regulation on the provision of food information to consumers
- Proposal COM(2008) 459 final for a Directive amending Directives 92/79, 92/80 and 95/59 on the structure and rates of excise duty applied on manufactured tobacco
- Report on the implementation of the tobacco advertising directive (2003/33) - COM(2008) 330 final
- Second Report on the Application of the Tobacco Products Directive - COM(2007) 754 final
External links
See also
- Agri-environmental indicators
- Agricultural products
- Agriculture statistics at regional level
- Comparative price levels for food, beverages and tobacco
Notes
- ↑ Cyprus, Hungary and Poland, 2005; the Czech Republic, Denmark, Estonia, Ireland, France, Italy, Latvia, Lithuania, Luxembourg, Malta, the Netherlands, Austria, Slovenia, Slovakia and Finland, not available.


