Archive:The EU in the world - research and development
This Statistics Explained online publication has been archived. The latest edition, Key figures on the EU in the world – 2023 edition, can be found on the Eurostat website.
Data extracted in January and February 2020.
Planned article update: February 2023.
Highlights
The highest research and development intensity in 2017 among the G20 members was in South Korea.
In 2017, more than three quarters of funding for research and development expenditure in China, Japan and South Korea came from the business enterprises sector.

Source: Eurostat (rd_e_gerdtot) and (ert_bil_eur_a), the United Nations Educational, Scientific and Cultural Organisation (UIS: Science & Technology), the United Nations Department of Economic and Social Affairs, Population Division (World Population Prospects 2019) and the World Bank (World Development Indicators)
This article is part of a set of statistical articles based on Eurostat’s publication The EU in the world 2020. It focuses on science and technology and the digital society in the European Union (EU) and the 16 non-EU members of the Group of Twenty (G20). The article covers a range of statistics on research and development (R & D) expenditure and personnel. It gives an insight into the EU’s economy in comparison with (most of) the major economies across the rest of the world, such as the EU’s counterparts in the so-called Triad — Japan and the United States — and the BRICS composed of Brazil, Russia, India, China and South Africa.
Full article
R & D expenditure
Research and development (R & D) includes creative work carried out on a systematic basis in order to increase the stock of knowledge of man, culture and society, and the use of this knowledge to devise new applications. Gross domestic expenditure on research and development (GERD) is a key measure of the level of R & D activity performed in an economy. It includes R & D that is funded from abroad, but excludes payments made abroad.
The highest R & D intensity in 2017 among the G20 members was in South Korea
GERD in the EU-27 was EUR 280 billion in 2017 and EUR 295 billion in 2018. The relation between the level of GERD and gross domestic product (GDP) is known as R & D intensity (see Figure 1), and it stood in the EU-27 at 2.15 % in 2017. By far the highest R & D intensity in 2017 among the G20 members was in South Korea, where GERD was equivalent to 4.55 % of GDP. Japan, the United States and China show that they also recorded relatively high R & D intensities, all above 2.00 % and therefore also above the world average of 1.68 % (2016 data). Indonesia recorded the lowest R & D intensity among the G20 members, with GERD equivalent to 0.24 % of GDP.

Source: Eurostat (rd_e_gerdtot) and (ert_bil_eur_a), the United Nations Educational, Scientific and Cultural Organisation (UIS: Science & Technology), the United Nations Department of Economic and Social Affairs, Population Division (World Population Prospects 2019) and the World Bank (World Development Indicators)
An alternative calculation based on R & D expenditure can also be seen in Figure 1, namely the level of GERD relative to population size. The resulting ratio per inhabitant provides a very clear distinction between G20 members. The United States, South Korea and Japan stand out with GERD per inhabitant in excess of EUR 1 000. Australia (2015 data), Canada, the EU-27 and the United Kingdom completed the group of G20 members with relatively high GERD per inhabitant, all in the range of EUR 590-890. Among the other G20 members, only China, Saudi Arabia (2013 data), Russia and Brazil (2016 data) recorded GERD of at least EUR 100 per inhabitant, while this indicator was below EUR 10 per inhabitant in Indonesia.
Looking at R & D expenditure by the source of funds describes the sector of origin of the R & D funding rather than the sector where the R & D was performed. Funding for R & D may come from the following sectors: business enterprises, government, higher education institutions, private non-profit making organisations and abroad.
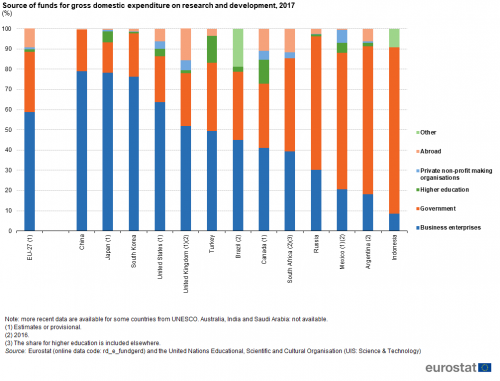
Nearly three fifths (59 %) of total R & D expenditure within the EU-27 in 2017 was funded by business enterprises, while three tenths (30 %) was funded by government and a further 9 % from abroad (foreign funds) — see Figure 2. Funding by the higher education and private non-profit sectors was relatively small, each around 1 % of the total. China (79 %), Japan (78 %), South Korea (76 %) and the United States (64 %) all reported larger shares of funding from the business enterprise sector than was observed in the EU-27 and smaller shares from the government sector. The United Kingdom (2016) was the only other G20 member that reported a majority (52 %) of R & D funding originating from the business enterprise sector.In five G20 members the share of funding from the business enterprise sector was lower than that from the government sector, with the business enterprise sector’s share at 39 % in South Africa (2016 data), 30 % in Russia, 21 % in Mexico (2016 data), 18 % in Argentina (2016 data) and 8 % in Indonesia.
The higher education sector provided more than 5 % of funding in only two G20 members, its share reaching 12 % in Canada and 13 % in Turkey. Funding from abroad only exceeded 6 % in the EU-27 (9 %), Canada (11 %), South Africa (12 %; 2016 data) and the United Kingdom (16 %; 2016 data). The highest share of funding that came from private non-profit making organisations was recorded in Mexico, at 6 % (2016 data).

(%)
Source: Eurostat (rd_e_fundgerd) and the United Nations Educational, Scientific and Cultural Organisation (UIS: Science & Technology)
R & D personnel
R & D personnel include all individuals employed directly in the field of R & D, covering not only researchers, but also technicians and equivalent staff as well as supporting staff (such as managers, administrators and clerical staff). A full-time equivalent is a unit to measure employed persons or students in a way that makes them comparable although they may work or study a different number of hours per week. The unit is obtained by comparing the number of hours worked by a person with the average number of hours of a full-time worker. A full-time person is therefore counted as one unit, while a part-time person gets a score in proportion to the hours they work.
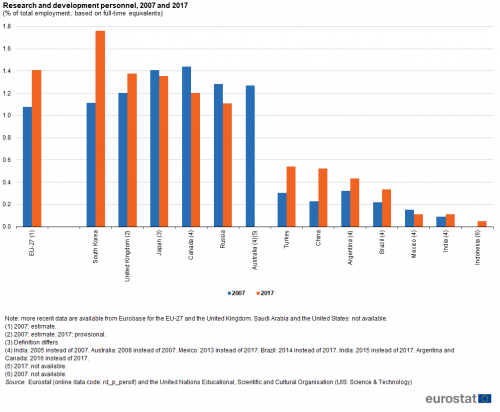
Figure 3 puts the figures on the size of the R & D workforce into context, showing them relative to the overall size of the workforce. In 2017, R & D personnel made up 1.76 % of all employment in South Korea, the highest share among the G20 members. The share of 1.41 % observed for the EU-27 was the second highest share, followed closely by the United Kingdom (1.38 %) and Japan (1.35 %). Canada and Russia were the only other G20 members to record shares over 1.00 % and in fact the next highest share was 0.54 % in Turkey. Shares of 0.11 % were observed for Mexico (2013 data) and India (2015 data) while the lowest share, 0.05 %, was recorded for Indonesia. A minority of the G20 members experienced a decrease in the R & D share of the workforce between 2007 and 2017, with falls of less than 0.10 percentage points in Mexico (2007-2013) and Japan and larger falls in Russia (down 0.17 points) and Canada (0.24 points; 2007-2016). Increases in excess of 0.20 percentage points were observed in Turkey (up 0.23 points), China (0.29 points), the EU-27 (0.33 points) and most notably South Korea (0.65 points).

(% of total employment, based on full-time equivalents)
Source: Eurostat (rd_p_perslf) and the United Nations Educational, Scientific and Cultural Organisation (UIS: Science & Technology)
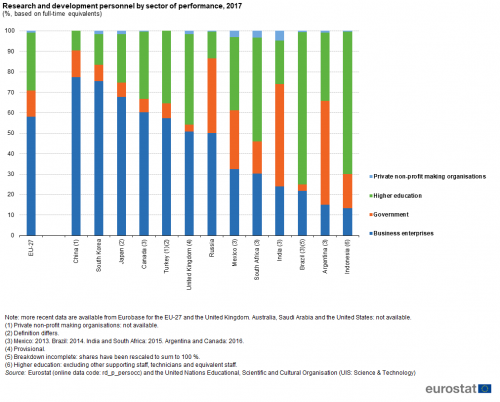
Based on where they perform their work, R & D personnel can be classified to the following sectors: business enterprises, government, higher education institutions and private non-profit making organisations. In 2017, more than half (58 %) of all R & D personnel (in full-time equivalents) in the EU-27 were employed in the business enterprise sector, around one quarter (28 %) in higher education and most of the remainder in the government sector (13 %) — see Figure 4. The share of R & D personnel in the business enterprise sector peaked at 77 % in China and 75 % in South Korea and was also higher than in the EU-27 in Japan (68 %) and Canada (60 %). By contrast, less than one third of all R & D personnel worked in the business enterprise sector in Mexico (2013 data), South Africa (2015 data), India (2015 data), Brazil (2014 data), Argentina (2016 data) and Indonesia. In Brazil and Indonesia, the higher education sector was the dominant employer, with 74 % and 70 % of the total respectively; South Africa was the only other G20 member where the share of R & D personnel in this sector exceeded one half. In Argentina and India, the government sector employed around half of all R & D personnel. The share of R & D personnel in the private non-profit making sector was generally small, peaking at 5 % in India.

(%, based on full-time equivalents)
Source: Eurostat (rd_p_persocc) and the United Nations Educational, Scientific and Cultural Organisation (UIS: Science & Technology)
Source data for tables and graphs
Data sources
The statistical data in this article were extracted during January and February 2020.
The indicators are often compiled according to international — sometimes worldwide — standards. Although most data are based on international concepts and definitions there may be certain discrepancies in the methods used to compile the data.
EU data
All of the indicators presented for the EU and the United Kingdom have been drawn from Eurobase, Eurostat’s online database. Eurobase is updated regularly, so there may be differences between data appearing in this article and data that is subsequently downloaded.
G20 members from the rest of the world
For the non-EU G20 members other than the United Kingdom, the data presented have been compiled by the United Nations Educational, Scientific and Cultural Organisation (UNESCO), supplemented by data from the World Bank. For some of the indicators shown a range of international statistical sources are available, each with their own policies and practices concerning data management (for example, concerning data validation, correction of errors, estimation of missing data, and frequency of updating). In general, attempts have been made to use only one source for each indicator in order to provide a comparable dataset for G20 members.
Context
Practical applications of science are integrated in almost every moment of our lives, for example, in household appliances, medicine and healthcare, transport, communications and entertainment. R & D and innovation underlie such applications and are often considered as some of the primary driving forces behind competitiveness, productivity, economic growth and job creation.
Direct access to
- The EU in the world 2020
- Statistics on European Neighbourhood Policy countries: South — 2020 edition
- The European Union and the African Union — A statistical portrait — 2019 edition;
- Key figures on the enlargement countries — 2019 edition
- Smarter, greener, more inclusive? Indicators to support the Europe 2020 strategy — 2019 edition
- Sustainable Development in the European Union — Monitoring report on progress towards the SDGs in an EU context
- Statistics on European Neighbourhood Policy countries: East — 2018 edition
- Globalisation patterns in EU trade and investment
- 40 years of EU-ASEAN cooperation — 2017 edition
- Asia-Europe Meeting (ASEM) — A statistical portrait — 2016 edition
- The European Union and the BRIC countries
- The European Union and the Republic of Korea — 2012
- Research and development (research)
- Statistics on research and development (rd)
- R&D expenditure at national and regional level (rd_e)
- Intramural R&D expenditure (GERD) by sectors of performance (rd_e_gerdtot)
- Intramural R&D expenditure (GERD) by source of funds (rd_e_fundgerd)
- R&D personnel at national and regional level (rd_p)
- Total R&D personnel by sectors of performance, occupation and sex (rd_p_persocc)
- Total R&D personnel and researchers by sectors of performance, as % of total labour force and total employment, and by sex (rd_p_perslf)
- R&D expenditure at national and regional level (rd_e)
- Statistics on research and development (rd)
- Exchange rates (ert), see:
- Bilateral exchange rates (ert_bil)
- Euro/ECU exchange rates (ert_bil_eur)
- Euro/ECU exchange rates - annual data (ert_bil_eur_a)
- Euro/ECU exchange rates (ert_bil_eur)