Archive:The EU in the world - environment
This Statistics Explained online publication has been archived. The latest edition, Key figures on the EU in the world – 2023 edition, can be found on the Eurostat website.
Data extracted in January and February 2020.
Planned article update: February 2023.
Highlights
Revenue from environmental taxes in the EU-27 was equivalent to 2.4% of GDP in 2018, among the highest ratios for G20 members.
Between 1990 and 2017, the EU’s greenhouse gas emissions fell by 21%.
South Korea recycled nearly three fifths (59%) of its municipal waste in 2017.
(tonnes per inhabitant)
Source: Eurostat (env_air_gge) and (demo_gind), the OECD (Environment, Air and climate) and the United Nations Department of Economic and Social Affairs, Population Division (World Population Prospects 2019)
This article is part of a set of statistical articles based on Eurostat’s publication The EU in the world 2020. It focuses on environmental issues in the European Union (EU) and the 16 non-EU members of the Group of Twenty (G20). The article provides information on environmental taxes, air emissions and municipal waste generation and treatment. It gives an insight into the state of the environment in the EU and in (most of) the major economies in the rest of the world, such as its counterparts in the so-called Triad — Japan and the United States — and the BRICS composed of Brazil, Russia, India, China and South Africa.
Full article
Environmental taxes
South Korea had the highest revenue from environmental taxes relative to GDP
An environmental tax is one whose tax base is a physical unit (or a proxy of one) of something that has a proven, specific negative impact on the environment. Examples are taxes on energy, transport and pollution, with the first two dominating revenue raised through these taxes in nearly all countries. As well as raising revenue, environmental taxes may be used to influence the behaviour of producers or consumers.
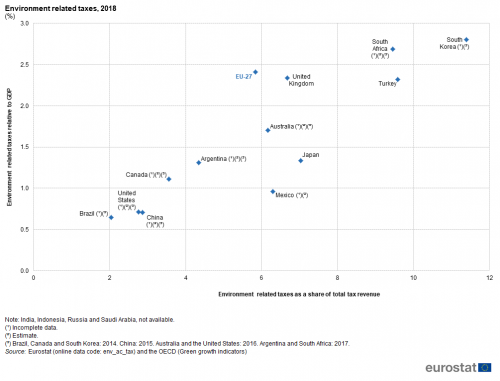
In 2018, the EU-27 Member States raised EUR 325 billion of revenue from environmental taxes, equivalent to 2.41 % of gross domestic product (GDP). Figure 1 compares the relative importance of environmental taxes among the G20 members (no data available for India, Indonesia, Russia and Saudi Arabia). The highest revenues from environmental taxes, relative to GDP, were in South Korea (2014 data) and South Africa (2017 data) where these taxes were equivalent to 2.80 % and 2.69 % of GDP respectively; the EU-27 ratio (2.41 %) was the next highest. The United Kingdom and Turkey (2.34 % and 2.32 %) were the only other G20 members to record ratios above 2.00 %. The lowest levels were recorded in the United States (0.71 %; 2016 data), China (0.70 %; 2015 data) and Brazil (0.65 %; 2014 data).
(%)
Source: Eurostat (env_ac_tax) and the OECD (Green growth indicators)
Revenue from environmental taxes contributed 5.84 % of all tax revenues in the EU-27 in 2018. In South Korea the share of tax revenues derived from environmental taxes was considerably higher than in the other G20 members, reaching 11.39 % (2014 data). The next highest shares were 9.59 % in Turkey and 9.46 % in South Africa (2017 data), followed at some distance by Japan, the United Kingdom, Mexico, Australia (2016 data) and the EU-27 in the range of 5.84 % to 7.03 %. Elsewhere the share of environmental taxes in total tax revenue was below 5.00 %, with Brazil recording the lowest share at 2.04 % (2014 data). As can be seen from Figure 1, there is a strong correlation (0.86) between the ratios of environmental taxes to GDP and the shares of environmental taxes within all tax revenue.
Figure 2 presents a similar comparison, again based on the ratio of environment related taxes to GDP but comparing this with GDP per inhabitant. Although there is a group of G20 members with relatively low ratios of environment related taxes to GDP combined with relatively low GDP per inhabitant, there is no clear relation between these indicators (the correlation coefficient is very weak at -0.06). For example, South Africa combined the lowest GDP per inhabitant of all G20 members with the second highest ratio of environmental taxes to GDP, while the United States combined the highest GDP per inhabitant with the third lowest ratio of environmental taxes to GDP.

Source: Eurostat (env_ac_tax), (nama_10_pc) and (ert_bil_eur_a), the OECD (Green growth indicators) and the United Nations Department of Economic and Social Affairs, Statistics Division (Analysis of Main Aggregates)
Air emissions
Data relating to greenhouse gas (GHG) emissions are collected under the UN’s Framework Convention on Climate Change (UNFCCC). The Kyoto Protocol is an international agreement linked to the UNFCCC, adopted in 1997 and entered into force in February 2005. Under the Protocol a list of industrialised and transition economies — referred to as Annex I parties — committed to targets for the reduction of six greenhouse gases or groups of gases. The G20 members that are Annex I parties are shown in Figure 4, based on the latest data which are for 2017. The EU (prior to the accession of Croatia and the withdrawal of the United Kingdom) committed to a 20 % reduction with respect to 1990 by 2020. Other pledges for reductions by 2020 made by Annex I parties include: a 5-25 % reduction with respect to 2000 levels in Australia; a 17 % reduction with respect to 2005 levels in Canada and the United States; a 3.8 % reduction with respect to 2005 levels in Japan; and a 15-25 % reduction with respect to 1990 levels in Russia. In 2015, 196 parties adopted the Paris Agreement that aims at governing emission reductions from 2020 onwards through national commitments; this entered into force in November 2016.
Emissions of different greenhouse gases are converted to carbon dioxide equivalents based on their global warming potential to make it possible to compare and aggregate them. According to the World Bank, worldwide greenhouse gas emissions in 2012 were 53.5 billion tonnes of CO2-equivalents. The G20 members (excluding Saudi Arabia and South Africa) accounted for 71.9 % of the total in 2012 (see Figure 3). China (23.3 %) and the United States (11.9 %) were the largest emitters, followed by the EU-27 (7.7 %), India, Brazil (both 5.6 %) and Russia (5.2 %).
Between 1990 and 2017, greenhouse gas emissions in the EU-27 fell by 20.6 % overall
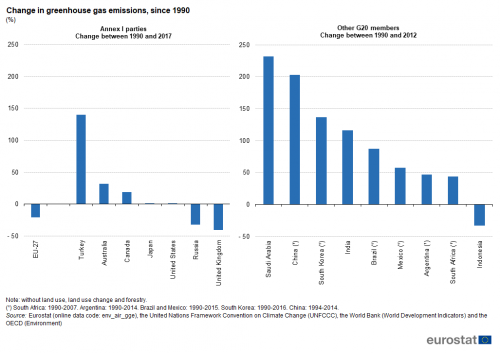
Changes in the level of emissions from G20 members are shown in Figure 4, separating the Annex I parties from the others. Between 1990 and 2017, the United Kingdom’s greenhouse gas emissions fell overall by 41 %, while the emissions from Russia fell by 32 % and those from the EU-27 by 21 %. Turkey’s emissions more than doubled, while emissions also increased from the other G20 Annex I parties, although only very slightly from the United States and Japan. Turning to the G20 members that are not Annex I parties, emissions from Saudi Arabia more than trebled between 1990 and 2012 as they also did from China between 1994 and 2014. Emissions from South Korea more than doubled between 1990 and 2016 as they also did from India between 1990 and 2012. Indonesia (1990-2012) was the only G20 member that was not an Annex 1 party to record a fall in emissions.
(%)
Source: Eurostat (env_air_gge), the United Nations Framework Convention on Climate Change (UNFCCC), the World Bank (World Development Indicators) and the OECD (Environment)
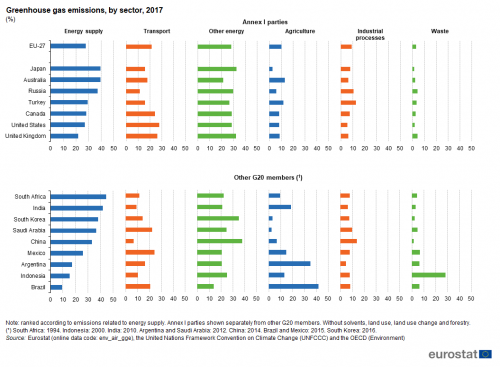
Figure 5 provides information on the source of greenhouse gas emissions. Energy (including energy supply, transport and other energy) accounted for at least 70 % of all greenhouse gas emissions in the G20 members that are Annex I parties. Among the energy sectors, energy supply had the largest share of emissions in Japan, Australia, Russia and Turkey, whereas other energy had the largest share in Canada, the EU-27, the United States and the United Kingdom. The United Kingdom and the United States were the only two G20 members that are Annex I parties where the share of emissions from transport was greater than that from energy supply. Agricultural process accounted for more than 10.0 % of emissions in Australia, Turkey and the EU-27, as did industrial processes in Turkey and Russia. Among the G20 members that are not Annex I parties, waste made a relatively large contribution to the level of greenhouse gas emissions in Indonesia (2000 data) as did agriculture in Brazil (2015 data) and Argentina (2012 data).
(%)
Source: Eurostat (env_air_gge), the United Nations Framework Convention on Climate Change (UNFCCC) and the OECD (Environment)
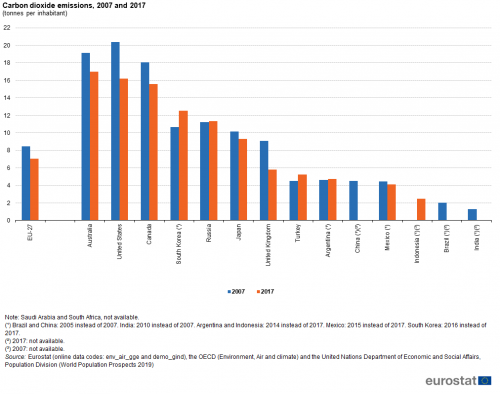
Figure 6 provides information on emissions of carbon dioxide calculated relative to the population size. This ratio varied considerably between G20 members reflecting, among other factors, the structure of each economy (for example, the relative importance of heavy, traditional industries), the national energy mix (the share of low or zero-carbon technologies compared with the share of fossil fuels), heating and cooling needs and practices, and the propensity for motor vehicle use.

(tonnes per inhabitant)
Source: Eurostat (env_air_gge) and (demo_gind), the OECD (Environment, Air and climate) and the United Nations Department of Economic and Social Affairs, Population Division (World Population Prospects 2019)
Australia, the United States and Canada all reported more than 15.0 tonnes of CO2 emissions per inhabitant in 2017. With 7.0 tonnes of emissions per inhabitant, the EU-27 was at the lower end of the range for an intermediate group where emissions varied from 7.0 to 12.5 tonnes per inhabitant, including also South Korea (2016 data), Russia and Japan. All of the other G20 members had CO2 emissions below 6.0 tonnes per inhabitant, with Indonesia (2014 data) reporting the lowest intensity, 2.5 tonnes per inhabitant. Between 2007 and 2017, the ratio of emissions to population size decreased by more than 2.0 tonnes per inhabitant in the United States, the United Kingdom, Canada, Australia and by a smaller amount in the EU-27, Japan and Mexico (2007-2015). In the other G20 members, emissions increased, by small amounts (up 0.1-0.7 tonnes per inhabitant) in Argentina (2007-2014), Russia and Turkey and by a larger amount in South Korea (up 1.8 tonnes per inhabitant; 2007-2016).
China’s consumption of hydrochlorofluorocarbons in 2018 was 2.5 times as high as the consumption of all other G20 members combined
The Gothenburg Protocol is one of several concluded under the United Nations Economic Commission for Europe Convention on Long Range Transboundary Air Pollution; it aims to control transboundary air pollution and associated health and environmental impacts, notably acidification, eutrophication and ozone pollution. Ozone depleting substances (ODS) contribute to ozone depletion in the Earth’s atmosphere and include hydrochlorofluorocarbons (HCFCs). These substances are listed in the Montreal Protocol which is designed to phase out their production and consumption.
Across G20 members, there has been a considerable reduction in the consumption of ODS in recent years. As of 2018, the EU-27 and the United Kingdom collectively had a negative consumption of HCFCs, indicating that exports and destruction of these substances were greater than the level of production plus imports (see Figure 7). Although 6.5 % lower than 10 years earlier, China’s consumption of HCFCs in 2018 remained 2.5 times as high as the level of consumption in all of the other G20 members combined.
Waste
The management and treatment of waste can have serious environmental impacts, taking up space and potentially releasing pollution into the air, water or soil. Municipal waste is collected by or on behalf of municipalities, by public or private enterprises and originates from households, commerce and trade, small businesses, office buildings and institutions (for example, schools, hospitals or government buildings) and some municipal services. For areas not covered by a municipal waste collection scheme the amount of waste generated is estimated.
Figure 8 shows that the amount of municipal waste generated in 2007 was particularly low in Indonesia and China, although no recent data are available. The EU-27 average was 482 kg of waste generated per inhabitant in 2017 and the available data indicate a higher level of waste generation in 2015 for both Australia (558 kg per inhabitant) and the United States (742 kg per inhabitant). Among the G20 members with data for both years shown in the figure, decreases in the level of waste generated relative to population size were recorded in all countries except for South Korea where there was a slight increase between 2007 and 2016. In relative terms, the largest decreases were observed for Japan (down 15 %; 2007-2016) and the United Kingdom (down 17 %; 2007-2017).
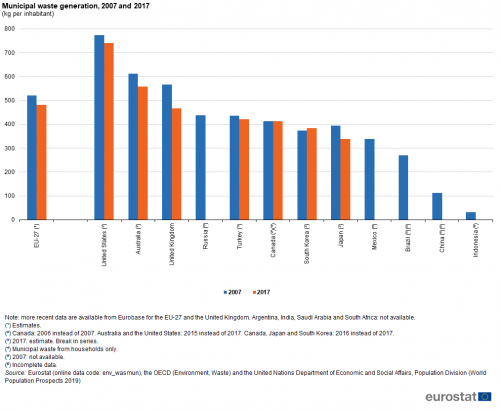
(kg per inhabitant)
Source: Eurostat (env_wasmun), the OECD (Environment, Waste) and the United Nations Department of Economic and Social Affairs, Population Division (World Population Prospects 2019)
South Korea recycled almost 60 % of its municipal waste in 2016
Landfilling is the final placement of waste into or onto the land in a controlled or uncontrolled way. Incinerating is the controlled combustion of waste with or without energy recovery. Recycling is any reprocessing of waste material in a production process that diverts it from the waste stream, except reuse as fuel; both reprocessing as the same type of product and for different purposes should be included, while recycling at the place of generation should be excluded. Composting is a biological process that submits biodegradable waste to anaerobic or aerobic decomposition and that results in a product that is recovered and can be used to increase soil fertility.
Among the G20 members with data available (see Figure 9), Turkey (90.2 %) reported the most frequent use of landfill in 2017 and Japan reported the most frequent use of incineration (78.5 %; 2016 data) to treat municipal waste. In South Korea, almost three fifths (59.2 %) of all municipal waste was recycled in 2016, with the next highest share in Australia (42.0 %; 2015 data), followed by the EU-27 (30.8 %), the United Kingdom (27.6 %) and the United States (25.8 %; 2015 data). In the United Kingdom and the EU-27, 17.3 % and 17.0 % of municipal waste was composted in 2017, approximately double the next highest share among the G20 members, 8.9 % in the United States in 2015.
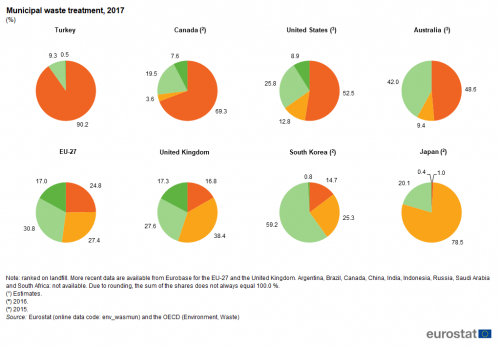
(%)
Source: Eurostat (env_wasmun) and the OECD (Environment, Waste)
Source data for tables and graphs
Data sources
The statistical data in this article were extracted during January and February 2020.
The indicators are often compiled according to international — sometimes worldwide — standards. Although most data are based on international concepts and definitions there may be certain discrepancies in the methods used to compile the data.
EU data
The data presented for the EU and the United Kingdom concerning taxes, greenhouse gas emissions and waste have been drawn from Eurobase, Eurostat’s online database. Eurobase is updated regularly, so there may be differences between data appearing in this article and data that is subsequently downloaded. For the indicator concerning the consumption of hydrochlorofluorocarbons, data have been extracted from international sources for reasons of comparability or availability.
G20 members from the rest of the world
For the non-EU G20 members other than the United Kingdom, the data presented have been compiled by a number of international organisations, namely the OECD, the United Nations Department of Economic and Social Affairs, the United Nations Environment Programme, the United Nations Framework Convention on Climate Change, the United Nations Statistics Division and the World Bank. For some of the indicators shown a range of international statistical sources are available, each with their own policies and practices concerning data management (for example, concerning data validation, correction of errors, estimation of missing data, and frequency of updating). In general, attempts have been made to use only one source for each indicator in order to provide a comparable dataset for G20 members.
Context
Dramatic events around the world frequently propel environmental issues into the mainstream media, from wide scale floods or forest fires to other extreme weather patterns, such as hurricanes. The world is confronted by many environmental challenges, for example tackling climate change, preserving nature and biodiversity, or promoting the sustainable use of natural resources. The inter-relationship between an economy and a society on one hand and their surrounding environment on the other hand is a factor for many of these challenges and underlies the interest in sustainable growth and development, with positive economic, social and environmental outcomes.
Direct access to
- The EU in the world 2020
- Statistics on European Neighbourhood Policy countries: South — 2020 edition
- The European Union and the African Union — A statistical portrait — 2019 edition;
- Key figures on the enlargement countries — 2019 edition
- Energy, transport and environment indicators — 2019 edition
- Smarter, greener, more inclusive? Indicators to support the Europe 2020 strategy — 2019 edition
- Sustainable Development in the European Union — Monitoring report on progress towards the SDGs in an EU context
- Statistics on European Neighbourhood Policy countries: East — 2018 edition
- 40 years of EU-ASEAN cooperation — 2017 edition
- Asia-Europe Meeting (ASEM) — A statistical portrait — 2016 edition
- The European Union and the BRIC countries
- The European Union and the Republic of Korea — 2012
- Greenhouse gas emissions by source sector (source: EEA) (env_air_gge)
- Waste (env_was), see:
- Waste streams (env_wasst)
- Municipal waste by waste management operations (env_wasmun)
- Environmental tax revenues (env_ac_tax)
- Population change - Demographic balance and crude rates at national level (demo_gind)]
- Auxiliary indicators (population, GDP per capita and productivity) (nama_10_aux)
- Main GDP aggregates per capita (nama_10_pc)
- Exchange rates (ert), see:
- Bilateral exchange rates (ert_bil)
- Euro/ECU exchange rates (ert_bil_eur)
- Euro/ECU exchange rates - annual data (ert_bil_eur_a)
- Euro/ECU exchange rates (ert_bil_eur)
OECD
United Nations
- United Nations Statistics Division
The World Bank

