Archive:The EU in the world - education and training
This Statistics Explained online publication has been archived. The latest edition, Key figures on the EU in the world – 2023 edition, can be found on the Eurostat website.
Data extracted in January and February 2020.
Planned article update: February 2023.
Highlights
Public educational expenditure relative to GDP among the G20 members in 2016 was highest in South Africa and Brazil, around 6 %.
In 2017, India had the highest pupil-teacher ratios for primary and secondary education among G20 members.
Among G20 members, Japan had the lowest proportion of young people not in employment, education or training in 2018.

(% of GDP)
Source: Eurostat (educ_uoe_fine06) and the United Nations Educational, Scientific and Cultural Organisation (UIS: Education)
This article is part of a set of statistical articles based on Eurostat’s publication The EU in the world 2020. It focuses on education and training statistics in the European Union (EU) and the 16 non-EU members of the Group of Twenty (G20). The article covers a range of subjects, including: educational expenditure, personnel, enrolment and attainment and gives an insight into education in the EU in comparison with (most of) the major economies in the rest of the world, such as its counterparts in the so-called Triad — Japan and the United States — and the BRICS composed of Brazil, Russia, India, China and South Africa.
The level of educational enrolment depends on a wide range of factors, such as the age structure of the population, legal requirements concerning the start and duration of compulsory education, and the availability of educational resources.
Full article
Educational expenditure
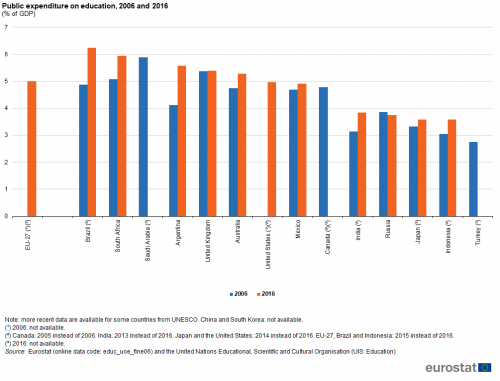
Public expenditure on education relative to GDP was just above 6 % in Brazil, the highest ratios among G20 members
Public expenditure on education includes spending on schools, universities and other public and private institutions involved in delivering educational services or providing financial support to students. The cost of teaching increases significantly as a child moves through the education system, with expenditure per pupil/student considerably higher in universities than in primary schools. Comparisons between countries relating to levels of public expenditure on education are influenced, among other factors, by differences in price levels and the number of pupils and students; in turn, the latter is influenced, to some extent, by the age structure of the population (see an article on population for more information).
Figure 1 provides information on the level of public expenditure on education relative to gross domestic product (GDP). Among the G20 members this was highest in 2016 in Brazil at 6.2 % (2015 data) and South Africa (5.9 %); note that no recent data are available for Saudi Arabia (where a ratio of 5.9 % was recorded in 2006). With a value of 5.0 %, the ratio in the EU-27 was in the middle of the range for the G20 countries. Between the two years presented in Figure 1, there was an increase in the level of public expenditure on education relative to GDP in all but one of the G20 members, most notably (in percentage point terms) in Argentina and Brazil (2006-2015). The one exception was Russia where the ratio of public expenditure on education relative to GDP fell from 3.9 % in 2006 to 3.7 % in 2016.

(% of GDP)
Source: Eurostat (educ_uoe_fine06) and the United Nations Educational, Scientific and Cultural Organisation (UIS: Education)
Numbers of teachers and pupils
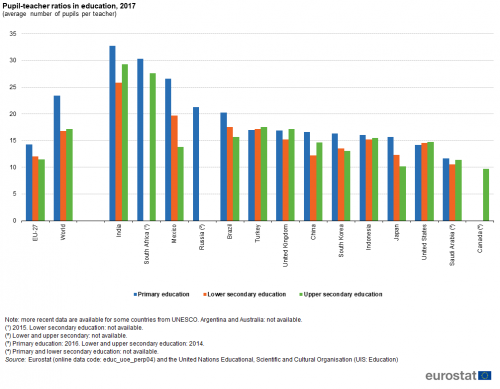
Across the G20 members, India had the highest pupil-teacher ratios in 2017 for primary and for secondary education
Figure 2 presents pupil-teacher ratios for primary and secondary education among the G20 members. These ratios are calculated by dividing the number of pupils and students by the number of educational personnel: note they are calculated based on a simple headcount and do not take account of the intensity (for example, full or part-time) of study or teaching.
Within primary education, the world average for the number of pupils per teacher was 23.4 in 2017. Among the G20 members, higher averages were observed in India, South Africa (2015 data) and Mexico, while lower ratios were observed elsewhere, in particular across the EU-27 (14.3), the United States (14.2) and Saudi Arabia (11.7; 2016 data).

(average number of pupils per teacher)
Source: Eurostat (educ_uoe_perp04) and the United Nations Educational, Scientific and Cultural Organisation (UIS: Education)
Worldwide, the average pupil-teacher ratio for lower secondary education was notably lower than for primary education in 2017 as was also the case in the EU-27 and in nearly all of the non-EU G20 members. The only exceptions were Turkey and the United States where pupil-teacher ratios within lower secondary education were slightly higher than within primary education. India, Mexico, Brazil and Turkey reported average pupil-teacher ratios within lower secondary education that were above the world average (16.8), with India reporting a particularly high ratio (25.9 pupils per teacher). The EU-27 reported an average of 12.0 pupils per teacher in lower secondary education, with only Saudi Arabia (2014 data) reporting a lower ratio.
The average pupil-teacher ratio for lower secondary education worldwide was slightly lower than the ratio for upper secondary education. A lower ratio for lower secondary than for upper secondary education was apparent in a majority of the G20 members, with only the EU-27, South Korea, Brazil, Japan and Mexico having higher pupil-teacher ratios for lower secondary education.
Within upper secondary education, India, South Africa (2015 data) and Turkey were the only G20 members to report average pupil-teacher ratios that were above the world average (17.2 pupils per teacher in 2017), while in the United Kingdom this ratio was equal to the world average. Canada reported the lowest ratio of pupils per teacher within upper secondary education (9.7). Aside from Canada, the only G20 members with pupil-teacher ratios for upper secondary education that were lower than in the EU-27 (11.5) were Japan (10.2) and Saudi Arabia (11.4; 2014 data).
School enrolment
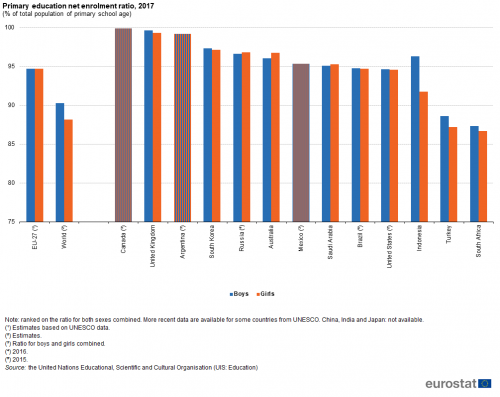
In 2017, net enrolment ratios in primary education were notably higher for boys than girls in Indonesia
Figure 3 presents enrolment ratios for primary education. These net enrolment ratios compare the number of pupils/students of the appropriate age group enrolled at a particular level of education with the size of the population of the same age group; as such, they cannot exceed 100 % as they do not include under or over age children being enrolled in primary education.
Worldwide, primary education net enrolment ratios were 88.2 % for girls and 90.3 % for boys in 2017, with all G20 members reporting higher ratios except for Turkey and South Africa. The highest primary education net enrolment ratio was recorded in Canada at 99.9 %, with the United Kingdom and Argentina reporting ratios of 99.5 % and 99.2 %, followed by South Korea (97.3 %). In the EU-27, the ratio was 94.7 %. Among the G20 members, Indonesia and Turkey reported the largest differences between net enrolment ratios for boys and girls, with the ratio for boys exceeding that for girls by 4.5 and 1.4 percentage points respectively. Elsewhere the gap — whether from higher rates for girls as in Australia and Russia (2016 data) or higher rates for boys as reported elsewhere — was less than 1.0 points.
Educational attainment
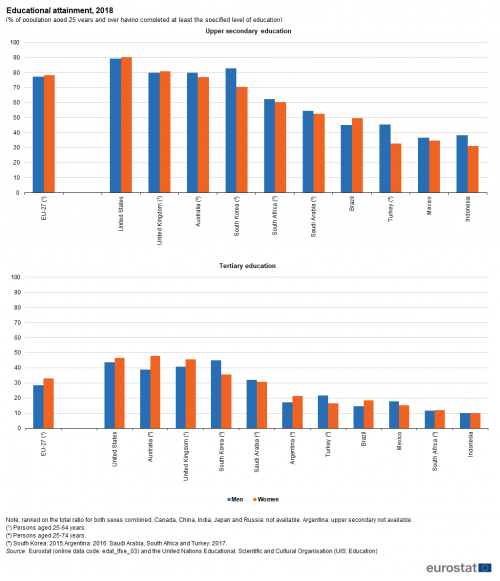
Figure 4 shows the proportion of the population aged 25 years and over having completed at least upper secondary education and the proportion having completed (at least one stage of) tertiary education. Note that the age coverage is narrower for the EU-27 (25-64 years), the United Kingdom (25-64 years) and Australia (25-74 years).
In the United States, the United Kingdom, Australia and the EU-27, the proportion of men and women having completed at least upper secondary education was over 75.0 %, while in South Korea (2015 data) it was also over 75.0 % for men. The proportion of men in the EU-27 in 2018 having completed at least upper secondary education was 77.4 %, while the corresponding value for women was slightly higher, at 78.2 %. In 2018, the proportion of men and women with an upper secondary level of educational attainment was less than 40.0 % in Mexico and Indonesia, while the rate for women in Turkey (2017 data) was also less than 40.0 %. Brazil, the United Kingdom, the EU-27 and the United States were the only G20 members where the proportion of men having completed at least upper secondary education was lower than the equivalent proportion for women. In seven other G20 members, attainment rates for men were higher than those for women, with the largest gender gaps observed in South Korea (12.4 percentage point gap; 2015 data) and Turkey (13.0 points gap; 2017 data).

(% of population aged 25 years and over having completed at least the specified level of education)
Source: Eurostat (edat_lfse_03) and the United Nations Educational, Scientific and Cultural Organisation (UIS: Education)
Tertiary education is generally provided by universities and other higher education institutions. In 2018, between one quarter and one third of the EU-27 adult population had completed tertiary education, 28.6 % of men and 32.9 % of women (see Figure 4). Among the non-EU G20 members, the rate of tertiary educational attainment was over 40.0 % for both sexes in the United Kingdom and the United States, while it was over 40.0 % for men in South Korea (2015 data) and for women in Australia. The lowest tertiary educational attainment rates were observed in Indonesia, where 10.0 % of people had completed tertiary education. The largest gender gap in tertiary educational attainment was recorded in South Korea (2015 data), where the proportion for men having completed tertiary education was 9.5 percentage points higher than for women, while the largest gender gap with a higher proportion of women than men having completed tertiary education was observed in Australia.
Not in employment, education or training
Among G20 members, Japan had by far the lowest proportion of young people not in employment, education or training in 2018
Traditional analyses of the labour market focus on employment and unemployment, but for younger people many are still in education. As a result, labour market policies for young people often focus on those who are not in employment, education or training, abbreviated as NEETs. Factors that influence the proportion of NEETs include the length of compulsory education, types of available educational programmes, access to tertiary education and training, labour market factors related to unemployment and economic inactivity (being neither employed nor unemployed), and cultural issues such as the likelihood of taking on caring responsibilities with an extended family and/or the typical age of starting a family.
Figure 5 shows the NEET rate of 15-24 years olds in 2018. Among the G20 members, this ranged from 2.9 % in Japan to 31.6 % in South Africa. The EU-27 had a rate of 10.5 %, higher only than in the United Kingdom, Australia (2017 data) and Japan. Canada was the only G20 member to report a larger proportion of young men (rather than young women) who were not in employment, education or training. By far the largest gender gap for this indicator was observed in India, where 48.3 % of young women were not in employment, education or training in 2018, compared with 14.3 % for young men; the next largest gaps were observed in Mexico, Saudi Arabia (2015 data) and Turkey.

(% share of persons aged 15-24 years)
Source: Eurostat (yth_empl_150) and the International Labour Organisation (ILOSTAT)
Source data for tables and graphs
Data sources
The statistical data in this article were extracted during January and February 2020.
The indicators are often compiled according to international — sometimes worldwide — standards. Although most data are based on international concepts and definitions there may be certain discrepancies in the methods used to compile the data.
EU data
Nearly all of the indicators presented for the EU and the United Kingdom have been drawn from Eurobase, Eurostat’s online database. Eurobase is updated regularly, so there may be differences between data appearing in this article and data that is subsequently downloaded. In exceptional cases, such as for enrolment rates, some data for the EU and the United Kingdom have been extracted from international sources.
G20 members from the rest of the world
For the non-EU G20 members other than the United Kingdom, the data presented have mainly been compiled by the United Nations Educational, Scientific and Cultural Organisation, with the data for the indicator concerning the proportion of 15-24 year-olds not in employment, education or training compiled by the International Labour Organisation.
Context
Education and training has the potential to foster economic growth, enhance productivity, contribute to people’s personal and social development, and reduce social inequalities. In this light, education and training may play a vital role in both an economic and social context. Education statistics cover a range of subjects, including: expenditure, personnel, participation and attainment. International standards for statistics on education are set by three international organisations: the Institute for Statistics of the United Nations Educational, Scientific and Cultural Organisation; the OECD; and Eurostat.
The classification used to distinguish different levels of education is the International Standard Classification of Education (ISCED). The version used in this publication is ISCED 2011 which has the following levels of education.
- Level 0 — early childhood education (including early childhood educational development and pre-primary education).
- Level 1 — primary education.
- Level 2 — lower secondary education.
- Level 3 — upper secondary education.
- Level 4 — post-secondary non-tertiary education.
- Level 5 — short-cycle tertiary education.
- Level 6 — Bachelor's or equivalent.
- Level 7 — Master's or equivalent.
- Level 8 — Doctoral or equivalent.
Direct access to
- The EU in the world 2020
- Statistics on European Neighbourhood Policy countries: South — 2020 edition
- The European Union and the African Union — A statistical portrait — 2019 edition;
- Key figures on the enlargement countries — 2019 edition
- Smarter, greener, more inclusive? Indicators to support the Europe 2020 strategy — 2019 edition
- Sustainable Development in the European Union — Monitoring report on progress towards the SDGs in an EU context
- Culture statistics — 2019 edition
- Statistics on European Neighbourhood Policy countries: East — 2018 edition
- Globalisation patterns in EU trade and investment
- 40 years of EU-ASEAN cooperation — 2017 edition
- Asia-Europe Meeting (ASEM) — A statistical portrait — 2016 edition
- The European Union and the BRIC countries
- The European Union and the Republic of Korea — 2012
- Key data on education in Europe 2012
- Education personnel (educ_uoe_per)
- Teachers and academic staff (educ_uoe_perp)
- Ratio of pupils and students to teachers and academic staff by education level and programme orientation (educ_uoe_perp04)
- Teachers and academic staff (educ_uoe_perp)
- Education finance (educ_uoe_fin)
- Expenditure on education (educ_uoe_fine)
- Public expenditure on education by education level and programme orientation - as % of GDP (educ_uoe_fine06)
- Expenditure on education (educ_uoe_fine)
- Education and training outcomes (educ_outc)
- Educational attainment level (edat)
- Population by educational attainment level (edat1)
- Population by educational attainment level, sex and age (%) - main indicators (edat_lfse_03)
- Population by educational attainment level (edat1)
- Educational attainment level (edat)
- Youth (yth), see:
- Youth employment (yth_empl)
- Young people neither in employment nor in education and training by sex, age and labour status (NEET rates) (yth_empl_150)
International Labour Organization ILO
United Nations Educational, Scientific and Cultural Organization UNESCO
