Archive:Sustainable development - natural resources
This Statistics Explained article is outdated and has been archived - for recent articles on sustainable development indicators see here.
- Data from July 2015. Most recent data: Further Eurostat information, Database.
This article provides an overview of statistical data on sustainable development in the area of natural resources. It is based on the set of sustainable development indicators the European Union (EU) agreed upon for monitoring its sustainable development strategy. This article is part of a set of statistical articles for monitoring sustainable development, which are based on the Eurostat publication 'Sustainable development in the European Union - 2015 monitoring report of the EU sustainable development strategy'. The report is published every two years and provides an overview of progress towards the goals and objectives set in the EU sustainable development strategy.
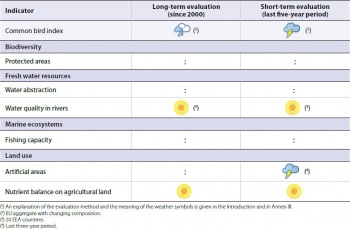
Table 1 summarises the state of affairs in the area of natural resources. Quantitative rules, applied consistently across indicators and visualised through weather symbols, provide a relative assessment of whether Europe is moving in the right direction and at a sufficient pace, given the objectives and targets defined in the strategy.
Overview of the main changes
The population status of common birds, the headline indicator of the ‘natural resources’ theme, continues to deteriorate. While the forest bird index has shown improvements since 2000, substantial declines in the abundance of farmland birds have led to an overall deterioration of the common bird index. Moreover, despite progress in the sufficiency of nature conservation sites designated to implement the Habitats Directive, many of the EU’s natural resources [1], such as biodiversity, air, water, soil and spatial resources, are under continuous pressure, mainly due to land-take for settlements and infrastructure as well as intensification of agricultural production and fisheries. However, progress can be observed in the water quality of rivers as well as in the gross nutrient balance on agricultural land. These improvements, among other reasons, are due to better waste water treatment and farm management practices, most importantly regarding fertiliser application techniques. Nonetheless, further measures are needed to improve the state of natural resources in the EU and to put natural resource use on a sustainable path. New concepts and solutions are required in a number of areas, including agriculture, fisheries and water policies as well as transport, consumption and production patterns.
Key trends in natural resources
Continued pressure on the EU’s natural capital
The index for all common birds declined by 1.8 percentage points between 2000 and 2013, with two polarised trends in the populations of common farmland and common forest birds. While the forest bird index increased by 8.0 percentage points, the farmland bird index dropped by 12.7 percentage points in the long term. Agricultural intensification has largely been blamed for the decline of common farmland birds. Harmful subsidies and increased use of biomass for renewable energy production are key drivers of this intensification. Biodiversity concerns are increasingly being integrated into the regional development policy and the Common Agricultural Policy of the EU, but further efforts are needed.
Slight improvements in sufficiency of protected areas
Between 2008 and 2012 the sufficiency of areas proposed for nature conservation under the Habitats Directive increased slightly to 87 % for the EU-27, indicating progress in the implementation of EU nature legislation and biodiversity protection. Half of the Member States showed sufficiency levels of protected areas above 90 % in 2012. However, further improvement in the management of designated sites and connectivity between sites is needed.
Water exploitation close to sustainable levels and river water quality improving
Water exploitation decreased over the past decade in most regions of Europe with the exception of Estonia, Spain and Cyprus, which reported higher water abstraction. Countries such as Lithuania and Romania made significant progress towards more sustainable water management by reducing water abstraction. Biochemical oxygen demand in rivers — an indicator of organic pollution in water — decreased by an average of 2.5 % per year since 2000 for the 20 European countries (including 18 EU Member States) considered. These improvements are mainly due to a general improvement in wastewater treatment. However, significant risks to water quality remain, including diffuse pollution from agriculture.
A declining fishing fleet
The engine power of the EU fishing fleet fell by 2.0 % per year on average from 2007 to 2014. Further efforts and policy reforms are needed for a sound fleet capacity adjustment, which would lead to more sustainable fish stock management and better economic conditions for active fishermen.
Share of artificial areas growing but nutrient surplus on agricultural land declining
In 2012, 4.7 % of the entire EU land area was covered by artificial land. Particularly high shares are associated with the most densely populated Members States. A rising demand for housing, economic activities in urban areas and transport infrastructure are mainly responsible for a continuous shrinkage of the share of semi-natural and arable land in the EU. Since 2000 the gross nutrient balance on agricultural land has been disturbed, largely due to the use of fertilisers for agricultural production. However, the surplus of nutrients added to agricultural soils declined in both the long term and the short term, with the phosphorous balance almost reaching parity between inputs and outputs. Implementation of the Nitrates Directive and other agricultural improvements have stabilised nutrient inputs, potentially reducing environmental pressures. However, agricultural nitrogen balances are still high in some parts of Europe, in particular in Western Europe and in some Mediterranean countries.
Main statistical findings
Headline indicator
Common bird index
The EU common bird index decreased by 1.8 percentage points in the long term between 2000 and 2013. The decline was particularly strong in the short term, with the common bird index falling by 4.5 percentage points between 2008 and 2013. While forest birds have shown a recovery since 2000, farmland birds have declined substantially.
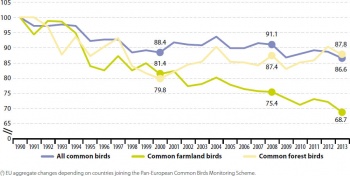
Despite some fluctuations, the index of all common birds declined by an average of 0.2 % annually in the long-term period between 2000 and 2013. This fall was slower than in the previous long-term period from 1990 to 2000, during which the index declined sharply by 1.2 % per year on average. Recent short-term developments have, however, been less favourable again, with the common bird index declining by 1.0 % per year on average between 2008 and 2013. The moderate long-term decline in common birds masks more polarised trends in the populations of common farmland and common forest birds. The forest bird index has shown a favourable trend, with an 8.0 percentage point increase between 2000 and 2013. The farmland bird index, however, decreased dramatically by 12.7 percentage points over the same period. Short-term trends indicate deterioration; while the common forest bird index increased only marginally between 2008 and 2013, the index for common farmland birds fell at an even faster pace than in the long term.
- Farmland bird diversity still declining
A large discrepancy exists between the relatively stable common bird population and a significant decline in farmland birds. The ‘all common birds’ index represents species from different habitats, including 34 common forest species and 39 common farmland species as well as 94 habitat generalists that thrive for example in built-up areas. The trend therefore shows that species that are dependent on specific habitats other than built-up areas are increasingly threatened by ongoing land use change and increasing landtake. Less specialised bird species and bird species adapted to human activities are more resilient to these changes. This means that current land use practices favour the occurrences of bird species that are less vulnerable to human activities.
In 2012, agricultural and grassland habitats covered 44.2 % of the EU-27 land area [2]. These habitats are crucial for biodiversity protection in the EU, including bird species that partially or exclusively rely on farmland habitats (Eurostat, 2012). According to the European Environment Agency (EEA) in its recent State of Nature in the EU report, about 48 % of bird species associated with agricultural ecosystems are assessed as ‘secure’, 38 % as ‘non-secure’ (16 % ‘threatened’ and 22 % as ‘near threatened’, ‘declining’ or ‘depleted’) and 14 % are assessed as ‘unknown’. In addition, more than half of the population trends for non-secure species are decreasing. These figures indicate that bird species associated with agricultural ecosystems are clearly worse off than bird species overall [3].
- Declines in farmland bird population mainly driven by agricultural changes
The decline in the number of farmland bird species has been confirmed in further studies [4]. Much of this decline has been attributed to changes in agricultural methods, intensification and specialisation [5]. For example, one study found that nearly one third of Europe’s Important Bird Areas are threatened by agricultural intensification and expansion [6]. Factors cited as being particularly harmful in terms of agricultural intensification in the EU include hedgerow loss, land drainage, increased mechanisation, increased fertiliser and pesticide use, reduction of spring cultivation, simplification of crop rotations, changes in crop use, and loss of farm diversity [7]. Agriculture is also the most common pressure or threat category for bird species listed by Member States reporting under the Birds Directive. The level of reported agricultural pressures or threats is particularly high for birds associated with cropland ecosystems, the most significant of which is ‘modification of cultivation practices’, such as agricultural intensification, grassland conversion into arable land and crop change [8]. Target 3A of the EU Biodiversity Strategy to 2020 aims to maximise the agricultural area covered by biodiversity-related measures under the Common Agricultural Policy (CAP) to ensure biodiversity conservation and improve the conservation status of species and habitats depending on or affected by agriculture. Therefore, this indicator should also be seen in the context of the CAP, in particular its rural development part and efforts aimed at the 'greening' of the CAP. Further efforts are needed to provide incentives for maintaining high nature value farmland and hence the practices sustaining farmland biodiversity [9]. High nature value farmland refers to predominantly agricultural areas that support a high level of species and habitat diversity and/or species of conservation concern.
The decline in common farmland bird species has been contrasted by the dramatic increase in the populations of some rare bird species over the same period, most likely as a result of direct conservation action [10].
- Bioenergy production also plays a role in farmland bird decline
Rising demand for biomass to produce bioenergy has noticeably increased the cultivation of high-input crops such as maize and rape, resulting in additional threats to biodiversity and ecosystem functions. Consequently, fallow land, which is an important habitat for many farmland species, has been increasingly used to grow energy crops.
- EU trends in the abundance of common birds compared with other countries in the world
Very similar to the decline in European farmland birds, populations of many common grassland and shrubland birds have also declined in North America, apparently in response to the intensification of agricultural practices. An analysis of state-level Breeding Bird Survey (BBS) data highlighted that 15 of 25 bird species (60 %) breeding in grassland habitats showed significant negative trends over the period 1980–1999, and an average decline of 1.1 % per year [11]. Another analysis highlighted the plight of 20 common bird species, all of which have lost over half of their continental population since 1967 [12].
Biodiversity
Protected areas
The sufficiency of sites designated for nature conservation was 87 % in the EU-27 in 2012. Two Member States have reached 100 % sufficiency and 12 more reported sufficiency levels of at least 90 %.
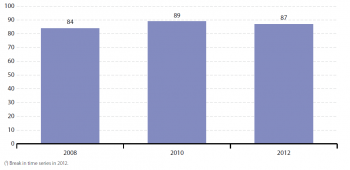
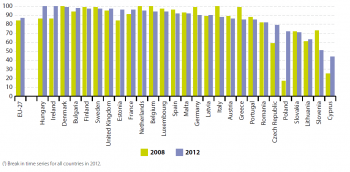
The establishment of Natura 2000 sites is an important pillar of the EU’s efforts to halt biodiversity loss. For the EU-27, the sufficiency of designated areas rose slightly from 84 % to 87 % between 2008 and 2012. Two aspects need to be kept in mind when using the sufficiency of designated sites as an indicator of the status of EU protected areas. First, this indicator shows the progress towards the full designation of areas that qualify for protection under the Habitats Directive. Variations between Member States exist regarding the total area that can potentially be designated, depending on the presence of specific vulnerable habitats and species targeted by the Directives. Second, and more important, the indicator refers only to the designation of areas but not yet to their actual protection through management to ensure the effective conservation of habitats and species. As revealed by the 2015 European Commission report on the State of Nature in the European Union, nearly 77 % of the protected habitats and 60 % of protected species are in an unfavourable conservation status, while 32 % of birds are in a non-secure state [13]. The assessment for species found in cropland, grassland, wetland and urban ecosystems is even more negative. The Natura 2000 network now covers more than 18 % of the EU’s land area and 4 % of Europe’s seas. It is the main instrument of the nature Directives to improve the status of species and habitats. From 2007 to 2012 there was a 6.2 % increase in the number of Sites of Community Importance (SCI) in the network. The area covered by these sites also increased, by 15.3 %. Most of these increases relate to Bulgaria and Romania joining the EU in 2007, and to the marine component of the network [14]. Despite this important progress, the full potential of the network has yet to be realised. While the effective management and restoration of the Natura 2000 areas is central to achieving the Directive’s objectives, insufficient progress has been made to put in place conservation objectives and measures that fully respond to the needs of the protected habitats and species. Only 50 % of the sites have been reported as having comprehensive management plans. Moreover, EU funding instruments supporting management and restoration of Natura 2000 are still insufficiently used [15]. Much stronger conservation efforts will therefore be needed to achieve the targets of the EU Biodiversity Strategy to 2020.
- How the sufficiency of sites varies between Member States
Two countries, Hungary and Ireland, had achieved 100 % sufficiency by 2012. Denmark and Bulgaria were close, with 99 % and 98 % sufficiency respectively. A further ten Member States were more than 90 % sufficient. Cyprus was the only Member State below 50 %. By far the largest increase from 2008 to 2012 was observed in Poland from 17 % to 72 %.
Fresh water resources
Water abstraction
Water abstraction from ground and surface water has declined in many Member States and abstraction pressure on water resources stabilised between 2000 and 2011. However, water stress has increased in some countries with severe scarcity.
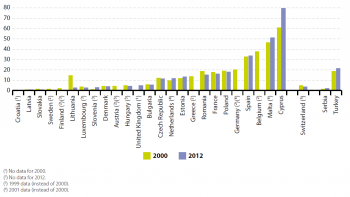
The water exploitation index (WEI) is used to measure to what extent available (renewable) water resources are being used sustainably. The warning threshold of 20 % distinguishes a non-stressed from a water scarce region, with severe scarcity occurring where the WEI exceeds 40 %. Eight of the 12 Member States for which data are available for both 2000 and 2012 reported a lower average share of renewable freshwater exploitation in 2012 compared with 2000. Higher WEI values were reported by one non-water-stressed countries (Estonia), as well as by two countries with water scarcity (Spain and Cyprus). Of the 19 Member States for which data are available in 2012, three exceeded the threshold for water scarcity (Spain, Malta and Cyprus), while only two exceeded the threshold for severe scarcity (Malta and Cyprus). The use of both surface water and groundwater is driven by four main activities: 44 % of the total abstracted water is for energy production (largely cooling in electricity production), 24 % for agriculture (largely irrigation), 21 % for public water supply and 11 % for industry [16].
- How water abstraction varies between Member States and worldwide
Whereas surface water is water on the surface of the planet, for example in streams, rivers, lakes and oceans, groundwater is water stored underground in rocks and soil and makes up more than 97 % of the world’s liquid freshwater not tied up as ice and snow. The amount of water actually available for abstraction from surface water and groundwater is mainly determined by geo-climatic conditions. Therefore figures vary significantly across the Member States for which data are available. Comparing 2000 to 2012, overall annual surface water abstraction remained relatively stable in most Member States for which data are available. Only Cyprus, Estonia and the Czech Republic experienced increases in surface water abstraction. Bulgaria, Latvia, Lithuania, Romania and Slovakia made a major step towards more sustainable water abstraction by decreasing surface water abstraction. In several Member States groundwater abstraction was lower in 2000 than in 2012 [17]. However, this mainly applies to non-water stressed countries. By contrast, Cyprus, which already exceeded a sustainable level, reported higher groundwater abstraction in 2012 than in 2000. Studies of global water use have shown that technological developments and changes in governance, such as improved water infrastructure, advances in water-efficient appliances, the use of water meters and water pricing, have helped improve water use efficiency and save water [18]. Nonetheless, between 1960 and 2000, global groundwater withdrawal increased from 312 km³ to 734 km³ per year, significantly raising the level of groundwater depletion [19]. Globally the rising world population, urbanisation and growing production and consumption have placed increasing demands on the world’s freshwater resources. While water demand among OECD countries is projected to decrease between 2000 and 2050, global water demand is forecast to increase by 55 % overall [20]. As a result, one study projects the world will face a 40 % global water deficit by 2030 under a business-as-usual climate scenario [21].
- How successful is the current EU Water Policy?
Unfortunately, the measures developed and implemented by Member States in reaction to the ‘Communication on water scarcity and droughts in the European Union’ were found to be limited and in some cases even contradictory to the achievement of its objectives [22]. This shows the need for a new impulse from the EU to step up efforts to protect water resources. The protection of water resources is also a critical part in the ‘Blueprint to safeguard Europe’s water resources’ (Commission Communication, 2012).
Water quality in rivers
Biochemical oxygen demand (BOD) in European rivers has shown a long-term decline. Between 2000 and 2012 BOD fell by an average of 2.5 % per year for reporting countries, mainly due to improved waste water treatment. This water quality improvement was also clearly visible in the short term, with an average annual decline of 1.5 % between 2007 and 2012.
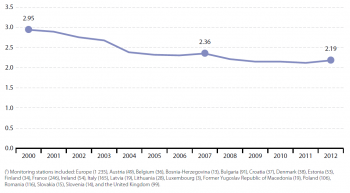
Biochemical oxygen demand (BOD) is used to measure water quality. High levels are usually a sign of organic pollution, which affects the water quality. The cleanest rivers have a five-day BOD of less than 1 mg/l. Moderately polluted rivers show values ranging from 2 to 8 mg/l. The concentrations of dissolved oxygen BOD values were monitored at 1 235 river monitoring stations in 20 countries, of which 18 are EU Member States. BOD fell between 2000 and 2012, indicating river water quality improved. The average BOD decreased by 0.76 mg/l between 2000 and 2012 and by 0.17 mg/l between 2007 and 2012. The average yearly decrease in BOD was 2.5 % from 2000 to 2012 and 1.5 % from 2007 to 2012, indicating a slowing of the improvement over time. Based on a statistical assessment by the EEA, the majority of river stations report a negative trend in BOD, while only a small share reported increases (EEA, 2015). Countries reporting a particularly low BOD concentration (less than 1.4 mg/l) in 2012 are Slovenia (1.02 mg/l), Ireland (1.19 mg/l) and France (1.28 mg/l). Some of the year-to-year variation in values measured at river stations can be explained by variation in precipitation and runoff. However, the long-term positive trend in BOD indicates that treatment (secondary and tertiary treatment) of waste water has improved as a result of implementation of the Urban Waste Water Treatment Directive, and possibly falls in agricultural emissions. Therefore, this indicator is linked to the sustainable development indicator ‘population connected to urban wastewater treatment with at least secondary treatment’ (Eurostat, 2015). Despite these successes, further challenges related to water quality remain. For example, more than 40 % of rivers and coastal water bodies are affected by diffuse pollution from agriculture, while between 20 % and 25 % are subject to point source pollution, such as emissions from industrial facilities, sewage systems and wastewater treatment plants [23]. It should be noted, however, that while the indicator is relatively robust, a number of factors make country comparisons difficult. For example, water quality in one country can be heavily affected by pollution from countries upstream. Moreover, the number and selection of measurement stations per country also influence overall results.
Marine ecosystems
Fishing capacity
The size of the EU fishing fleet in terms of engine power fell by 2.0 % on average from 2007 to 2014. Further capacity reduction is needed for fish stocks to recover.
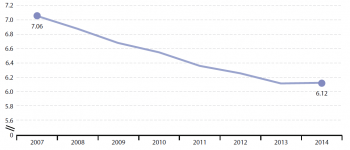
The EU-27 fishing fleet, measured by the total engine power of fishing vessels, fell from 7.06 million kilowatts in 2007 to 6.12 million kilowatts in 2014, representing an average annual reduction of 2.0 %. An oversized fishing fleet has several economic consequences that undermine a transition to a green economy: fish stocks are overfished, parts of the fleet face economic difficulties despite high subsidy levels, jobs in the sector are unattractive and the situation of many coastal communities depending on fisheries becomes precarious [24].
- EU fishery policy at a turning point?
The decline in fishing fleet capacity is mainly a result of Member States’ efforts to align fishing with the size of fish populations. This has included introducing mechanisms such as decommissioning schemes and tradable fishing rights concessions (TFC or individual transferable quotas [ITQs]) [25]. Since 2002 a fishing fleet ceiling has been set under the Common Fisheries Policy (CFP) in terms of both kilowatts and gross tonnage. This prevents fishing fleets from being increased and when public funds are used to decommission a vessel, the corresponding reduction in fleet capacity is made permanent. Under the newly reformed CFP, Member States must also put in place measures to adjust their fleet’s fishing capacity to the size of fish populations over time and report annually on the balance between the two. Therefore, Member States will have to ensure that the fleet capacity (number and size of vessels) is in balance with fishing opportunities. Where Member States identify an overcapacity they will have to develop an action plan to reduce it. If a Member State does not deliver the report or fails to reduce its fleet capacity in line with the action plan, a proportionate suspension or interruption of relevant EU funding may result. Declines in fishing fleets do not automatically translate into shrinking fishing capacity. According to the Green Paper on the Reform of the CFP [26], reductions in fishing fleets may well have been offset by technological progress, which is estimated to increase fishing efficiency by 2–3 % per year [27]. This corresponds to the European Commission’s statement that despite massive spending of EUR 2 730 million between 1994 and 2013 to scrap fishing vessels, the EU’s fishing capacity is still growing by about 3 % every year [28]. However, for commercially exploited fish stocks total catches have fallen from 8.1 million tonnes of live weight in 1995 to 4.7 million tonnes in 2013 [29]. Moreover, the estimate of stocks fished above maximum sustainable yield (MSY) in the EU's Atlantic and Baltic waters has fallen from 94 % in 2007 to 41 % in 2014, indicating a decline in fishing pressure [30]. Nonetheless, some unsustainable fishing practices such as bottom-trawling remain in use. For the CFP to reach the MSY goal for all fish stocks by 2020, efforts to reduce fleet overcapacity will have to be properly implemented and the general growth in marine activities will have to be aligned with the EU’s biodiversity policies. Furthermore, additional pressures on marine ecosystems, such as coastal eutrophication, contaminants, introduction of non-indigenous species, climate change and increasing amounts of marine litter will also need to be addressed [31].
Land use
Artificial areas
In 2012, 4.7 % of the entire EU land area was covered by artificial land. This share has been rising by 3 % per year on average since 2009. Urbanisation and expanding transport infrastructure are the main drivers of land sealing.
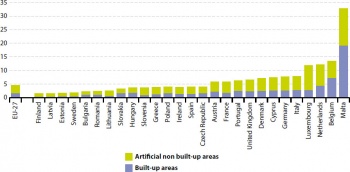
Artificial areas, including built-up areas (mainly buildings and greenhouses) and those covered by artificial or impervious surfaces such as car parks, roads and railways, are continuously encroaching on farmland, forests and semi-natural land. Across the EU, 4.7 % of the land area was artificial in 2012, compared with 4.3 % in 2009. This represents an average increase of about 3 % per year which is equivalent to a loss of non-artificial land of more than 17 square kilometres per day or more than 200 square meters per second in the total EU area. About two thirds of this artificial area is artificial non-built-up land.
- How coverage by artificial areas varies between Member States
The highest shares of artificial areas were recorded in Malta (32.9 %), Belgium (13.4 %), the Netherlands (12.2 %) and Luxembourg (11.9 %). Because artificial areas are commonly found in cities and towns, countries with a high population density tend to record high shares of artificial land cover. This relationship is particularly clear for Malta, which has the highest shares of each, and to a lesser extent for the Netherlands and Belgium (Eurostat, 2013). In contrast, two Nordic and two Baltic countries have the lowest share of artificial areas: Finland and Latvia (1.6 % each) and Sweden and Estonia (1.8 % each). These countries are among the least densely populated.
Nutrient balance on agricultural land
The gross nutrient balance on agricultural land has been disturbed over the long term between 2000 and 2011, in particular for nitrogen. Surpluses of nitrogen and phosphorous applied to agricultural soils have fallen between 2000 and 2011. The short-term period since 2006 confirms this positive trend, with the gross phosphorous balance reaching almost parity between inputs and outputs.
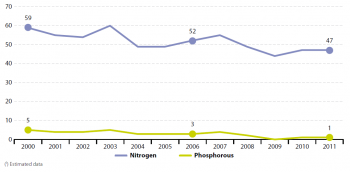
In the long-term period between 2000 and 2011, the balance between nitrogen and phosphorous added and removed from agricultural lands (measured in kilograms per hectare) was disturbed, but with a declining trend. The surplus of nitrogen applied to agricultural land fell by about 20 %, from 59 kg per hectare in 2000 to 47 kg per hectare in 2011. The phosphorous surplus, being considerably lower, fell from 5 kg per hectare in 2000 to 1 kg per hectare in 2011. These favourable trends were confirmed in the short term, between 2006 and 2011, when nitrogen and phosphorus surpluses declined by 5 kg per hectare (- 9.6 %) and 2 kg per hectare (- 66.7 %) respectively. The lowest values for surpluses of both nutrients were recorded in 2009, with the gross phosphorous balance reaching parity. The largest contributor to the gross surplus in the nutrient balance for the EU-28 is the use of fertilisers containing nitrogen and phosphorus as an input in agricultural production (Eurostat, 2015). Fertiliser use includes organic fertilisers, such as livestock manure, and manufactured mineral fertilisers, and adds nutrients or minerals to the soils. On the other hand, harvesting of crops, harvesting and grazing of fodder, removal of residues and runoff remove nutrients or minerals from soils. The nutrient requirements of plants are influenced by previous land management, soil type and climatic factors, and vary from one crop to another. The implementation of the Nitrates Directive and the introduction of set-aside measures have stabilised pollution from nutrients, potentially reducing the environmental pressures on soil, water and air, but agricultural nitrogen balances are still high in some countries, particularly in lowland Western Europe and in some Mediterranean countries (Eurostat, 2015). According to the Food and Agriculture Organisation of the United Nations (FAO), while fertiliser use is set to decline marginally in Western Europe until 2018, it is set to increase in Central and Eastern Europe. [32].The resulting pollution of water bodies puts these Member States at greater risk of exceeding critical loads for eutrophication (EEA, 2010), among other environmental impacts. The level of nitrogen still substantially exceeds ecosystem eutrophication limits in most of Europe and the eutrophication risk is predicted to remain unchanged until 2020 [33]. Measures to tackle agricultural pollution include improving the efficiency of nitrogen use in crop and animal production; conserving nitrogen in animal manure during storage and application; and full compliance with the Nitrates Directive [34].
Context
Why do we focus on natural resources?
Healthy ecosystems provide a range of benefits that serve as the backbone for biodiversity and human well-being. These benefits include provisioning (such as food and wood), regulating (climate, flood and water regulation) and cultural services (spiritual, recreational and educational). Human well-being relies on natural capital, including the ability of ecosystems to provide food, water and fuel as well as to regulate the environment through services such as carbon storage, flood control and water purification. Natural systems can only tolerate disruption up to a certain point [35]. Therefore the sustainable use of natural resources and maintenance of well-functioning ecosystems is crucial to meeting the demands of current and future generations. Their protection and strategic use are an integral part of sustainable development. Some progress has been made regarding water and air quality, but human activities continue to threaten vast areas of natural land and the life they sustain. Recent assessments paint a distressing picture of the status of biodiversity and ecosystems and highlight the lack of progress in achieving European targets in this area [36]. A key factor behind biodiversity decline is changes in land use and land cover due to a growing human demand for food, renewable energy and built infrastructure that increase sealed surfaces, such as buildings and roads [37]. Satisfying these demands has resulted in the loss and fragmentation of vast areas of natural and semi-natural habitats. These are the unique ecological areas in which particular animals, plants and other organisms live. Such habitat modifications not only threaten biodiversity, but also reduce the ecosystem’s ability to withstand the foreseen effects of climate change such as more frequent natural disasters (GRID-Arendal, 2013). There are strong linkages between the 'natural resources' theme and other sustainable development areas. While the exploitation and consumption of natural resources have underpinned economic growth and improvements in human welfare in Europe to date, the diminishing quantity and quality of these resources can ultimately undermine livelihoods. Over-fishing, for example, has significantly decreased fish stocks and landings, affecting the resilience of marine ecosystems and incomes and employment opportunities within the fisheries sector. Water shortages caused by over-use and increases in the number of groundwater aquifers not meeting EU drinking water standards have economic repercussions on society. Trade-offs between nature protection goals and activities such as energy and food production, transport and infrastructure development, are frequent. Balancing these demands requires awareness not only of European needs, but also of the impact of land use decisions and consumption patterns in other world regions. The reliance of many of the world’s poor on natural resources also highlights the need to think about the environment and sustainable development in global terms. Only if the EU’s production and consumption habits respect the physical limits of the biosphere and the ecosystems, their services can be maintained and restored and a transformation to a green economy be achieved, resulting in an overall increase of human well-being.
How does the EU tackle Natural Resources
The EU Sustainable Development Strategy (EU SDS) declares natural resources as one of its seven key challenges. The overall objective is to ‘improve management and avoid overexploitation of natural resources, recognising the value of ecosystem services’. The EU SDS has two operational objectives and targets:
- Improving resource efficiency to reduce the overall use of non-renewable natural resources and the related environmental impacts of raw material use [considered in the chapter on sustainable consumption and production], thereby using renewable natural resources at a rate that does not exceed their regeneration capacity.
- Improving management and avoiding overexploitation of renewable natural resources such as fisheries, biodiversity, water, air, soil and atmosphere, restoring degraded marine ecosystems by 2015 in line with the Johannesburg Plan (2002) including achievement of the maximum sustainable yield (MSY) in fisheries by 2015.
Other relevant EU policies and strategies for Natural Resources include the:
- 7th Environment Action Programme (EAP). Since the 1970s the European environmental policy has been shaped by the EAP. The 7th EAP runs until 2020 and identifies protecting, conserving and enhancing the EU’s natural capital as the first of three priorities. Furthermore, it expresses the EU’s commitment to speed up the delivery of the objectives of the EU Biodiversity Strategy to 2020 and the Blueprint to safeguard Europe’s water resources, as well as take steps to reduce nitrogen and phosphorous emissions.
- EU Biodiversity Strategy to 2020 includes six main targets to halt the loss of biodiversity and ecosystem services in the EU by 2020.
- EU Blueprint to safeguard Europe’s water resources is the current EU water policy strategy and outlines actions that concentrate on: better implementation of current water legislation, integration of water policy objectives into other policies, and filling knowledge gaps about water quantity and efficiency.
- Common Agricultural Policy is one of the most influential EU policies regarding biodiversity. It has recently been reformed to meet the challenges of soil and water quality, biodiversity and climate change and to promote environmentally friendly farming practices.
- EU Green Infrastructure Strategy addresses target 2 of the EU Biodiversity Strategy to 2020, aiming to maintain and enhance ecosystems and their services via the establishment of green infrastructure and the restoration of degraded ecosystems.
- EU Adaptation Strategy highlights the value of ecosystem-based approaches and their multiple benefits, such as reduced flood risk, less soil erosion, improved water and air quality and reduced heat island effect.
- Common Fisheries Policy is currently undergoing reform to be more sustainable, to contribute to the Europe 2020 strategy and to work towards robust economic performance of the industry including growth and enhanced cohesion in coastal regions.
- Resource Efficiency Roadmap recognises the direct and indirect impacts of EU policies on land use and aims to achieve no net land-take by 2050, as well as to reduce pressure on natural resources via the full implementation of EU environmental legislation by 2020.
Further reading on Natural Resources
- European Environment Agency (2015), The European environment — state and outlook 2015: synthesis report, Copenhagen.
- European Environment Agency (2015), State of nature in the EU Results from the Reporting under the Nature Directives 2007–2012, Copenhagen.
- European Environment Agency (2012), Protected areas in Europe – an overview. EEA Report N° 5/2012, Copenhagen.
- European Commission (2013), Green Infrastructure (GI): Enhancing Europe’s Natural Capital, COM(2013) 249 final, Brussels.
- European Bird Census Council (2012), Trends of common birds in Europe, 2012 update, Brussels.
- BirdLife (2012), On the road to recovery? BirdLife assessment of progress on the EU 2020 Biodiversity Strategy, October 2012, Brussels.
- European Commission (2011), Our life insurance, our natural capital: an EU biodiversity strategy to 2020, COM(2011) 244, Brussels.
- European Commission (2010), Facts and figures on the Common Fisheries Policy — 2010 Edition, Office for Official Publications of the European Union, Luxembourg.
See also
- Agri-environmental indicators
- All articles on sustainable development indicators
- Biodiversity statistics
- Water statistics
Further Eurostat information
Main tables
- Natural Resources
Dedicated section
Methodology
More detailed information on natural resources indicators, such as indicator relevance, definitions, methodological notes, background and potential linkages, can be found on page 257-280 of the publication Sustainable development in the European Union - 2015 monitoring report of the EU sustainable development strategy.
Notes
- ↑ For more information on Eurostat’s concept of natural resources see http://ec.europa.eu/eurostat/web/environmental-data-centre-on-natural-resources/overview/natural-resource-concepts.
- ↑ Birdlife International (2015), European Red List of Birds. Luxembourg.
- ↑ EEA (2015), State of nature in the EU. Results from reporting under the nature directives 2007–2012, Technical report No 02/2015. Copenhagen.
- ↑ Chamberlain, D.E., Fuller, R.J., Bunce, R.G.H., Duckworth, J.C. & Shrubb, M. (2000), Changes in the abundance of farmland birds in relation to the timing of agricultural intensification in England and Wales. J. Appl. Ecol. 37: 771–788; Fox, A.D. 2004. Has Danish agriculture maintained farmland bird populations? J. Appl. Ecol. 41: 427–439.; Wretenberg, J., Lindström, Å., Svensson, S., Thierfelder, T. & Pärt, T. 2006. Population trends of farmland birds in Sweden and England: similar trends but different patterns of agricultural intensification, J. Appl. Ecol. 43: 1110–1120.
- ↑ Donald, P. F., Green, R. E. and Heath, M. F. (2001), Agricultural intensification and the collapse of Europe’s farmland bird populations. Proc. Roy. Soc. Lond. B 268: 25–29.
- ↑ BirdLife International (2004), Agricultural intensification threatens Important Bird and Biodiversity Areas in Europe. Presented as part of the BirdLife State of the world's birds website. Available from: http://www.birdlife.org/datazone/sowb/casestudy/140. Checked: 24/04/2015
- ↑ BirdLife International (nd), Common bird indicators: helping to track progress towards the 2010 target.
- ↑ EEA (2015), State of nature in the EU. Results from reporting under the nature directives 2007–2012, Technical report No 02/2015, Copenhagen.
- ↑ BirdLife International (2012), On the road to recovery? BirdLife assessment of progress on the EU 2020 Biodiveristy Strategy, October 2012.
- ↑ Gregory, R.D., Noble, D., Field, R., Marchant, J., Raven, M. & Gibbons, D.W. (2003), Using birds as indicators of biodiversity. Ornis Hungar. ,12 –13, 12 –24.; Holling, M. & Rare Breeding Birds Panel (2011), Rare breeding birds in the United Kingdom 2009, Br. Birds, 104, 476–537.
- ↑ For further information see Bird Life (State of the world’s birds): http://www.birdlife.org/datazone/sowb.
- ↑ Most of the world countries lack the extensive, long-term monitoring schemes found in Europe and North-America, meaning figures for the global scale are rather ambiguous.
- ↑ Commission report, The State of Nature in the European Union: Report on the Status and Trends of Habitat Types and Species covered by the Birds and Habitats Directives for the period 2007–2012 as required under Article 17 of the Habitats Directive and Article 12 of the Birds Directive, COM(2015) 219.
- ↑ EEA (2015), State of nature in the EU. Results from reporting under the nature directives 2007–12. Technical report No 02/2015. Copenhagen.
- ↑ Financing Natura 2000 — Investing in Natura 2000: Delivering benefits for nature and people, SEC (2011) 1573 final, 12.12.2011
- ↑ EEA (2009), Water resources across Europe — confronting water scarcity and drought, EEA Report N° 02/2009, Copenhagen.
- ↑ Countries in which groundwater abstraction decreased between 2000 and 2012 include BG, HU, CZ, DK, LT, RO and SK.
- ↑ Flörke, M., Kynast, E., I Bärlund, I. et al. (2013), Domestic and industrial water uses of the past 60 years as a mirror of socio-economic development: A global simulation study. Global Environmental Change 23: p. 144–156.
- ↑ Wada, Y., van Beek, L.P.H., van Kempen, C.M., Reckman, J.W.T.M., Vasak, S. and Bierkens, M.F.P. (2010), Global depletion of groundwater resources. Geophysical Research Letters 37, L20402
- ↑ OECD. (2012). Environmental Outlook to 2050: The Consequences of Inaction. Paris, OECD. doi:10.1787/9789264122246-en.
- ↑ 2030 Water Resources Group (2009), Charting our water future: Economic frameworks to inform decision-making. Washington, DC, 2030 WRG.
- ↑ Strosser P., Dworak, T., Garzon Delvaux, P.A., Berglund, M., Schmidt, G., Mysiak, J., Kossida, M., Iacovides, I., Ashton, V. (2012), Gap Analysis of the Water Scarcity and Droughts Policy in the EU.
- ↑ EEA (2015), Chapter 3: Protecting, conserving and enhancing natural capital, in The European environment — state and outlook 2015: synthesis report, European Environment Agency, Copenhagen.
- ↑ Commission Communication, Reform of the Common Fisheries Policy, COM(2011) 417 final
- ↑ http://stecf.jrc.ec.europa.eu/documents/43805/804458/2014-11_STECF+14-16+-+AER+Fleet+economics+2014_+JRC92507.pdf
- ↑ European Commission (2009), Commission Green Paper, Reform of the Common Fisheries Policy, COM(2009)163.
- ↑ Banks, R., Cunningham, S., Davidse, W.P., Lindebo, E., Reed, A., Sourisseau, E. and De Wilde, J.W., (2002). The impact of technological progress on fishing effort, report prepared for the European Commission.
- ↑ European Commission, CFP reform — Transferable Fishing Concessions. Additional information to CFP Reform Package.
- ↑ Eurostat (online data code: fish_ca_main)
- ↑ European Commission (2014), Communication concerning a consultation on fishing opportunities for 2015 under the Common Fisheries Policy, (COM(2014) 388 final of 26 June 2014).
- ↑ See: http://www.eea.europa.eu/soer-2015/europe/maritime-activities
- ↑ FAO (2015), World fertilizer trends and outlook to 2018. Food and Agriculture Organization of the United Nations, Rome, Italy.
- ↑ EEA (2014d), Effects of air pollution on European ecosystems. Past and future exposure of European freshwater and terrestrial habitats to acidifying and eutrophying air pollutants, EEA Technical report No 11/2014, European Environment Agency, Copenhagen, Denmark.
- ↑ EEA (2015), Chapter 3: Protecting, conserving and enhancing natural capital, in The European environment — state and outlook 2015: synthesis report, European Environment Agency, Copenhagen.
- ↑ This is often referred to as a threshold, tipping point or point of no return.
- ↑ See COM (2012), BirdLlife (2012), CBD (2010) and EEA (2010) in ‘Further reading’.
- ↑ BISE http://biodiversity.europa.eu/topics/land-use-changes
