Archive:Supply, use and input-output tables - EU-USA comparison
This Statistics Explained article is outdated and has been archived - for recent articles on National accounts indicators see here.
- Data from 2010 and 2011. Most recent data: Further Eurostat information, Main tables and Database.
For the second year in a row, Eurostat has produced an EU/USA comparison, based on supply, use and input-output tables, that can be used to study patterns of globalisation.
In 2011, imports embodied in exports were back to 2008 levels in the United States and even higher in the European Union (EU) (2.7 % average annual growth) and the euro area (EA) (7.3 %). Embodied downstream and upstream services accounted for over a third of the value of EU and euro area exports and over half that of US exports. The services sector was the biggest employer.


Main statistical findings
In 2011, imports embodied in exports were back to their 2008 level in the United States and even higher in the EU and euro area.
EU, US and euro area exports and imports decreased significantly in 2009. Exports from the three economies fell by around 15 % and imports dropped by around 20 % in the EU and the euro area and around 30 % in the USA. In the two subsequent years, exports and imports increased, bringing them back to, or even above, 2008 levels.
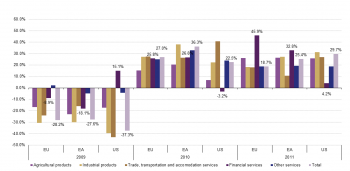
In the EU and the EA, intermediate imports embodied in exports [1] decreased by 28 % in 2009, then increased in 2010 (by 27 % in the EU and 36 % in the euro area) and again the following year (by 19 % and 25 %). In the USA, the equivalent figure fell by 37 % in 2009 but also picked up again in 2010 (by 22 %) and 2011 (by 30 %). Over the period 2008 to 2011, imports embodied in exports grew by an average of 2.7 % a year for the EU and 7.3 % for the EA. In 2011, intermediate imports embodied in exports returned to their 2008 levels in the USA. They exceeded their 2008 levels by 8 % in the EU and by 24 % in the euro area (see Figure 1 and Table 1).
In 2011, EU exporting industry was 15 % dependent on imports
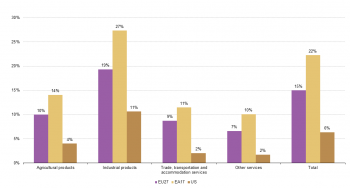
Embodied imports represented around 15 % of the value of the EU’s exports in 2011. The proportion was higher for the euro area (22 %), but in both cases the figures reflect how closely the two economies are tied in to the rest of the world in terms of trade. In the United States, intermediate imports embodied in exports represented 6 % of exports overall. Industrial exports are more import intensive than other sectors’, with figures of 19 %, 27 % and 11 % in the EU, euro area and USA respectively (see Figure 2).
Imports of financial services embodied in exports developed differently
Imports of financial services embodied in EU exports fell much less than total embodied imports after the 2008 economic crisis, with a 8.9 % decrease in 2009 as compared with a 38 % drop overall. The 25.8 % increase in embodied financial services imports from 2009 to 2010 was on a par with the increase in embodied imports generally. In 2011, they increased by 45.9 %, to 1.7 times their 2008 level. The pattern for the euro area was similar, but the drop in 2009 was sharper (18.1 %). The increase was about the same in 2010 (26.8 %), but smaller in 2011 (32.8 %). More financial services imports were embodied in US exports in 2009, 2010 and 2011 than in 2008. There was a slight decrease of 3.2 % between 2009 and 2010, but on average the level rose by 5 % a year between 2008 and 2011 (see Figure 3).
Services contribute most to EU, EA and US exports
Services account for a third of the value of EU and euro area exports and half that of US exports.
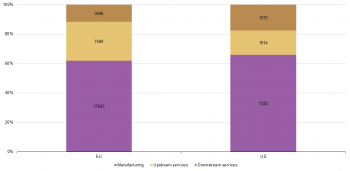
Services upstream from manufacturing activities mainly involve inputs into production, e.g. financial, real estate and professional and technical services. Downstream services include wholesale trade, transportation and storage. Downstream and upstream services each represented 7 % of the cost of each unit of manufacturing output in the USA in 2011; the figure for the EU and the euro area was 10 %. Exports from the three economies are dominated by manufactured products. In 2011, 63 % of EU exports, 70 % of euro area exports and 52 % of US exports were manufactured goods. Exports of downstream services accounted for a similar proportion of total exports in the three economies in 2011: 18 %, 14 % and 22 % in the EU, euro area and USA respectively. The same applied to exports of upstream services: 19 %, 15 % and 25 % (see Figure 4).
The services sector was the major employer in 2011
In terms of employment, in 2011 the EU and euro area economies were dominated by downstream services, with trade, transportation and accommodation services providing 43 % of all jobs, followed by upstream services (32 %) and manufacturing (25 %). In the United States, while the services sector as a whole provided 63 % of total employment, manufacturing industry provided a bigger proportion (37 %) than upstream services (35 %) or downstream services (28 %) taken in isolation. The fall in employment in manufacturing in 2008–11 exacerbated the fall in the level of total employment. It dropped by 9 % in the EU and by 8 % in the euro area. Total employment decreased by 2 %. In the USA, employment decreased by 4 % overall and by 6 % in manufacturing. Employment in upstream services increased in the EU and the euro area (by 1 % overall). The USA saw a 4 % fall, as compared with a 5 % drop for total employment (see Table 2).
Services lead employment embodied in exports
Between 2008 and 2011, the increase in employment embodied in exports came from upstream services: up by 23 % in the EU, 21 % in the euro area and 6 % in the United States.
Services employment embodied in exports made up around 40 % of total export-related employment in the EU and the USA in 2011. In 2011, EU exports supported 28.8 million jobs and US exports 11.1 million jobs. In the EU, at least 7.5 million of these jobs were in upstream services such as finance, information and professional services and another 3.4 million were in (downstream) wholesale trade, transportation and accommodation services. Over 1.8 million US jobs were created through exports in upstream services, while nearly 2 million were in downstream services. Manufacturing remains the sector in which exports most support employment: 60 % in the EU and 66 % in the USA. In recent years (2008 to 2011), however, employment embodied in exports rose less for manufactured products than for upstream services. In the EU, the former even fell slightly by 1 %, while the latter (in financial, professional and technical, and information services) increased by 23 %, equivalent to an average annual increase of 7 %. Employment in exports of downstream services is still lagging behind, with a decrease of 5 % over the period, but is now catching up to its 2007 (pre crisis) level. The euro area has been more dynamic in terms of employment embodied in exports, which increased considerably in all three sectors between 2008 and 2011: by 11 % for manufactured goods, 21 % for upstream services and 5 % for downstream services. In the United States, exports of upstream services are contributing most to the increase in employment, up by 6 % in 2008–11. Employment embodied in exports of downstream services rose by 3 % and employment embodied in manufactured exports by 2 % (see Figures 5 and 6).
Data sources and availability
On the basis of a standard input-output technique, the European input-output tables were used to calculate the results of applying the Leontief quantity model to imports and employment. First, a domestic input coefficient matrix (A) was calculated for each homogenous branch of activity, showing the direct input requirements for the production of one unit of output. Then the Leontief inverse matrix (the inverse of I — A, i.e. I, the identity matrix) was computed to obtain the matrix of output multipliers. Next, the Leontief inverse matrix was post-multiplied by a column vector of exports to calculate the total output embodied in those exports. Finally, output coefficients of imports and employment pre-multiplied the first results to obtain imports embodied in exports (or ‘import content of exports’) and employment embodied in exports.
- Embodied imports in exports or import content of exports: imports by firms directly engaged in export activities (direct effects), including imports by upstream industries for the supply of the necessary inputs (indirect effects);
- Embodied employment in exports: number of persons employed by firms directly engaged in export activities (direct effects), including those employed by upstream industries for the supply of the necessary inputs (indirect effects).
In 2013, for the first time, Eurostat compiled supply and use tables for the United States using the new NACE Rev 2 classification based on ISIC 4 and CPA 2008. The latest US ‘make’ (the make table is the transposition of the supply table) and ‘use’ tables for 2010 and 2011 are available on the Bureau of Economic Analysis (BEA) website. In December 2013, the BEA published revised make and use tables, which were based on the new benchmark tables for 2007 and in turn formed the basis for Eurostat’s tables. The ‘make’ matrix was compiled after redefinitions of data from the industry input-output (I-O) accounts. Like the ‘make’ table, the US ‘use’ table shows producer prices, while the consolidated European tables are in basic prices. Eurostat uses producer prices for the US table and basic prices for the EU table.
Context
Data are collected from the European System of National and Regional Accounts (ESA 1995) transmission programme. EU Member States transmit supply-and-use tables (SUTs) to Eurostat annually and input-output tables (IOTs) every five years, up to 36 months after the end of the reference period. The consolidated European tables for 2010 are based on data transmitted by the Member States (Eurostat lacked data for a few Member States only). Member States have to transmit 2011 data by end 2014, so the national supply-and-use tables have been estimated using a projection method (the Euro method) set out in the Eurostat Manual of supply, use and input output tables.
The SUTs give detailed information on production processes, interdependencies in production, the use of goods and services, and income generated in production. They form the basis for symmetrical input-output tables, which are produced by applying certain assumptions to the relationship between outputs and inputs, and are used by policy-makers for input-output analysis.
Environmentally extended input-output tables (EE IOTs), an extension in Eurostat, represent another powerful analytical instrument to inform policy.
Eurostat has compiled consolidated European tables for the EU-27 and the EA since September 2011. Data for 2008 to 2011 are now available.
See also
- Building the System of National Accounts - supply and use tables
- National accounts and GDP
- Supply and use tables - input-output analysis
Further Eurostat information
Publications
- In 2009, industrial products represent 28 % of the EU total output and 22 % in the US — Statistics in focus 24/2013
- European exports 2000-2007: direct and indirect effects on employment and labour income in the EU 27 and euro area — Statistics in focus 36/2012
- CO2 emissions induced by EU’s final use of products are estimated to be 9 tonnes per capita — Statistics in focus 22/2011
Database
- Supply, use and Input-output tables (naio)
- Supply, use and Input-output tables — EU aggregates (naio_agg)
Dedicated section
Methodology / Metadata
- ESA 95 Supply Use and Input-output tables’ methodology
- Eurostat Manual of Supply, Use and Input-Output Tables
- Compilation of USA SUIOT in the European classification — years 2008 to 2011, September 2014
- Consolidated European SUIOT process for years 2010 and 2011, September 2014
- Technical Documentation eeSUIOT project
Other information
External links
Notes
- ↑ It takes domestically made and imported intermediate goods to produce exports and the links between sectors have to be taken into account. Domestically made intermediate goods in turn require imported intermediates. When calculating the foreign content of exports, ‘second-stage’ imports need to be added to the imports directly embodied in the exports. Other domestically made intermediates may also be needed to produce domestically made intermediates and these may require imported inputs – and so on. All the stages are added together to produce a total of direct and indirect imports embodied in exports.