Archive:Quality of life in Europe - facts and views - environment
This article has been archived. The paper format and the PDF format latest edition, ISBN 978-92-79-43616-1, doi:10.2785/59737, Cat. No KS-05-14-073-EN-N are still available. For updated information on quality of life, see Quality of life indicators - natural and living environment.
Source: Eurostat (ilc_mddw02) and (ilc_mddw01)
Source: Eurostat (ilc_mddw02) and (ilc_mddw01)
Source: Eurostat (ilc_mddw02) and (ilc_mddw01)
Source: European Environment Agency, Eurostat (tsdph370)
Source: European Environment Agency, Eurostat (tsdph370) and (ilc_mddw02)
Source: Eurostat (ilc_pw05)
Source: Eurostat (ilc_pw01) and (ilc_pw05)
Source: Eurostat (ilc_pw01) and (ilc_pw05)
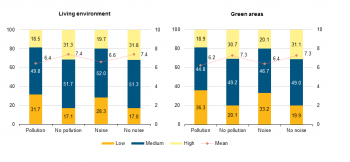
Source: Eurostat (EU SILC)
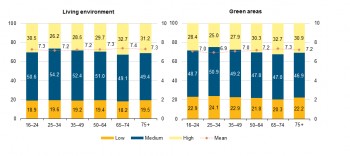
Source: Eurostat (ilc_pw01) and (ilc_pw05)
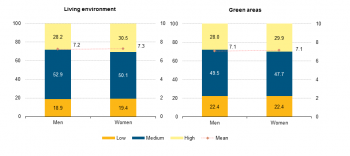
Source: Eurostat (ilc_pw01) and (ilc_pw05)
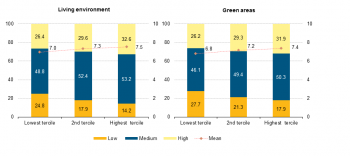
Source: Eurostat (EU SILC)
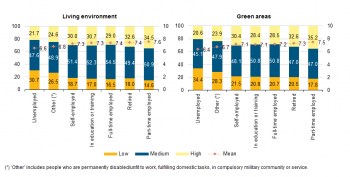
Source: Eurostat (EU SILC)
Source: Eurostat (ilc_pw01) and (ilc_pw05)
Source: Eurostat (ilc_pw02)
Source: Eurostat (EU SILC)
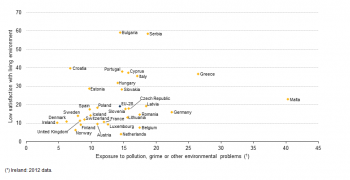
Source: Eurostat (ilc_pw05) and (ilc_mddw02)
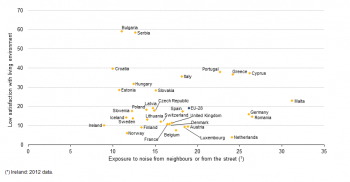
Source: Eurostat (ilc_pw05) and (ilc_mddw01)
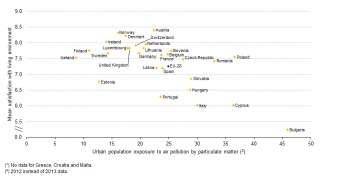
Source: Eurostat (ilc_pw01) and (tsdph370)
This article on natural and living environment is the eighth in a series of nine articles forming the publication Quality of life in Europe - facts and views. The article takes an innovative approach and uses data on subjective evaluations of different domains, collected for the first time in European official statistics. Objective indicators belonging to the same area are used to complement and analyse this type of information.
Main statistical findings
Environment in the quality of life framework
According to the data available at EU level, the reported exposure of people to pollution, grime and other environmental problems has decreased over the last decade. The same can be observed for exposure to noise from neighbours or from the street. However, in 2013, around one out of seven people declared still being exposed to pollution and one out of five to noise. Additionally, in most EU-28 Member States, people at risk of poverty were more exposed to pollution and noise than the non-at-risk population. Following the implementation of EU policies and legislation, the exposure of city dwellers to PM has decreased since 2005, but considerable differences prevail across Member States.
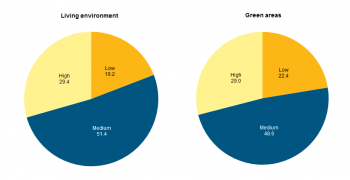
Under these background conditions, on average, about 30 % of EU residents declared a high satisfaction with the living environment and recreational or green areas situated close to their place of residence, 20 % a low satisfaction and the remaining 50 % a medium satisfaction. On a scale from 0 to 10[1], this represents an overall mean satisfaction of 7.3 with the living environment and 7.1 with green areas.
Unsurprisingly, mean satisfaction with the living environment is lower among the population affected by pollution or noise. It differs to various extents depending on the socio-demographic group an individual belongs to. Satisfaction with living environment was merely associated with gender and not strongly influenced by age, although the older age groups tended to declare a higher level of satisfaction. The impact of the labour status is clear: the part-time employed, followed by the retired, were the most satisfied with their living environment and green areas, for different reasons. People with the highest level of education and those belonging to the highest income tercile were also more likely to have a higher level of satisfaction, notably due to a higher capacity to afford better living conditions including a better surrounding environment. Living in sparsely populated areas brings about a slightly higher likelihood of being satisfied with the environment, as these areas are less affected by pollution.
In 2013, while 19.2 % of EU residents declared a low level of satisfaction with their environment, the relationship with the reported levels of exposure to pollution and noise at country level was a loose one. However, in general, northern and western EU Member States tend to have lower proportions of people declaring a low satisfaction with their environment and lower levels of exposure to pollution and noise than eastern and southern EU countries. Environmental satisfaction of the urban population and urban exposure to air pollution by PM followed that rule more strictly, highlighting a clear relationship between these two variables.
Pollution in the EU
The EU population is less exposed to pollution than a few years ago
Air pollution, grime and noise were among the most common forms of pollution affecting populations in the EU. Exposure to these forms of pollution could have damaged human health and hence affected the quality of life. Air pollutants such as particulate matter can be dangerous to health, especially for people with heart and lung diseases. The particles are small enough to be carried into the lungs and cause inflammation.
Noise pollution can have serious direct and indirect health effects such as hypertension, high stress levels, sleeping disorders and, in extreme cases, even hearing loss. Stress and hypertension have been reported as the leading causes of a whole set of health problems, see the EU Policy on environmental noise.
Additional forms of pollution, such as grime and other local environmental problems (i.e. smoke, dust, unpleasant smells or polluted water) can also affect human health and the quality of the surrounding environment, and therefore Impact the subjective well-being.
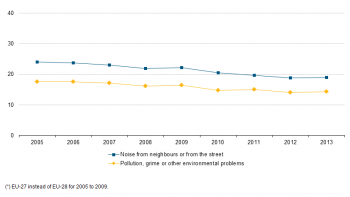
As illustrated in Figure 1, a smaller proportion of EU residents reported being exposed to pollution in 2013 than in 2005. In 2013, around one in seven residents (14.4 %) was still suffering from pollution, grime or other environmental problems[2] a decrease from 17.6 % in 2005. At the same time, one in five residents (19.0 %) reported being exposed to noise from neighbours or from the street in their living area, a decrease from 24.0 % in 2005.
Definition of noise from neighbours and from the street
'Noise from neighbours’ is described as noise from neighbouring apartments, staircase or water pipe. ‘Noise from the street’ is described as noise linked to traffic (street or road, plane, railway), linked to business, factories, agricultural activities, clubs and yard).
The EU population was less exposed to pollution in 2013 than in 2005 (14 % compared with 18 %) as well as to noise (19 % compared with 24 %).
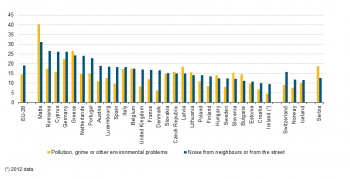
The values in Figure 1 however, are only averages. The self-reported exposure levels across individual EU Member States varied by a factor of around 10 for pollution and 3.5 for noise exposure (see Figure 2). Malta was an extreme case: 40.3 % of its population declared being exposed to pollution while 31.2 % declared being subjected to noise. At the other end of the spectrum, 4.8 % of Ireland’s residents reported being exposed to pollution and about twice as many to noise.
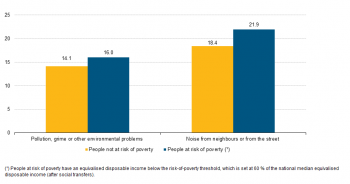
Figure 3 shows that those people at risk of poverty — earning less than 60 % of median equivalised income — were on the whole more exposed to pollution, grime and other environmental problems (by 1.9 percentage points) and noise (by 3.5 percentage points) than those not at risk of poverty.
This reflects the fact that in most EU Member States the population at risk of poverty tended to be located in densely populated urban areas with more environmental problems
There were a few EU Member States where the population at risk of poverty was less exposed to pollution than the population not at risk of poverty. These concerned mainly rural populations living in areas with fewer environmental problems (See Eurostat, Statistics Explained Income and living conditions by degree of urbanisation (2013)).
The section below focuses on air pollution by PM, a commonly measured environmental problem affecting urban areas.
Pollution by particulate matter has slightly declined in recent years but the 2010 target has not been met
Urban air pollution is usually analysed via indicators measuring exposure to PM and ozone[3]. PM consists of tiny pieces of solid or liquid matter from both natural and human-made sources emitted into the atmosphere. The leading human-made source of particle pollution is combustion which, in urban areas, mainly originates from diesel engines and industrial, public, commercial and residential heating (See Eurostat, Sustainable development in the European Union — 2013 Monitoring report of the EU sustainable development strategy (2013), Luxembourg, p. 172.). Fine particulates (PM10), i.e. PM whose diameter is less than 10 micrometres, can be carried deep into the lungs where they can cause inflammation and gravely affect people with heart and lung conditions.
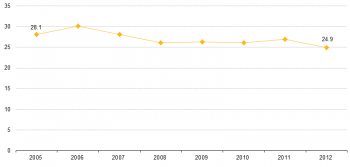
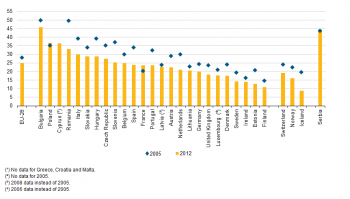
Figure 4 illustrates the trend in the exposure levels of the urban population[4] to PM since 2005[5]. At 28.1 micrograms per cubic metre (µg/m³) in 2005, PM concentrations have gone through ups and downs over time, peaking at 30.1 µg/m³ in 2006, before starting to decline in 2007 to reach 24.9 µg/m³ in 2012.
The EU average conceals significant variations between EU Member States, with 2012 exposure levels ranging between 11 µg/m³ in Finland and 46 µg/m³ (or four times as much) in Bulgaria (Figure 5). In general, the lowest levels of exposure — below 20 µg/m³ — were recorded in EU Member States that were mostly situated in northern and central parts of the EU, Estonia being an exception. Nonetheless, while all EU Member States (for which data is available) — except France and Poland — managed to reduce exposure levels since 2005, the most remarkable progress was achieved in Hungary (decrease of 10.2 percentage points) and Romania (decrease of 16.4 percentage points).
The EU Member States that managed to decrease their exposure to PM did so by reducing the proportion of diesel-engined road vehicles among city-dwellers, lowering the average age of the car fleet in general, diversifying energy sources(especially for heating) and setting up policies at country level to reduce exposure. At 34.3 %, the proportion of energy consumption derived from renewable energy sources in Finland was very high — more than twice as much as in Bulgaria (16.3 %) and in the EU-28 overall (14.1 %)[6].
PM concentrations also depend on meteorological and natural conditions. Dry and hot weather lead to stagnant air with high concentrations of pollutants and anomalously cold winters are linked to higher emissions of air pollutants from fuel combustion. Natural sources include dust and sand (blown for instance from North Africa and affecting EU Member States bordering the Mediterranean) as well as smoke from forest fires[7]. The 2006 peak for example was partially the result of a severe heat wave during the summer period, and potentially the ‘El Niño’ phenomenon[8], whose combined effects led to the high PM concentrations recorded that year. Moreover, the representativeness of the monitoring stations was limited, making comparisons across EU Member States challenging and thus the indicator difficult to interpret[9]. Despite that, the trend was quite robust, and the differences between EU Member States seemed plausible.
Nearly one third of EU residents were very satisfied with the quality of their immediate environment
While the EU residents were less exposed to pollution (including air pollution, grime or other environmental problems in the local area and noise from neighbours or the street) than a few years ago, about half of them declared having a medium satisfaction with their living environment and recreational or green areas situated in the area where they live. Around one in three reported being highly satisfied and one in two reported a low satisfaction with their immediate environment. As a whole this translated into a mean satisfaction with environment and green areas of 7.3 and 7.1 respectively (on a scale of 0 to 10)[10].
Living environment and place where they live
The term ‘living environment’ refers to the access to services (e.g. shops, public transport, etc.), the presence of cinema, museums, theatres, etc. in the places where the respondent lives.
The ‘place where the respondent lives’ refers to the place situated close to the place of residence (where the respondent usually goes shopping, goes for a walk, goes the way home).
The term ‘recreational or green areas’ refers to the places where the respondents can walk, cycle, do some recreational activities, etc.).
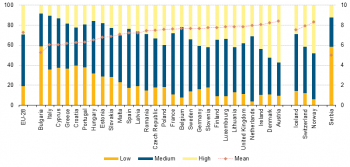
This overall perception of their immediate environment by EU residents conceals some very clear differences between EU Member States (Figure 7a). National assessments of living environment were rated between 5.2 in Bulgaria (followed by Italy and Cyprus both at 6.0) and 8.4 in Austria (followed by Denmark at 8.2, and Ireland and the Netherlands both at 8.0). Bulgarian residents were also the most likely to report a low satisfaction with their environment (59.0 %), while the Dutch reported the lowest share of people unhappy with their environment (4.0 %). While some EU Member States presented similar means, they displayed quite different distributions in the levels of satisfaction. For instance, the share of Belgian residents reporting either a low (7.5 %) or a high (22.2 %) satisfaction was about half the proportion reported by residents in Germany, Slovenia and Poland, although their means only varied by 0.1 point rating (between 7.6 and 7.7 out of 10).
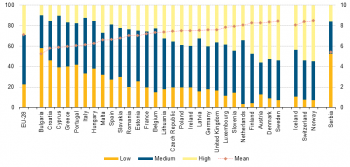
Satisfaction with green areas[11] (Figure 7b) revealed similar perceptions as with the findings on living environment in most EU Member States. The lowest mean satisfaction was again reported by Bulgarian residents, averaging at 5.2, followed by residents in Croatia, Cyprus and Greece (all below 6.0). At the other end of the scale, the highest mean was recorded by the residents of Sweden (8.4), followed by Denmark, Austria, Finland and the Netherlands (all over 8.0).
In 2013, Austria was the EU Member State which recorded the biggest share of people with high satisfaction with their living environment (57 %) as with their green areas (56 %).
Exposure to pollution and noise reduced the well-being of the population
There was strong evidence to suggest that environmental problems were associated with lower subjective well-being. Figure 8 highlights the connection between the prevalence of environmental problems, such as pollution and noise, on the EU-28 population’s perception of their immediate environment.
The mean satisfaction of EU residents with their living environment and green areas was higher among the population not affected by pollution or noise. Average satisfaction among that group tended to be higher by about 1 point rating. When analysing the proportion of people with a low level of satisfaction, the differences were even more striking. The share of people exposed to pollution that reported a low satisfaction with their living environment and green areas was almost double that of those who were not exposed.
Exposure to pollution had a slightly stronger negative effect on the satisfaction with living environment than exposure to noise. However, it is worth mentioning that in 2013 a greater share of the EU population reported being exposed to the latter (19.0 % versus 14.4 % for pollution) (see Table 1).
Satisfaction with living environment and nearby green areas varied across different socio-demographic groups
This section will analyse how belonging to certain socio-demographic groups (for example age categories, gender, income terciles, labour status, education attainment levels, types of population area) is associated with an individual’s satisfaction with their environment.
Satisfaction with one’s living environment was lowest among the intermediate age groups
There were no striking differences between satisfaction with the environment and satisfaction with green areas across the different age groups (Figure 9). In particular, the mean environmental satisfaction ranged from 7.2 out of 10 for the population aged 25–34 and 35–49 to 7.4 for the population aged 65–74. Mean satisfaction with green areas ranged from 6.9 out of 10 for the population aged 25–34 to 7.3 for the population aged 65–74.
These figures denoted a lower average degree of satisfaction among the population entering working life and a higher satisfaction among those leaving it. These differentials probably had to be seen relative to diverging financial resources, enabling the older age groups to live in a nicer environment.
As of a certain age (75+) satisfaction declined again, following a trend similar to that observed for overall life satisfaction. (See articles 1 Material living conditions and 9 Overall subjective well-being).
Men and women were almost equally satisfied with their living environment and nearby green areas
When looking at male and female average satisfaction with living environment and green areas (Figure 10), it appears that the two genders were almost equally satisfied[12]. Nonetheless, women tended to be slightly more likely to report a high level of satisfaction.
Income levels gave rise to inequalities regarding satisfaction with respondents’ living environment and nearby green areas
As can be seen from Figure 11, socio-economic factors such as income had a big impact on the level of satisfaction of EU residents. Indeed, the mean satisfaction with living environment ranged from 7.0 to 7.5 out of 10 for those residents in the lowest and highest income terciles respectively and the mean satisfaction with green areas ranged from 6.8 to 7.4 out of 10 for those people in the lowest and highest income terciles respectively.
With higher disposable income, the population belonging in the highest tercile was able to look back on a larger selection of opportunities when looking for a residence, which was in turn likely to result in a surrounding environment of better quality and superior housing conditions, explaining their higher assessment of environment and green areas.
Satisfaction with living environment and green areas was highest among the part-time employed and the retired
The impact of the respondents’ labour status on their level of satisfaction with the environment and green areas was undeniable, as showed in Figure 12. On average, unemployed people were much less satisfied with their environment and green areas than the other groups, which was probably due to a lack of resources and the ensuing reduced capacity to afford a dwelling in the nicer neighbourhoods. On the other hand, the part-time employed, followed by the retired population, were the most satisfied with their living environment and green areas.
Education and satisfaction with living environment were closely linked
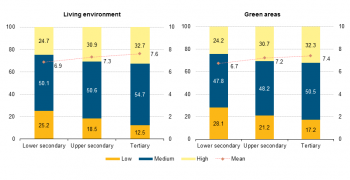
When looking at satisfaction from an education perspective (Figure 13), tertiary graduates appeared to be the most satisfied, with a mean of 7.6 out of 10 for satisfaction with living environment and a bit less, 7.4 out of 10, for satisfaction with green areas. Conversely, the least educated were also the least satisfied with environment and green areas, at 6.9 and 6.7 out of 10 respectively. Those respondents that had graduated from tertiary education were also quite likely to be more qualified hence hold the better paid jobs which allowed them to opt for a better living environment and housing conditions.
People living in rural areas were more satisfied with their living environment
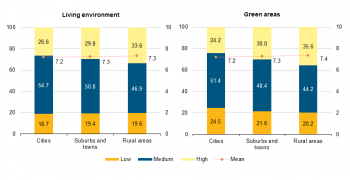
The EU residents living in the less-densely populated areas, in particular rural areas, or suburbs and towns, had a higher propensity to be more satisfied with their environment and green areas than those living in the most densely-populated city areas (Figure 14). The differential was higher (though by merely 0.2 points) for mean satisfaction with green areas as densely populated regions generally tended to offer fewer green spaces than rural areas (Eurostat regional yearbook 2014 (2014), p. 27).
High concentrations of population engender higher levels of pollution which may give rise to a wide range of environmental problems, such as excessive water and energy use, high production of wastewater, concentrations of PM above limits, high exposure to noise from traffic or other sources, etc.
Relationship between satisfaction with living environment and the magnitude of environmental problems at country level
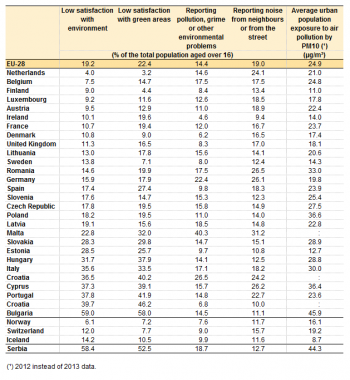
Table 1 compares the shares of EU residents reporting a low satisfaction with their environment and green areas with the shares of the population exposed to pollution and noise and the average exposure to air pollution by PM10 in urban areas, in 2013.
It appears that the proportions of people having declared being exposed to pollution (14.4 %) or noise (19.0 %) in their living area were lower than the shares of people who indicated a low satisfaction with their living environment (19.2 %) or green areas (22.5 %). The EU urban population was also exposed to air pollution by PM averaging 24.9 µg/m³ which could be seen in conjunction with the residents’ overall satisfaction with their environment at 7.3 out of 10 (mean rating, see Figures 6 and 7).
The section below analyses the assessments of the EU residents’ living environment, by comparing their levels of low satisfaction with the shares of those who declared being affected by exposure to pollution or noise, and their mean satisfaction with the average levels of exposure to PM10[13] at country level.
Exposure to pollution was not strongly correlated with low satisfaction with the environment
Figure 15 displays a comparison between the shares of population who reported exposure to pollution, grime and other environmental problems[14] and a low satisfaction with their environment in 2013. These figures show a heterogeneous picture, in which northern and western EU Member States generally tended to report more positively about their environment than southern and eastern EU Member States. The tendency of northern and western EU Member States to evaluate their environmental conditions more positively was reflected in the figures from Ireland, Finland and Denmark whose residents reported very close to or below 10 % for both low satisfaction and exposure. Conversely, the trend in southern and eastern EU Member States to evaluate their environmental conditions more negatively was the most visible in Greece whose residents reported high proportions of low satisfaction with living environment (36.5 %) and exposure to pollution (26.5 %). Malta was an outlier with the highest share of residents having declared to be exposed to pollution (40.3 %) and a comparatively low share of people having stated a low satisfaction with their living environment (22.8 %).
However, the populations that registered the lowest shares of low environmental satisfaction did not systematically record the lowest percentages of exposure to pollution, and vice-versa. Hence, the Netherlands reported the lowest share of population with a low satisfaction with their living environment (slightly under 4 %) while the share of the population that reported exposure to pollution was close to the EU average (14.6 %).
With similar self-declared exposure figures (14.5 %), the Bulgarian residents had a much worse assessment of their environment as almost 60 % of them reported a low level of satisfaction with their living environment. Although less clear-cut, fewer than 10 % of Estonian and Croatian residents declared an exposure to pollution, however close to 30 % and 40 % of them respectively declared a low environmental satisfaction.
Ireland recorded the smallest percentage of self-reported exposure to pollution (4.8 %) and to noise (9.0 %) in 2013 among the EU Member States. This country also had one of the smallest shares of people with low satisfaction with their living environment (10.13 %).
The link between environmental satisfaction and noise exposure was also loose
In 2013, 19.0 % of the EU-28 population (Figure 16) declared being exposed to noise from neighbours or from the street, whether originating from traffic, businesses, factories or other[15], which was about 4.5 percentage points higher than exposure to pollution (14.4 %) and just slightly higher than the share of the population having declared a low satisfaction with their environment (19.2 %, see Table 1).
To some extent, EU Member States in Figure 16 are displayed in a rather similar way than in Figure 15. More northern and western EU Member States were situated in the bottom section of the graph reflecting relatively moderate shares of people reporting a low environmental satisfaction and exposure to noise (mostly not exceeding the EU average). On the contrary, more southern and eastern EU Member States were situated in the top section reflecting high shares of people with a low satisfaction, not necessarily associated with high shares of exposure. Ireland was the only country with both the share of people declaring exposure to noise and of low satisfaction approaching 10 %, which was rather low. The opposite was true for three southern EU Member States (Cyprus, Greece and Portugal), for which the proportions of people exposed to noise and also with a low level of satisfaction with their living environment were higher than the average.
Malta once again was an outlier, displaying a low share of people reporting a low satisfaction with their living conditions (22.8 %) despite its high share of reported exposure to noise (31.2 %). To a lesser extent, this pattern was also seen in Germany, Romania and the Netherlands.
Bulgaria was also an exception as its reported share of people with a low satisfaction with their living environment was almost 6 times higher than the share of people exposed to noise (59.0 % versus 11.1 %). Croatia and Serbia displayed quite a similar pattern.
National perceptions differ from country to country. For instance, EU Member States located around (or close to) the Mediterranean Sea (e.g. Italy, Portugal, Cyprus) reported higher levels of noise and lower environmental satisfaction. However other EU Member States such as Germany, Romania and Malta showed no sign of correlation between noise and satisfaction levels. This might mean that noise was not systematically seen as a real or major disturbance. In addition, the degree of perceived disturbance may fluctuate, as levels of noise do, depending on the specific local conditions and time. While cultural differences may have played a role, they may also indicate that environmental satisfaction relies on a more comprehensive set of factors affecting residents’ every-day life more deeply.
Clear relation between exposure to PM and mean satisfaction with the environment in urban areas
Figure 17 tries to establish a link between the mean satisfaction with environment by EU residents living in (densely-populated) urban areas (mean rating of 7.2 out of 10) and their level of exposure to air pollution by PM (24.9 µg/m³ in 2013, declining from 28.1 µg/m³ in 2005, see Figure 4), and highlights a real link between the two variables.
In the majority of EU Member States, a high mean satisfaction with the living environment reported by the urban population was usually associated with levels of air pollution (as measured by PM10 exposure) below the EU average and vice-versa. This was especially true among Danish and Finnish urban residents (with a mean at 8.6 and 8.2 out of 10 versus an average exposure of 17.4 µg/m³ and 11.0 µg/m³ respectively) as well as among Swedish and Irish urban residents.
The most distinct example of the link at the other end of the spectrum was Bulgaria, which recorded both the lowest mean environmental satisfaction (5.3 out of 10) and the highest average exposure to PM in urban areas (45.9 µg/m³). Cyprus and Italy clearly followed that pattern as well. Estonia, whose residents were slightly more exposed to air pollution than in Finland (12.7 µg/m³), reported a much lower degree of satisfaction (6.8 out of 10). Poland and Estonia did not follow the general pattern as a high mean satisfaction in Poland (7.9 out of 10) was associated with high levels of exposure to PM (36.6 µg/m³), and a low mean in Estonia (6.7 out of 10) was associated with low levels of exposure (12.7 µg/m³).
The analysis of mean satisfaction with living environment in Figure 14 showed a mean varying by 0.1 only depending on the degree of urbanisation. From these findings, one could presume that the populations living in suburbs, towns and rural areas would follow the same pattern as in urban areas.
While the link between satisfaction with the living environment and pollution or noise levels may not be very clear, the link between average satisfaction with living environment and urban exposure to PM is more evident. This finding should however be interpreted with caution since PM10 exposure data is not fully reliable.
Nevertheless people are undeniably paying more and more attention to the quality of their urban environment and particularly the air quality. The high visibility of the issue in the media, with a particular focus on the effects on lungs and especially on children’s health, may be one of the reasons for this. This awareness, whether mediated or experienced, is expected to influence people’s perceptions.
Data sources and availability
An ad-hoc module on subjective well-being was implemented in the EU-SILC 2013. This module contains subjective questions (e.g. How satisfied are you with your life these days?) which complement the mostly objective indicators from existing data collections and social surveys.
The "GDP and beyond" communication, the SSF Commission recommendations, the Sponsorship on measuring progress, and the Sofia memorandum all underlined the importance of collecting high quality data about people's quality of life and well-being and the central role that statistics on income and living conditions (SILC) have to play in this improved measurement. The collection of micro data related to well-being therefore is a key objective. In May 2010 both the Living Conditions Working Group and the Indicators Sub-Group of the Social Protection Committee supported Eurostat's proposal to collect micro data related to well-being within the 2013 module of SILC in order to better respond to this request.
For more information please visit: Eurostat - GDP and beyond - Quality of life
Indicators related to natural and living environment
The topic ‘natural and living environment’ covers indicators on exposure to pollution (both self-reported and objectively measured) and to noise or other environmental problems which are primarily derived from EU statistics on income and living conditions (EU-SILC). It also includes indicators related to satisfaction with recreational and green areas and with the immediate living environment which have been developed in SILC 2013 ad hoc module on subjective well-being. The Urban population exposure to air pollution by particulate matter (PM) is a Sustainable Development Indicator (SDI). It is used for the assessment of progress towards the objectives and targets of the EU Sustainable Development Strategy. It is also a Resource Efficiency Indicator, as it has been chosen as a lead indicator presented in the Resource Efficiency Scoreboard for the assessment of progress towards the objectives and targets of the Europe 2020 flagship initiative on Resource Efficiency.
Context
There is a strong consensus among European Union (EU) residents about the importance of environmental protection, the most worrying issues being air pollution and water pollution [16]. This importance is made clear to policy-makers via opinion polls, social media and interest groups. The living environment affects different facets of people’s lives, by impacting their health and well-being. Indeed, pollution has direct adverse effects on fundamental resources such as clean water, but also indirect effects on ecosystems and biodiversity. These may sometimes lead to natural disasters.
Most residents think that environmental issues have a direct impact on their daily life and on the economy [17]. Together with economic factors (such as income) environmental preferences may determine their choices, for instance, when selecting their place of residence.
Although environmental indicators are relatively abundant, they are often too specific or focused on the natural environment to be of much use in a quality-of-life perspective. However some provide valuable information, especially when combined with self-reported assessments of the quality of one’s environment. Thus, the analysis below focuses on environmental indicators such as air quality and self-reported exposure to noise and pollution, together with the satisfaction of EU residents with their living environment.
The analysis initially provides an overview of the self-reported exposure to any kind of pollution, grime and environmental problems, complemented by a focus on air pollution by particulate matter (PM) in urban areas, measured at the aggregated (country) level (objective indicators). The satisfaction with one’s living environment reported by various groups (population divided by age groups, sex, income terciles, labour status, education levels and degrees of urbanisation) will then be examined. Lastly, the analysis compares the proportion of people with a low level of satisfaction with their living environment and the shares of exposure to noise and pollution reported in EU Member States.
EU policies related to natural and living environment
The dimension ‘natural and living environment’ of the Quality of Life Framework refers to environmental aspects of quality of life. Environmental conditions affect human health and well-being both directly and indirectly, while residents value their rights to access environmental resources. Moreover, environmental factors indirectly affect other quality of life aspects, including economic prosperity and inequality, e.g. by directly affecting property prices and housing conditions. Recognising the importance of this dimension, the Sixth Environment Action Programme (EAP) includes environment (and within this topic air pollution) as one of the four main target areas in which more needs to be done. Reducing noise pollution is also an objective in EU policy. The Environmental Noise Directive (2002/49/EC) is one of the main instruments to identify noise pollution levels and to trigger the necessary actions both at Member State and at EU level.
See also
- All articles on Environment
- All articles on Living conditions and social protection
- Quality of life indicators (online publication)
Further Eurostat information
Main tables
- Income distribution and monetary poverty (t_ilc_ip)
- Monetary poverty (t_ilc_li)
- Monetary poverty for elderly people (t_ilc_pn)
- In-work poverty (t_ilc_iw)
- Distribution of income (t_ilc_di)
- Material deprivation (ilc_md)
- Material deprivation by dimension (t_ilc_mddd)
- Housing deprivation (t_ilc_mdho)
- Environment of the dwelling (t_ilc_mddw)
- Environment Europe 2020, see:
- Urban population exposure to air pollution by particular matter (tsdph370)
Database
- Income distribution and monetary poverty (ilc_ip)
- Monetary poverty (ilc_li)
- Monetary poverty for elderly people (ilc_pn)
- In-work poverty (ilc_iw)
- Distribution of income (ilc_di)
- Material deprivation (ilc_md)
- Material deprivation by dimension (ilc_mddd)
- Economic strain (ilc_mdes)
- Economic strain linked to dwelling (ilc_mded)
- Durables (ilc_mddu)
- Housing deprivation (ilc_mdho)
- Environment of the dwelling (ilc_mddw)
- EU-SILC ad hoc module (ilc_ahm)
Dedicated section
Methodology / Metadata
- Income and living conditions (ESMS metadata file — ilc_esms)
Source data for tables and figures and maps (MS Excel)
Notes
- ↑ Where 0 means not at all satisfied and 10 completely satisfied; low satisfaction refers to 0-5 ratings, medium satisfaction refers to 6-8 and high satisfaction to 9-10.
- ↑ Pollution, grime or other environmental problems in the local area such as smoke, dust, unpleasant smells or polluted water: no common standards are defined. The local area refers to a place situated close to the place of residence. Examples of problems may include: road dust, exhaust gases of vehicles; smoke, dust or unpleasant smells from factories; unpleasant smells of wastes or sewerage; polluted water from water pipe as well as polluted river. The specific problem may be caused by traffic or industry.
- ↑ Ozone is a substance that caused health problems and damages ecosystems, agricultural crops and materials. Source: Eurostat (online data code: tsdph380).
- ↑ Selected European cities.
- ↑ The indicator shows the population weighted annual mean concentration of particulate matter at urban background stations in agglomerations. Fine and coarse particulates (PM10) are particulates whose diameters are less than 10 micrometres. The population covered is the total number of people living in cities with at least one monitoring station at a background location.
- ↑ Share of renewable energy in gross final energy consumption. Source: Eurostat (online data code: nrg_ind_335a).
- ↑ Urban population exposure to air pollution by particulate matter. Source: Eurostat (online data code: tsdph370) — Indicator Profile (ESMS).
- ↑ El Niño was originally the name used for warmer than normal sea surface temperatures in the Pacific Ocean off the west coast of South America. It occurs when the easterly winds die down, in turn allowing for warmer waters normally kept in the western Pacific to drift eastward towards the Americas. The phenomenon is expected to have led to higher temperatures hence higher concentrations of PM.
- ↑ The number of stations measuring the concentration of pollutants and their location changed in some of the countries. Source: Eurostat (online data code: tsdph370) — Indicator Profile (ESMS).
- ↑ Where 0 means not at all satisfied and 10 completely satisfied; low satisfaction refers to 0–5 ratings, medium satisfaction refers to 6–8 and high satisfaction to 9–10.
- ↑ Source: Eurostat EU-SILC 2013 ad-hoc module on subjective well-being.
- ↑ The difference is a marginal 0.05 point for both environment and green areas; due to figure rounding this difference only appears in environmental satisfaction.
- ↑ Urban population.
- ↑ In the local area such as smoke, dust, unpleasant smells or polluted water.
- ↑ In some countries there is a very limited number of stations (in some cases only one) and the corresponding figures should be interpreted very carefully. The comparability across countries is restricted due to the differences in the quality of the national monitoring station networks. Comparability over time is ensured. See: http://ec.europa.eu/eurostat/cache/metadata/EN/tsdph370_esmsip.htm.
- ↑ See European Commission (2014). Special Eurobarometer 416 Attitudes of European citizens towards the environment, p.11-12.
- ↑ See European Commission (2014). Special Eurobarometer 416 Attitudes of European citizens towards the environment, p.54.