Archive:Mining of coal and lignite statistics - NACE Rev. 2
This Statistics Explained article is outdated and has been archived - for recent articles on structural business statistics see here.
- Data from April 2013. Most recent data: Further Eurostat information, Main tables and Database.
This article presents an overview of statistics for mining of coal and lignite in the European Union (EU), covering NACE Rev. 2 Division 05.
(% share of sectoral total) - Source: Eurostat (sbs_na_ind_r2)



(% share of sectoral total) - Source: Eurostat (sbs_sc_ind_r2)
Main statistical findings
Structural profile
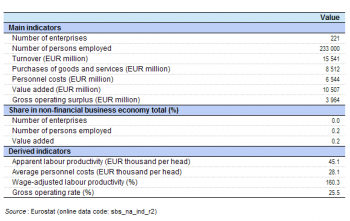
Enterprises operating with mining of coal and lignite (Division 05) as their main activity employed 233 thousand persons in the EU-27 in 2010, equivalent to 0.2 % of all persons employed in the non-financial business economy (Sections B to J and L to N and Division 95) and 37.9 % of those working in the mining and quarrying sector. These enterprises generated EUR 10.5 billion of value added which was also 0.2 % of the non-financial business economy total, or some 12.5 % of the added value for the whole of mining and quarrying.
The apparent labour productivity of the EU-27’s mining of coal and lignite sector in 2010 was EUR 45.1 thousand per person employed, slightly above the non-financial business economy average of EUR 44.8 thousand per person employed but well below the much higher mining and quarrying average of EUR 137.0 thousand per person employed. In contrast to this relatively high apparent labour productivity, average personnel costs within the EU-27’s mining of coal and lignite sector were, at EUR 28.1 thousand per employee, below the average of EUR 30.9 thousand per employee for the whole of the non-financial business economy. The wage-adjusted labour productivity ratio combines the two previous indicators and shows the extent to which value added per person employed covers average personnel costs per employee. Due to relatively high productivity and relatively low average personnel costs (when compared with the non-financial business economy average), the EU-27’s mining of coal and lignite sector had a wage-adjusted labour productivity ratio of 160.3 % in 2010, somewhat higher than the non-financial business economy average (144.8 %).
The gross operating rate (the relation between the gross operating surplus and turnover) is one measure of profitability; it stood at 25.5 % for the EU-27’s mining of coal and lignite sector in 2010, more than double the non-financial business economy average (10.1 %). It should be noted that this measure does not take account of depreciation or financial expenditure, which are typically higher in capital-intensive activities.
Sectoral analysis
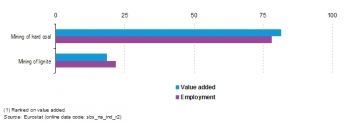
The mining of coal and lignite sector is broken down in the NACE classification into two subsectors at the NACE group level of detail. The mining of hard coal (Group 05.1) was the largest of these two subsectors in terms of employment and value added in the EU-27: it generated 81.5 % of sectoral value added and occupied 78.2 % of the workforce. The mining of lignite (Group 05.2) made up the remainder of the mining of coal and lignite sector. As such, the contribution of the two subsectors to the mining of coal and lignite total was similar in terms of their shares in both sectoral value added and employment (as shown in Figure 1).
This apparent similarity was not reflected across all indicators, and differences between the two subsectors were particularly pronounced in relation to labour costs. At the NACE group level, EU-27 average personnel costs per employee were EUR 30.0 thousand per employee for hard coal mining in 2010 while they were just EUR 21.5 thousand per employee for lignite mining. The relatively high apparent labour productivity figure for the whole of the EU-27’s mining of coal and lignite sector was due to a higher apparent labour productivity for the larger hard coal mining subsector (EUR 47.0 thousand per person employed) than for the smaller mining of lignite subsector where apparent labour productivity of EUR 38.2 thousand per person employed was below the non-financial business economy average. This relatively low apparent labour productivity for lignite mining was more than offset by low average personnel costs and resulted in an EU-27 wage-adjusted labour productivity ratio that reached 177.7 %, well above the corresponding ratio for hard coal mining (156.9 %) and even higher than the non-financial business economy average (144.8 %).The relatively low personnel costs for lignite mining also helped to raise the EU-27 gross operating rate in this subsector to 23.5 % in 2010, although this remained below the rate of 26.1 % for hard coal mining; while these two rates were clearly far above the non-financial business economy average (10.1 %) they were slightly lower than the mining and quarrying average (28.3 %).
Country analysis
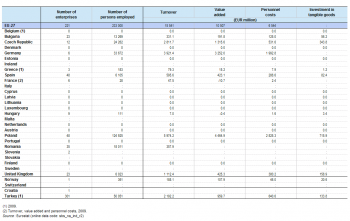
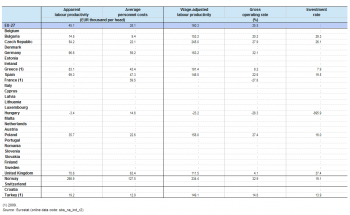
At least 11 EU Member States had no enterprises (and therefore no output or employment) in the mining of coal and lignite sector in 2010 — see Tables 4a and 4b. Poland recorded the highest share (42.5 %) of EU-27 value added within the mining of coal and lignite sector in 2010, while Germany and the Czech Republic were also relatively important producers in value added terms; the combined output of these three Member States was equivalent to 86.0 % of EU-27 total output in this sector. Poland also had the largest workforce for the mining of coal and lignite, 124.9 thousand persons, over half the EU-27 total. The relatively high share of a small number of Member States in the EU-27’s value added and employment for the mining of coal and lignite sector underlined the geographical concentration and specialisation of this sector.
Poland had the highest level of value added for the mining of hard coal, accounting for more than half of the EU-27’s value added in hard coal mining. Bulgaria had the highest level of value added for lignite mining (followed by Poland), although data are not available for several Member States, among which some are certainly larger as Bulgaria’s share of the EU-27 total was just 8.7 %. Unsurprisingly, Poland was by far the most specialised Member State (in value added terms) in the mining of coal and lignite. Among all of the NACE divisions within the non-financial business economy, this sector was the one where Poland and the Czech Republic were most specialised in terms of the sector’s contribution to non-financial business economy value added compared with the equivalent contribution for the EU-27 as a whole; on the same basis this was also the second most specialised sector for Bulgaria.
Size class analysis
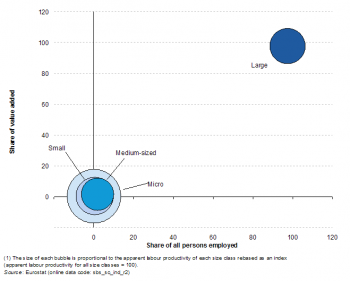
The enterprise size structure of the EU-27’s mining of coal and lignite sector is almost completely dominated by large enterprises (employing 250 or more persons) — 97.6 % of the value added and 97.5 % of the workforce were concentrated within large enterprises. The value added share of large enterprises within the mining of coal and lignite sector was the highest share in 2010 among all of the non-financial business economy NACE divisions. For comparison, the non-financial business economy average for large enterprise was a two fifths (42.3 %) share of value added.
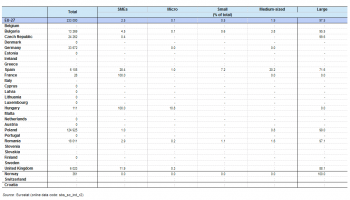
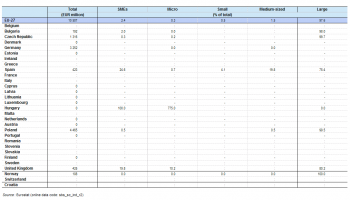
Large enterprises provided more than three quarters of the mining of coal and lignite sector’s value added in all five of the EU Member States for which data are complete for 2010 and where there was some activity in this sector, namely the Czech Republic, Poland, Bulgaria, the United Kingdom and Spain — see Table 6a. Two Member States for which size class value added data are not available had a significant coal and lignite mining sector and these were Germany and Romania. In employment terms Romania’s sector was also dominated by large enterprises (97.1 %) whereas for Germany the only information available suggests that this sector was split between small enterprises (with 10 to 49 persons employed) and large enterprises. One special case was the very small Hungarian mining of coal and lignite sector where negative sectoral value added makes interpretation of the size class data problematic, other than to note that there were no large enterprises; from an analysis of the employment data it can be seen that in Hungary this sector employed just 111 persons.
Data sources and availability
The analysis presented in this article is based on the main dataset for structural business statistics (SBS) and size class data, all of which are published annually.
The main series provides information for each EU Member State as well as a number of non-member countries at a detailed level according to the activity classification NACE. Data are available for a wide range of variables.
In structural business statistics, size classes are generally defined by the number of persons employed. A limited set of the standard structural business statistics variables (for example, the number of enterprises, turnover, persons employed and value added) are analysed by size class, mostly down to the three-digit (group) level of NACE. The main size classes used in this article for presenting the results are:
- small and medium-sized enterprises (SMEs): with 1 to 249 persons employed, further divided into;
- micro enterprises: with less than 10 persons employed;
- small enterprises: with 10 to 49 persons employed;
- medium-sized enterprises: with 50 to 249 persons employed;
- large enterprises: with 250 or more persons employed.
Context
This article presents an overview of statistics for the mining of coal and lignite sector in the EU, covering NACE Rev. 2 Division 05. The extraction of solid mineral fuels such as coal and lignite includes underground or open-cast mining and includes operations (for example, grading, cleaning, compressing and other steps necessary for transportation and so on) leading to a marketable product.
This NACE division is composed of two groups:
- the mining of hard coal (Group 05.1);
- the mining of lignite also known as brown coal (Group 05.2).
This article does not cover peat-digging (which is classified to Division 08, other mining and quarrying), coking or the manufacture of briquettes (Division 19, the manufacture of coke and refined petroleum products) or services incidental to coal or lignite mining (Division 09, mining support services).
See also
- Mining and quarrying
- Other analyses of the business economy by NACE Rev. 2 sector
- Structural business statistics introduced
Further Eurostat information
Publications
- European business - facts and figures (online publication)
- Key figures on European Business – with a special feature section on SMEs – 2011 edition
Main tables
Database
- SBS - industry and construction (sbs_ind_co)
- Annual detailed enterprise statistics - industry and construction (sbs_na_ind)
- Annual detailed enterprise statistics for industry (NACE Rev. 2 B-E) (sbs_na_ind_r2)
- SMEs - Annual enterprise statistics by size class - industry and construction (sbs_sc_ind)
- Industry by employment size class (NACE Rev. 2 B-E) (sbs_sc_ind_r2)
- Annual detailed enterprise statistics - industry and construction (sbs_na_ind)
- SBS - regional data - all activities (sbs_r)
- SBS data by NUTS 2 regions and NACE Rev. 2, from 2008 onwards (sbs_r_nuts06_r2)
Dedicated section
Source data for tables and figures (MS Excel)
Other information
- Decision 1578/2007/EC of 11 December 2007 on the Community Statistical Programme 2008 to 2012
- Regulation 295/2008 of 11 March 2008 concerning structural business statistics