Archive:Material deprivation and low work intensity statistics
This article has been archived. Updated information id available here: Living conditions in Europe - material deprivation and economic strain.
This article describes the non-monetary components of the social inclusion headline indicator people 'at risk of poverty or exclusion' (AROPE), set out in the Europe 2020 Strategy: ‘people living in households with very low work intensity’ and ‘people severely materially deprived’. The monitoring of progress towards the EU2020 headline target, namely to reduce substantially the number of people at risk of poverty or social exclusion, will be based on past trends of the headline indicator number of people 'at risk of poverty or exclusion' (AROPE), for the total population and for the main groups at risk at European Union (EU) level. The non-monetary components of the headline indicator, which are material deprivation and work intensity, are primarily examined. These measures of poverty and social exclusion are analysed together with the monetary component (at-risk-of-poverty rate) in order to acquire a deeper understanding of poverty.
(%)
Source: Eurostat (ilc_sip8)
(%)
Source: Eurostat (ilc_mdes04)
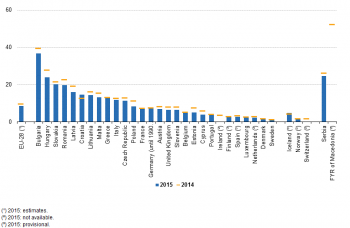
(%)
Source: Eurostat (ilc_mdes03)
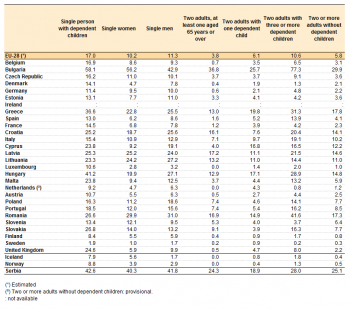
(% of specified population)
Source: Eurostat (ilc_mddd13)
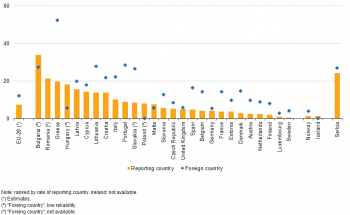
(%)
Source: Eurostat (ilc_mddd15)
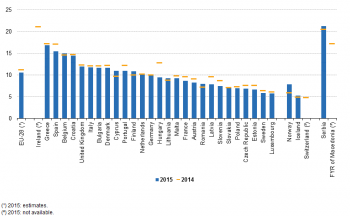
(%)
Source: Eurostat (ilc_lvhl11)
(%)
Source: Eurostat (ilc_lvhl13)
(million)
Source: Eurostat (ilc_pees01)
Main statistical findings
Material deprivation and severe material deprivation
Alongside income-related measures of poverty, a broader perspective of social inclusion can be obtained by studying other measures, for example, those relating to material deprivation. An analysis of material deprivation provides a more absolute rather than a relative analysis, as used for income poverty. The definition of material deprivation is based on the inability to afford a selection of items that are considered to be necessary or desirable, namely:
- having arrears on mortgage or rent payments, utility bills, hire purchase instalments or other loan payments;
- not being able to afford one week’s annual holiday away from home;
- not being able to afford a meal with meat, chicken, fish (or vegetarian equivalent) every second day;
- not being able to face unexpected financial expenses;
- not being able to buy a telephone (including mobile phone);
- not being able to buy a colour television;
- not being able to buy a washing machine;
- not being able to buy a car;
- not being able to afford heating to keep the house warm.
The material deprivation rate is defined as the proportion of persons who cannot afford to pay for at least three out of the nine items specified above, while those who are unable to afford four or more items are considered to be severely materially deprived.
Around one in six people in the EU was materially deprived
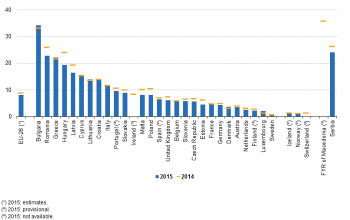
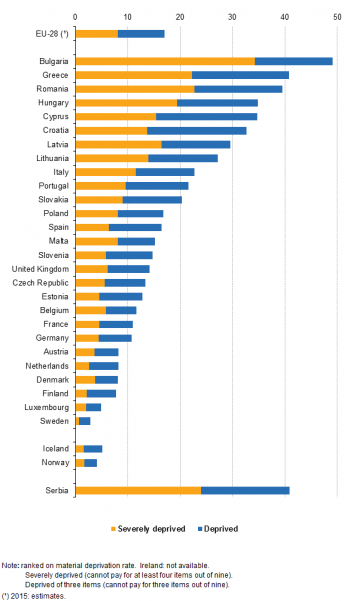
Around one out of six (17.0 %) members of the EU-28 population was materially deprived in 2015, with close to half of these (8.1 % of the total population) being considered as experiencing severe material deprivation (see Figure 1).
The proportion of people that were materially deprived was highest in Bulgaria (49.1 %), Greece (40.8 %), Romania (39.5 %) and Hungary (34.8 %) among the EU Member States, with more than half of the materially-deprived persons in each of these countries experiencing severe material deprivation. Similarly, in Latvia, Lithuania, Italy and Malta, more than half of those considered as materially deprived experienced severe material deprivation. Less than one in ten people in Luxembourg, the Netherlands, the Nordic Member States and Austria were materially deprived. The same was the case in Iceland and Norway.
Focusing upon severe material deprivation (see Figure 2), more than 20 % of the population was found to be severely materially deprived in Bulgaria (34.2 %), Romania (22.7 %), and Greece (22.2 %). On the other hand, only 3.7 % or less in the Nordic countries, Austria (3.6 %), the Netherlands (2.6 %) and Luxembourg (2.0 %).
Overall, at EU-28 level and in the euro area, the severe material deprivation rate decreased by 0.8 percentage points (pp) between 2014 and 2015. The largest increases among the EU countries were observed in Bulgaria (+ 1.1 pp), Greece (+ 0.7 pp) and Luxembourg (+ 0.6 pp), while the largest decreases were in Hungary (– 4.6 pp), Romania (– 3.2 pp) and Latvia (– 2.8 pp).
Factors of material deprivation rate
Inability to afford unexpected financial expenses, followed by inability to afford a meal with meat, chicken, fish or a vegetarian equivalent every second day decreased between 2014 and 2015
Among the factors (‘items’) that are considered in determining the material deprivation rate, ‘facing unexpected expenses’ and ‘inability to afford a meal with meat, chicken, fish (or a vegetarian equivalent) every second day’ showed both a decrease at EU-28 level between 2014 and 2015.
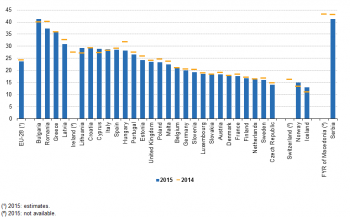
In 2015, 37.3 % of the EU population reported difficulties in facing unexpected expenses, which represents a decrease of 1.6 pp compared with 2014 (see Figure 3).
Compared with 2014, the percentage of people reporting difficulties in facing unexpected expenses increased by more than 2.5 pp in Bulgaria (3.8 pp) and also in Iceland (2.8 pp) and at the same time it fell by 4.8 pp in the Czech Republic, 6.3 pp in Poland and 7.0 pp in Latvia.
There is a considerable variation among the EU Member States for both items. The percentage of people reporting difficulties to face unexpected expenses in 2015 was 23.0 % or less in Luxembourg, the Netherlands[1] , Austria, Malta and Sweden as well as in Norway; while it was above 60.0 % in Latvia, Cyprus and Hungary. Regarding the inability to afford a meal with meat, chicken or fish (or vegetarian equivalent) every second day, in 2015, 8.5 % of the EU population reported that they could not afford this item. This represents a decrease of 1.0 pp compared with 2014 (see Figure 4). Changes in the deprivation item are in some cases correlated with the decrease in income in the lowest quintiles.
The percentage of people reporting an inability to afford a meal with meat, chicken or fish (or vegetarian equivalent) ranged from 2.9 % or less in Finland, Spain, Luxembourg, the Netherlands, Denmark, Sweden and Norway[2] , to 20.1 % in Slovakia, 23.8 % in Hungary, and 36.8 % in Bulgaria. Compared with 2014, the percentage of people reporting an inability to afford a meal with meat, chicken or fish (or vegetarian equivalent) every second day increased by 1.8 pp in Croatia, 0.2 pp in Finland[3] and 0.1 pp in Sweden. At the same time it fell by more than 2 pp in Hungary (– 3.9 pp), Latvia (– 3.1 pp), Poland, Romania (both – 3.0 pp), Bulgaria (– 2.7 pp), Estonia (– 2.5 pp), and Malta (– 2.4 pp).
Severe material deprivation by household type
At EU level, single-person households with dependent children are classified as being the most severely materially-deprived
The rates of severe material deprivation are not uniformly distributed between the different household types. Table 1 shows how the rates of severe deprivation vary between different household types. Overall at EU-28 level, the most severely materially-deprived persons lived in single-person households with dependent children (17.0 %) followed by single-male households (11.3 %) and households with two adults and three or more dependent children (10.6 %). On the other hand, persons living in households with elderly people (two adults, at least one aged 65 or over) were overall the least affected (3.8 %), most probably due to the accumulation of durable goods during their working lives and more opportunities to save money. This was more or less the picture in most EU Member States, although there were some exceptions.
In Bulgaria, Germany, Latvia, Lithuania, Slovenia and Sweden, the percentage of the population that was found to be severely materially-deprived in single-person households was similar to the percentage of those found in single-person households with dependent children while in Spain, Sweden, Poland and Portugal the percentage of severely materially-deprived persons living in single-person households with dependent children was closer to the percentage of those living in households with two adults and three or more dependent children.
In 20 EU Member States single-parent households were more affected by severe material deprivation than any other type of households. In Bulgaria, Hungary and Greece more than one third of this household type was severely material deprived. Households with two adults and one dependent child were less affected by severe material deprivation than the households with elderly people in Bulgaria, Croatia, Latvia, Slovakia, Poland, Lithuania, Portugal, Romania and Slovenia. In Bulgaria, Romania, Italy and Spain the most affected households were those with two adults with three or more dependent children, while in Lithuania, Croatia and Poland the most affected were single males. Single female households had higher percentages of severe material deprivation than male households only in Bulgaria, Slovenia, Latvia, the Czech Republic and Slovakia as well as in Iceland and Norway.
Severe material deprivation rate by citizenship
Foreign citizens mostly affected by severe material deprivation
Severe material deprivation affects foreign citizens to a greater extent than the citizens of the declaring country (see Figure 5). The situation is present in the majority of EU Member States. The only exceptions are Hungary (– 12.4 pp), Poland (– 8.0 pp), Bulgaria (– 6.5 pp), Malta (– 2.0 pp), and Iceland (– 1.2 pp) where deprivation rates for foreign citizens were reported to be lower than the respective rates for the citizens of the declaring country[4].
On average, at EU-28 level, severe deprivation rates were 4.8 pp higher in the foreign citizens’ population (12.2 % compared with 7.4 % for citizens of the reporting country). This rate has actually decreased between 2014 and 2015 for both foreign citizens (being estimated at 13.2 % in 2014 and 12.2 % in 2015) and citizens of the declaring country (with an estimate of 8.2 % in 2014 and 7.4 % in 2015). The largest three differences between foreigners and citizens of the declaring country in 2015 were reported by Greece (32.7 pp), Portugal (19.6 pp) and Slovakia[5] (18.1 pp).
Low work intensity
People living in households with very low work intensity are defined as people of all ages (0–59) living in households where the members of working age worked less than 20 % of their total potential during the previous 12 months.
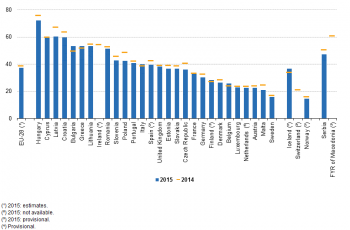
Following this definition, the proportion of people living in households with very low work intensity (see Figure 6) decreased in 2015 when compared with 2014 and accounted for about 10.5 % of the population. However, this rate varied between EU Member States. On the one hand, less than 7.0 % of the target population was living in households with very low work intensity in Poland, the Czech Republic, Estonia, Sweden and Luxembourg. In Iceland rates were also relatively low (5.2 %). On the other hand, the indicator exceeded 14.0 % in Croatia, Belgium, Spain and Greece[6].
Although the indicator decreased by 0.7 pp at EU-28 level from 2014 to 2015, increases were observed in several countries: 1.2 pp in Cyprus, 0.8 pp in Finland, 0.7 pp in Romania, 0.4 pp in Lithuania and 0.3 pp in Belgium. Norway also reported a relatively large increase (1.9 pp); Iceland (0.3 pp) and Serbia (0.7 pp) also presented a higher rate in 2015 compared to 2014.
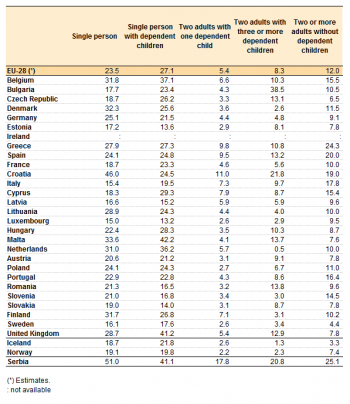
Very low work intensity (see Table 2), for people aged less than 60, was most common in single-person households with dependent children and in single-person households (27.1 % and 23.5 % respectively at EU level) while it was the least common in households of two adults with one dependent child and households of two adults with three or more dependent children (5.4 % and 8.3 % children respectively at EU level). This was the overall pattern in the majority of countries, although some exceptions occurred: in Italy the second largest share of population aged less than 60 living in low intensity households belonged to households with two or more adults without dependent children and in Bulgaria the highest share (38.5 %) was in households having two adults with three or more dependent children.
Other exceptions to this pattern were recorded in Denmark and Croatia where the rates of single-person households were greater by more than 5.0 pp than those of single-person households with dependent children. In Cyprus, Malta and the United Kingdom, on the other hand, the proportion of persons aged less than 60 living in households with very low work intensity rates for single-person households with dependent children were at least 7.5 pp higher than the rates for single-person households. Furthermore, Bulgaria was the only country where this indicator was the highest (38.5 %, as mentioned above) among households of two adults with three or more dependent children rather than among single-person households with or without dependent children.
At risk of poverty or social exclusion
‘Severe material deprivation’ and ‘very low work intensity’ are two out of the three components of the Europe 2020 Poverty and Social exclusion indicator.
The third component is ‘at-risk-of-poverty’, and represents the monetary element of poverty and social exclusion. In 2015, there were:
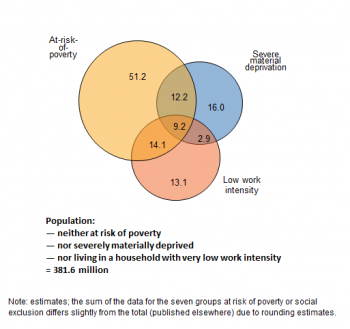
- 51.2 million people in the EU-28 living in households that faced income poverty (but neither severe material deprivation, nor very low work intensity),
- 16.0 million people experiencing severe material deprivation (but neither of the other two risks),
- 13.1 million people living in households with very low work intensity (but facing neither of the other two risks).
People are considered to be at risk of poverty or social exclusion if they face at least one of the three risks. 38.4 million of those at risk of poverty or social exclusion within the EU-28 faced a combination of two or even all three of these risks: 29.2 million people lived in households facing two of these risks and further 9.2 million people in households where all three risks were present (see Figure 7).”In 2015, 381.6 million people faced none of the above-mentioned risks, which was a 1.1 % increase compared with the value in 2014.
The evolution of poverty and social exclusion in 2014–15
In 2015, there were 118.8 million people in the EU-28, equivalent to 23.7 % of the entire population, who lived in households facing poverty or social exclusion (see Figures 7 and 8). This is a decrease of 0.7 pp (equivalent to approximately 3.1 million people) compared with 2014.
The latest changes between 2014 and 2015 show that the proportion of the population at risk of poverty or social exclusion fell by more than 1 pp in Slovenia, Poland, Malta, Estonia, Latvia, by 2.9 pp in Romania and by 3.6 pp in Hungary. The largest increases occurred in Bulgaria (+ 1.2 pp), Cyprus (+ 1.5 pp) and Lithuania (+ 2.0 pp).
In absolute terms, the number of persons considered to be at risk of poverty or social exclusion in the six Member States with the highest decreases between 2014 and 2015 (Romania: – 610 000, Poland: – 577 000, France: – 493 000, Germany: – 426 000, Hungary: – 361 000 and the United Kingdom: – 244 000), outweighed by far the five increases that were registered in Italy (+ 323 000), Bulgaria (+ 72 000), Lithuania (+ 52 000 ) and to a lesser extent, Cyprus (+10 000) and Slovakia (+ 3 000).
Data sources and availability
The data used in this section are primarily derived from microdata from EU statistics on income and living conditions (EU-SILC). The reference population is private households and their current members residing in the territory of the Member State at the time of data collection; persons living in collective households and in institutions are generally excluded from the target population. The EU-28 aggregate is a population-weighted average of individual national figures.
Context
At the European Council held on 17 June 2010, the Member States’ Heads of State and Government endorsed a new EU strategy for jobs and smart, sustainable and inclusive growth, known as the Europe 2020 strategy. The strategy will help Europe to recover from the crisis and come out stronger, both internally and at international level, by boosting competitiveness, productivity, growth potential, social cohesion and economic convergence.
The poverty issue is a milestone in the Europe 2020 strategy. One of the headline targets is ‘Reduction of poverty by aiming to lift at least 20 million people out of the risk of poverty or social exclusion’ and ‘European platform against poverty’ is one of the seven flagship initiatives. The eradication of poverty also remains a major challenge of sustainable development, and the social dimension is one of the pillars of the EU’s Sustainable Development Strategy (EU SDS).
This article describes two of the three components of the social inclusion headline indicator ‘People at risk of poverty or social exclusion’ set out in the Europe 2020 Strategy. It also provides an overview of the composition of the headline indicators.
See also
- People at risk of poverty or social exclusion
- Poverty and social exclusion — ‘Statistics explained’ articles
- Employment statistics
- Income poverty statistics
Further Eurostat information
Publication
- Europe 2020 Strategy — towards a smarter, greener and more inclusive EU economy?’ (March 2015) — Statistical books
- Quality of life — Facts and view — Statistical books
- Living conditions in Europe — 2014 Edition — Statistical books
- Europe in figures — Eurostat yearbook 2012: Living conditions and social protection
- 23 % of EU citizens were at risk of poverty or social exclusion in 2010 — Statistics in Focus 9/2012
- Combating poverty and social exclusion. A statistical portrait of the European Union 2010 — Statistical books
- Children were the age group at the highest risk of poverty or social exclusion in 2011 — Statistics in Focus 4/2013
- European social statistics (2013) — Statistical books
- Income and living conditions in Europe (2010) — Statistical books
- Living conditions in Europe (2002–2005) — Statistical pocketbooks
- Living standards falling in most Member States — Statistics in Focus 8/2013
- The Social Situation in the European Union 2009 — Statistical books
Main tables
- People at risk of poverty or social exclusion (Europe 2020 strategy) (t_ilc_pe)
- Living conditions (t_ilc_lv)
- Material deprivation (t_ilc_md)
Database
- People at risk of poverty or social exclusion (Europe 2020 strategy) (ilc_pe)
- Main indicator - Europe 2020 target on poverty and social exclusion (ilc_peps)
- Intersections between sub-populations of Europe 2020 indicators on poverty and social exclusion (ilc_pees)
- Living conditions (ilc_lv)
- Health and labour conditions (ilc_lvhl)
- Material deprivation (ilc_md)
- Material deprivation by dimension (ilc_mddd)
- Economic strain (ilc_mdes)
- People at risk of poverty or social exclusion (Europe 2020 strategy) (ilc_pe)
Dedicated section
Methodology / Metadata
- Income and living conditions (ESMS metadata file — ilc_esms)
- What can be learned from deprivation indicators in Europe?
- Measuring material deprivation in the EU
- Sponsorship group on measuring progress, well-being and sustainable development, Report of the Task Force, 2011
Source data for tables and figures (MS Excel)
Other information
- Regulation (EC) No 1177/2003 of 16 June 2003 concerning Community statistics on income and living conditions (EU-SILC)
- Regulation (EC) No 1553/2005 of 7 September 2005 amending Regulation 1177/2003 concerning Community statistics on income and living conditions (EU-SILC)
- Regulation (EC) No 1791/2006 of 20 November 2006 adapting certain Regulations and Decisions in the fields of ... statistics, ..., by reason of the accession of Bulgaria and Romania
External links
- Comparison of UK and EU at-risk-of-poverty rates 2005–2010
- Employment and Social Developments in Europe (2012)
- OECD statistics on measuring economic performance and social progress
- The social dimension of the EUROPE 2020 strategy — A report of the social protection committee (2011)
- European Commission — Directorate General for Employment, Social Affairs and Inclusion
- ↑ Provisional data in the case of the Netherlands.
- ↑ Provisional data in the case of Finland, Spain, the Netherlands, and Norway.
- ↑ Provisional data in the case of Finland.
- ↑ The low reliability of the data for foreign country citizens in Bulgaria, Hungary and Poland must be taken into account.
- ↑ The low reliability of the data for foreign country citizens in Slovakia must be taken into account.
- ↑ No 2015 data available for Ireland at the time of publication.
