Archive:Manufacture of wood and wood products statistics - NACE Rev. 2
This Statistics Explained article is outdated and has been archived - for recent articles on structural business statistics see here.
- Data from April 2013. Most recent data: Further Eurostat information, Main tables and Database.
This article presents an overview of statistics for wood and wood products manufacturing in the European Union (EU), as covered by NACE Rev. 2 Division 16.
(% share of sectoral total) - Source: Eurostat (sbs_na_ind_r2)



(% share of sectoral total) - Source: Eurostat (sbs_sc_ind_r2)
Main statistical findings
Structural profile
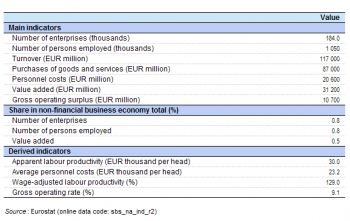
The wood and wood products manufacturing (Division 16) sector comprised 184 thousand enterprises in the EU-27 in 2010. Together they employed 1.05 million persons, equivalent to 0.8 % of the total number of persons employed in the non-financial business economy (Sections B to J and L to N and Division 95) and 3.5 % of the manufacturing (Section C) workforce. They generated EUR 31.2 billion of value added which was 0.5 % of the non-financial business economy total and 2.0 % of the manufacturing total.
The apparent labour productivity of the EU-27’s wood and wood products manufacturing sector in 2010 was EUR 30.0 thousand per person employed, below the non-financial business economy average of EUR 44.8 thousand per person employed and the manufacturing average of EUR 52.8 thousand per person employed. This was one of the lowest levels of apparent labour productivity among the manufacturing NACE divisions, higher only than the manufacture of wearing apparel (Division 14), the manufacture of leather and related products (Division 15), and furniture manufacturing (Division 31).
Average personnel costs within the EU-27’s wood and wood products manufacturing sector were also relatively low, at EUR 23.2 thousand per employee, when compared with the non-financial business economy (EUR 30.9 thousand per employee) and manufacturing (EUR 35.8 thousand per employee) averages. The EU-27’s wood and wood products manufacturing sector recorded the third lowest level of average personnel costs among the manufacturing NACE divisions, only higher than for the manufacture of wearing apparel, and the manufacture of leather and related products.
The wage-adjusted labour productivity ratio combines the two previous indicators and shows the extent to which value added per person employed covers average personnel costs per employee. Due to low productivity and only slightly inferior average personnel costs the EU-27’s wood and wood products manufacturing sector had a relatively low wage-adjusted labour productivity ratio in 2010, at 129.0 % — the non-financial business economy average was 144.8 % and the manufacturing average was 148.0 %.
The gross operating rate (the relation between the gross operating surplus and turnover) is one measure of profitability; it stood at 9.1 % for the EU-27’s wood and wood products manufacturing sector in 2010, lower than the non-financial business economy average (10.1 %) but marginally higher than the manufacturing average (9.0 %).
Sectoral analysis
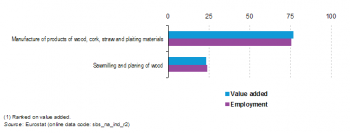
The wood and wood products manufacturing sector includes the first processing stages of sawmilling and planing of wood (Group 16.1) and the downstream activity of the manufacture of products of wood, cork, straw and plaiting materials (Group 16.2, hereafter referred to as wood products manufacturing). Within the EU-27, the larger of these two activities was wood products manufacturing, which accounted for just over three quarters of the sectoral workforce (75.5 %) and sectoral value added (76.9 %) in 2010.
Both subsectors recorded relatively low apparent labour productivity and average personnel costs in the EU-27 in 2010, in particular the sawmilling and planing of wood. The apparent labour productivity ratio for the sawmilling and planing of wood was EUR 29.0 thousand per person employed and average personnel costs were EUR 19.7 thousand per employee, respectively the seventh and fourth lowest levels for these ratios among the manufacturing NACE groups for which data are available (approximately 90 groups). For wood products manufacturing these ratios were higher, EUR 30.1 thousand of value added per person employed and EUR 24.3 thousand of personnel costs per employee — nevertheless, both of these values were still well below manufacturing averages.
The particularly low average personnel costs for the EU-27’s sawmilling and planing of wood subsector helped to lift the wage-adjusted labour productivity ratio for this activity to 147.0 % in 2010, ahead of the 124.0 % recorded for wood products manufacturing; nevertheless, both ratios remained below the EU-27’s manufacturing average (148.0 %). By contrast, the EU-27 gross operating rate for these two subsectors was equal to or slightly higher than the manufacturing average (9.0 %) in 2010, with a rate of 9.4 % for the sawmilling and planing of wood and a rate of 9.0 % for wood products manufacturing.
Country analysis
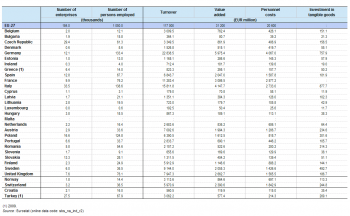
Germany recorded the highest share (19.2 %) of EU-27 value added within the wood and wood products manufacturing sector in 2010; this was less than the German share of EU-27 value added within the whole of the non-financial business economy (21.9 %) and was considerably lower than the German share of EU-27 manufacturing (28.7 %). Italy (13.3 %) was the only other Member State with a double-digit share of EU-27 sectoral value added in 2010, although the share in France (9.9 %) only failed to reach this by a very small margin. Specialisation within the wood and wood products manufacturing sector is often closely linked to an abundance of raw materials, in other words, those Member States with a high degree of forest cover are often among the most specialised countries. Austria (6.4 %), Latvia (1.2 %) and Estonia (0.9 %) recorded their highest shares of EU-27 value added in the wood and wood products manufacturing sector among all of the non-financial business economy NACE divisions (with data available) in 2010; on the same basis this was also the second most specialised sector for Sweden and the third for Lithuania, Finland and Slovakia.
The German value added share was lower for the sawmilling and planing of wood subsector (15.3 %) — although it still had the highest level of value added among the Member States, whereas its share of the EU-27’s wood products manufacturing subsector was 20.2 %. After Germany, the largest Member States in the sawmilling and planing of wood subsector were Sweden (13.0 % of EU-27 value added) and France (12.2 %), followed by Italy and Austria (both with just under 10.0 %). For wood products manufacturing, Italy was the only other Member State (besides Germany) to report a share of EU-27 value added in excess of 10 %, while the United Kingdom and France were just below this level. Among the non-member countries, the wood products manufacturing subsector was particularly large in Switzerland, where value added was equivalent to 8.8 % of the EU-27 total.
With the exception of Sweden, the EU Member States with the highest levels of value added in the wood and wood products manufacturing sector were generally not particularly specialised (in value added terms). In 2010, the most specialised Member States, by far, were Latvia and Estonia, followed by Lithuania, Finland, Austria and Slovakia. The least specialised Member States in the wood and wood products manufacturing sector were Ireland, Luxembourg, the Netherlands and the United Kingdom.
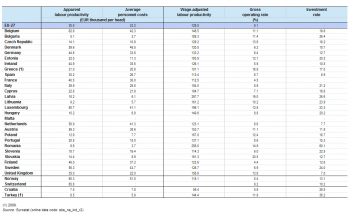
Several of the EU Member States that were relatively specialised in the wood and wood products manufacturing sector recorded wage-adjusted labour productivity ratios that were well above the EU-27 average, for example, Latvia was the most specialised Member State and had a wage-adjusted labour productivity ratio of 297.7 %, which was the highest among the Member States. All of the Member States had wage-adjusted labour productivity ratios for the wood and wood products manufacturing sector above 100 %: the lowest ratios were 101.1 % in Greece (2009 data) and 104.0 % in Italy.
Size class analysis
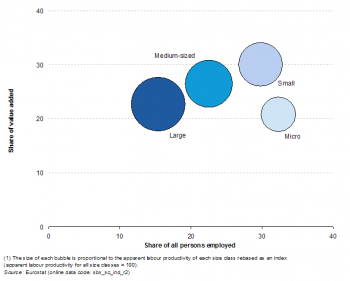
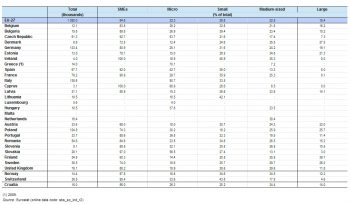
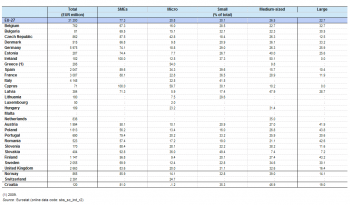
The EU-27’s wood and wood products manufacturing sector was one of eight manufacturing NACE divisions where small and medium-sized enterprises (SMEs, employing fewer than 250 persons) employed more than three quarters of the workforce in 2010. SMEs employed 84.6 % of the wood and wood products manufacturing sector’s workforce and generated 77.3 % of total value added. This was the second highest SME share of employment and value added in 2010 for any of the manufacturing NACE divisions. Due to the lower sectoral share in value added terms, SMEs had a relatively low level of apparent labour productivity: EUR 27.2 thousand per person employed compared with an average for large enterprises (employing 250 or more persons) of EUR 46.0 thousand per person employed.
The contribution of small enterprises (employing 10 to 49 persons) to employment within the EU-27’s wood and wood products manufacturing sector was 29.8 % in 2010, which was the fourth highest such share among all manufacturing NACE divisions and the sixth highest among all non-financial business economy NACE divisions. The contribution of small enterprises to value added within the wood and wood products manufacturing sector was marginally higher, reaching 30.1 % in 2010, the third highest share among manufacturing NACE divisions and the seventh highest among all non-financial business economy NACE divisions. The employment share of large enterprises in the wood and wood products manufacturing sector was lower than the equivalent share for all other size classes. Furthermore, the value added shares of small and medium-sized enterprises were both higher than the share of large enterprises in the wood and wood products manufacturing sector: such a situation occurred in only five other manufacturing NACE divisions in 2010. Although the micro enterprises’ (employing fewer than 10 persons) 20.8 % share of in the wood and wood products manufacturing sector’s value added was lower than the share for large enterprises, this was the highest share in 2010 for micro enterprises among any of the manufacturing NACE divisions.
In 2010, SMEs accounted for more than half of the value added generated in the wood and word products manufacturing sector in each of the EU Member States for which data are available. Shares in excess of four fifths were recorded for eight Member States (and also in Croatia), with Ireland and Cyprus reporting that there were no large enterprises in their wood and word products manufacturing sectors. In Cyprus and Greece (2009 data), micro enterprises contributed more than half of sectoral value added, while medium-sized enterprises provided more than half of sectoral value added in Ireland.
Data sources and availability
The analysis presented in this article is based on the main dataset for structural business statistics (SBS) and size class data, all of which are published annually.
The main series provides information for each EU Member State as well as a number of non-member countries at a detailed level according to the activity classification NACE. Data are available for a wide range of variables.
In structural business statistics, size classes are generally defined by the number of persons employed. A limited set of the standard structural business statistics variables (for example, the number of enterprises, turnover, persons employed and value added) are analysed by size class, mostly down to the three-digit (group) level of NACE. The main size classes used in this article for presenting the results are:
- small and medium-sized enterprises (SMEs): with 1 to 249 persons employed, further divided into;
- micro enterprises: with less than 10 persons employed;
- small enterprises: with 10 to 49 persons employed;
- medium-sized enterprises: with 50 to 249 persons employed;
- large enterprises: with 250 or more persons employed.
Context
This article presents an overview of statistics for the wood and wood products manufacturing sector in the EU, as covered by NACE Rev. 2 Division 16. The production includes processing logs that are cut into bolts, or lumber that may then be cut further, or shaped by lathes or other shaping tools and assembled into finished products.
Classified under the sawmilling and planing of wood are the drying and machining of wood, slicing, peeling or chipping logs, the manufacture of wooden railway sleepers and unassembled wooden flooring, the impregnation or chemical treatment of wood, as well as the manufacture of wood wool, wood flour, chips or particles.
The manufacture of products of wood, cork, straw and plaiting materials includes the production of veneer sheets and wood-based panels, assembled parquet floors, other builders’ carpentry and joinery (such as roof frame elements, doors, windows, shutters and their frames, stairs, railings and prefabricated buildings), wooden containers, and other wooden products such as handles, clothes hangers, household utensils and kitchenware, as well as basket-ware and the production of fire logs and pellets.
This NACE division is composed of two groups:
- the sawmilling and planing of wood (Group 16.1);
- the manufacture of products of wood, cork, straw and plaiting materials (Group 16.2).
This division does not include logging and the production of wood in the rough (which is covered by forestry and logging, part of Division 02), the manufacture of furniture whether fitted or free-standing (Division 31), the manufacture of wooden toys, brushes and brooms or coffins (part of other manufacturing, Division 32) or the installation of wooden fittings and the like (part of specialised construction activities, Division 43).
See also
- Manufacturing
- Other analyses of the business economy by NACE Rev. 2 sector
- Structural business statistics introduced
Further Eurostat information
Publications
- European business - facts and figures (online publication)
- Key figures on European Business – with a special feature section on SMEs – 2011 edition
Main tables
Database
- SBS - industry and construction (sbs_ind_co)
- Annual detailed enterprise statistics - industry and construction (sbs_na_ind)
- Annual detailed enterprise statistics for industry (NACE Rev. 2 B-E) (sbs_na_ind_r2)
- SMEs - Annual enterprise statistics by size class - industry and construction (sbs_sc_ind)
- Industry by employment size class (NACE Rev. 2 B-E) (sbs_sc_ind_r2)
- Annual detailed enterprise statistics - industry and construction (sbs_na_ind)
- SBS - regional data - all activities (sbs_r)
- SBS data by NUTS 2 regions and NACE Rev. 2, from 2008 onwards (sbs_r_nuts06_r2)
Dedicated section
Source data for tables and figures (MS Excel)
Other information
- Decision 1578/2007/EC of 11 December 2007 on the Community Statistical Programme 2008 to 2012
- Regulation 295/2008 of 11 March 2008 concerning structural business statistics