This Statistics Explained article is outdated and has been archived - for recent articles on structural business statistics see here.
- Data from April 2013. Most recent data: Further Eurostat information, Main tables and Database.
This article presents an overview of statistics for paper and paper products manufacturing in the European Union (EU), as covered by NACE Rev. 2 Division 17.


(% share of sectoral total) - Source: Eurostat (sbs_na_ind_r2)


(% share of sectoral total) - Source: Eurostat (sbs_sc_ind_r2)


Main statistical findings
Structural profile
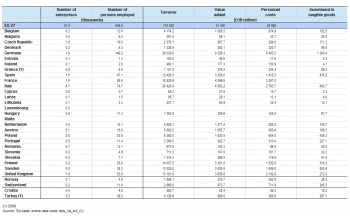
There were 21.0 thousand enterprises in the paper and paper products manufacturing (Division 17) sector in the EU-27 in 2010 which was around 0.1 % of the total for the whole of the non-financial business economy (Sections B to J and L to N and Division 95). Employment in the paper and paper products manufacturing sector totalled 645.8 thousand persons, equivalent to 0.5 % of all persons employed in the non-financial business economy and 2.2 % of the manufacturing (Section C) workforce. The EU-27’s paper and paper products manufacturing sector generated EUR 41.0 billion of value added which was 0.7 % of the non-financial business economy total and 2.6 % of the manufacturing total.
The wage-adjusted labour productivity ratio in the EU-27’s paper and paper products manufacturing sector in 2010 was 161.0 %, resulting from apparent labour productivity of EUR 63.9 thousand per person employed and average personnel costs of EUR 39.8 thousand per employee. For all three of these ratios the paper and paper products manufacturing sector recorded a higher value than the manufacturing and non-financial business economy averages.
By contrast, the gross operating rate for the EU-27’s paper and paper products manufacturing sector in 2010 was 9.7 %, which was situated between the non-financial business economy average (10.1 %) and the manufacturing average (9.0 %).
Sectoral analysis
The manufacture of articles of paper and paperboard (Group 17.2) was the largest subsector within the EU-27’s paper and paper products manufacturing sector in 2010 both in terms of employment (71.9 %) and value added (60.2 %) — see Figure 1. These differences fed into the apparent labour productivity ratios: the EUR 53.1 thousand per person employed for the articles of paper and paperboard manufacturing subsector was considerably lower than the EUR 91.6 thousand per person employed for the upstream pulp, paper and paperboard manufacturing (Group 17.1) subsector. Both of these levels were above the manufacturing average (EUR 52.8 thousand per person employed) and the apparent labour productivity recorded for the pulp, paper and paperboard manufacturing subsector was the eighth highest among all manufacturing NACE groups in 2010.
The high apparent labour productivity figure for the EU-27’s pulp, paper and paperboard manufacturing subsector was accompanied by high average personnel costs, EUR 50.0 thousand per employee in 2010. By contrast, average personnel costs per employee for the manufacture of articles of paper and paperboard were EUR 35.5 thousand, which was in line with the manufacturing average of EUR 35.8 thousand. The high apparent labour productivity and average personnel costs of the pulp, paper and paperboard manufacturing subsector combined for a wage-adjusted labour productivity ratio of 178.0 %, which was higher than the ratio for the articles of paper and paperboard manufacturing subsector (150.0 %). These wage-adjusted labour productivity ratios for the two paper and paper products manufacturing subsectors were above the non-financial business economy (144.8 %) and manufacturing (148.0 %) averages.
Both of the paper and paper manufacturing subsectors recorded the same gross operating rates in 2010 in the EU-27, 9.7 %. These rates were between the manufacturing and non-financial business economy averages (9.0 % and 10.1 % respectively).
Country analysis
The German share of EU-27 value added within the paper and paper products manufacturing sector in 2010 was 22.8 %, broadly in line with its share of the non-financial business economy (21.9 %) but considerably lower than the German share of EU-27 manufacturing (28.7 %). Nevertheless, the German share of EU-27 value added in the paper and paper products manufacturing sector remained much higher than the next highest shares recorded in Italy (11.1 %) and France (10.0 %). The 8.9 % share of EU-27 value added recorded for Sweden in this sector was the highest share for Sweden in any of the non-financial business economy NACE divisions (with data available) in 2010 and the same was true concerning the 8.0 % share recorded for Finland. The relative importance of paper and paper products manufacturing was highest in Finland where it accounted for 3.9 % of non-financial business economy value added and in Sweden where its share was 2.0 %. The least specialised Member States for the paper and paper products manufacturing sector were Ireland and Cyprus, where this sector contributed just 0.2 % of non-financial business economy value added in 2010, a situation that was also observed in Norway.
The high specialisation observed for the two Nordic Member States of Finland and Sweden was due to a particularly high specialisation in the upstream pulp, paper and paperboard manufacturing subsector, where together these two countries contributed 36.0 % of the EU-27’s value added and where they were the second and third largest Member States (in value added terms) behind Germany. Concerning the manufacture of articles of paper and paperboard, the most specialised Member States were Poland, Lithuania and Hungary.
In most EU Member States, the paper and paper products manufacturing sector had a higher wage-adjusted labour productivity ratio in 2010 than for the non-financial business economy as a whole, although notable exceptions included Germany, the United Kingdom and France, as well as Denmark, Cyprus, Latvia and the Netherlands. The wage-adjusted labour productivity ratio for the paper and paper products manufacturing sector was particularly high (relative to the national non-financial business economy average) in Portugal, Estonia, Slovakia and Poland. While none of the Member States recorded a wage-adjusted labour productivity ratio below 100 %, this was the case in Norway where average personnel costs per employee were EUR 3.1 thousand higher than the average value added per person employed.
Size class analysis
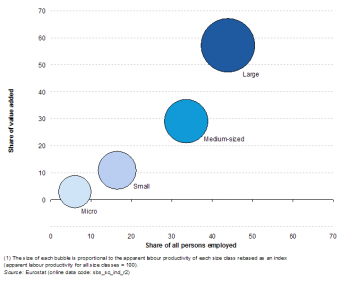
Large enterprises (employing 250 or more persons) generated 57.2 % of the EU-27’s paper and paper products manufacturing value added, which was above the non-financial business economy (42.3 %) and manufacturing (55.5 %) averages in 2010. In a similar vein, large enterprises employed 44.0 % of the paper and paper products manufacturing workforce, again above the shares of large enterprises within the whole of the non-financial business economy (32.5 %) and manufacturing (40.0 %). Medium-sized enterprises (employing 50 to 249 persons) were also relatively important for the paper and paper products manufacturing sector, contributing more value added (29.0 %) and employment (33.6 %) than was typical for manufacturing as a whole (22.6 % and 25.3 % respectively).
In Finland and Sweden more than four fifths of the value added from paper and paper products manufacturing stemmed from large enterprises. The lowest contributions from large enterprises, across the EU Member States, were recorded for Italy, Romania and Greece (2009 data), while there were no large enterprises in this sector in Cyprus or Latvia. The value added share of medium-sized enterprises exceeded 50 % of the total in Latvia, Greece (2009 data) and Ireland, as well as Croatia, and was also above two fifths of the total in the Netherlands, Lithuania and the United Kingdom. Although small enterprises provided only 10.8 % of the EU-27’s value added in the paper and paper products manufacturing sector in 2010, their share reached 55.1 % in Cyprus and was also more than twice the EU-27 average in Latvia, Italy and Romania.
Data sources and availability
The analysis presented in this article is based on the main dataset for structural business statistics (SBS) and size class data, all of which are published annually.
The main series provides information for each EU Member State as well as a number of non-member countries at a detailed level according to the activity classification NACE. Data are available for a wide range of variables.
In structural business statistics, size classes are generally defined by the number of persons employed. A limited set of the standard structural business statistics variables (for example, the number of enterprises, turnover, persons employed and value added) are analysed by size class, mostly down to the three-digit (group) level of NACE. The main size classes used in this article for presenting the results are:
- small and medium-sized enterprises (SMEs): with 1 to 249 persons employed, further divided into;
- micro enterprises: with less than 10 persons employed;
- small enterprises: with 10 to 49 persons employed;
- medium-sized enterprises: with 50 to 249 persons employed;
- large enterprises: with 250 or more persons employed.
Context
This article presents an overview of statistics for the paper and paper products manufacturing sector in the EU, as covered by NACE Rev. 2 Division 17. This division includes the manufacture of pulp, paper and converted paper products. These products form a series of vertically connected processes and more than one activity is often carried out in a continuous process. The manufacture of pulp involves separating the cellulose fibres from other matter in wood, or dissolving and de-inking used paper, and mixing in small amounts of reagents to reinforce the binding of the fibres. The manufacture of paper involves releasing pulp onto a moving wire mesh so as to form a continuous sheet.
The manufacture of pulp, paper and paperboard includes further processing of paper and paperboard by coating, covering and impregnation, the manufacture of creped or crinkled paper, the manufacture of handmade paper, newsprint and other printing or writing paper.
Converted paper products are made from paper and other materials. The paper articles may be printed (for example, wallpaper, gift wrap and so on), as long as the printing of information is not the main purpose. Included are corrugated paper and paperboard and containers of paper and paperboard, household and sanitary goods, paper stationery, wallpaper and other products, such as labels, filter paper and moulded pulp packaging products (such as egg boxes).
This NACE division is composed of two groups:
- the manufacture of pulp, paper and paperboard (Group 17.1);
- the manufacture of articles of paper and paperboard (Group 17.2).
See also
- Manufacturing
- Other analyses of the business economy by NACE Rev. 2 sector
- Structural business statistics introduced
Further Eurostat information
Publications
- European business - facts and figures (online publication)
- Key figures on European Business – with a special feature section on SMEs – 2011 edition
Main tables
Database
- SBS - industry and construction (sbs_ind_co)
- Annual detailed enterprise statistics - industry and construction (sbs_na_ind)
- Annual detailed enterprise statistics for industry (NACE Rev. 2 B-E) (sbs_na_ind_r2)
- SMEs - Annual enterprise statistics by size class - industry and construction (sbs_sc_ind)
- Industry by employment size class (NACE Rev. 2 B-E) (sbs_sc_ind_r2)
- Annual detailed enterprise statistics - industry and construction (sbs_na_ind)
- SBS - regional data - all activities (sbs_r)
- SBS data by NUTS 2 regions and NACE Rev. 2 (from 2008 onwards) (sbs_r_nuts06_r2)
Dedicated section
Source data for tables and figures (MS Excel)
Other information
- Decision 1578/2007/EC of 11 December 2007 on the Community Statistical Programme 2008 to 2012
- Regulation 295/2008 of 11 March 2008 concerning structural business statistics
