Archive:Glass, ceramic, clay and cement production statistics - NACE Rev. 1.1
This Statistics Explained article is outdated and has been archived - for recent articles on structural business statistics see here.
- Data from January 2009. Most recent data: Further Eurostat information, Main tables and Database.
This article introduces a set of statistical articles which analyse the structure, development and characteristics of the economic activities in the non-metallic minerals sector in the European Union (EU). This sector covers NACE Rev 1.1 Division 26, and its activities consist of the following groups, which are dealt with in more detail in separate articles:
- the manufacture of glass (corresponding to NACE Group 26.1);
- the manufacture of ceramic and clay products (NACE Groups 26.2 to 26.4);
- the manufacture of cement and concrete (NACE Groups 26.5 and 26.6);
- the working of stone and miscellaneous non-metallic mineral products (NACE Groups 26.7 and 26.8).
Note that the quarrying of non-metallic mineral products is covered in the articles on Mining and quarrying statistics - NACE Rev. 1.1 and Non-energy mining and quarrying statistics - NACE Rev. 1.1.
Main statistical findings
Structural profile
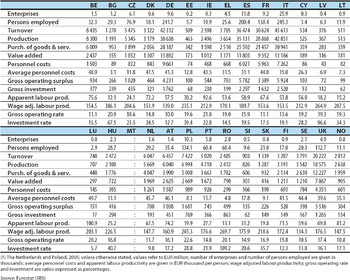
There were 106.6 thousand enterprises across the EU-27 for whom the manufacture of other non-metallic mineral products (NACE Division 26) was their principal activity in 2006. With a workforce of 1.6 million persons, the EU-27’s other non-metallic mineral products sector accounted for 1.2 % of those working across all the non-financial business economies (NACE Sections C to I and K) of the Member States. From a turnover of EUR 242.2 billion in 2006, the enterprises in the EU-27’s other non-metallic mineral products sector generated EUR 79.8 billion of value added, which was equivalent to 1.4 % of the EU-27’s value added in the non-financial business economy.
The EU-27’s cement and concrete manufacturing subsector (NACE Groups 26.5 and 26.6) generated EUR 35.4 billion of value added in 2006, the largest contribution (44.3 %) to the value added of the other non-metallic mineral products manufacturing sector. Just over one fifth (20.9 %) of sectoral value added in 2006 came from the activities of glass manufacturing (NACE Group 26.1), with just under a fifth (19.5 %) coming from the ceramic goods and clay products manufacturing subsector (NACE Groups 26.2 to 26.4). The remaining share of sectoral value added came from the activities of stone and miscellaneous non-metallic mineral products (NACE Groups 26.7 and 26.8).
The other non-metallic mineral products manufacturing sectors in Germany and Italy were the largest among the Member States, generating EUR 13.9 billion and EUR 13.2 billion of value added respectively in 2006; together they contributed a little over one third (33.9 %) of the value added generated across the EU-27. However, the contribution made by the other non-metallic mineral products manufacturing sector to the total value added of the non-financial business economy was highest (2.7 %) in the Czech Republic, followed by Cyprus and Bulgaria (both 2.5 % in 2005). In the Czech Republic, this share was almost double the EU-27 average of 1.4 %.
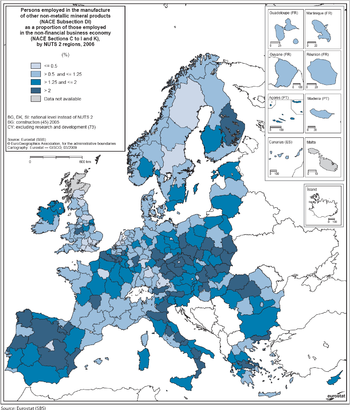
There were many regions in Poland, Italy, Germany, the Czech Republic, Slovakia, Spain and Belgium in which employment in other non-metallic mineral products manufacturing represented at least 2.0 % of the non-financial business economy workforce in 2006. There were also regional pockets in a number of other Member States with relatively high employment in the sector. One of these was the Centro region of Portugal, which was one of only three regions across the EU-27, behind the Province of Namur (Belgium) and Świętokrzyskie (Poland), in which just over 5.0 % of the non-financial business economy workforce was engaged in other non-metallic mineral products manufacturing.
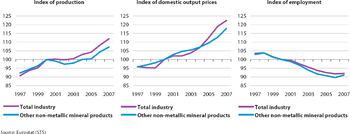
Between 1997 and 2007 the production index of other non-metallic mineral products developed in a similar way to the corresponding index for industry as a whole (NACE Sections C to E); in both cases, relatively strong growth in output came to an end in 2000 before resuming in 2003 through to 2007. Where the production indices of the two differed was in 2001 and 2002; whereas industrial output changed only slightly, the output of other non-metallic mineral products contracted.
The domestic output price index for the manufacture of other non-metallic mineral products rose continuously and remarkably steadily (at an average 2.1 % per year) during the ten years through to 2007. In these respects, it differed from the development of the domestic output price index for industry as a whole, for which periods of steep price increases (2000 and 2001, and again from 2003) were preceded by one or more years of relative price stagnation.
A small majority (52.6 %) of the value added generated within the EU-27’s other non-metallic mineral products manufacturing sector in 2006 came from small and medium-sized enterprises (SMEs, employing less than 250 people). This majority was less than that (57.9 %) across the EU-27’s non-financial business economy, but contrasted with the situation within industry as a whole, where a minority (42.5 %) of value added was from SMEs. Romania and France stood apart from the other Member States, in that SMEs made a particularly small contribution within their other non-metallic mineral products manufacturing sectors, as they contributed closer to one third (32.6 % and 37.8 % respectively) of sectoral value added in 2006.
Employment characteristics
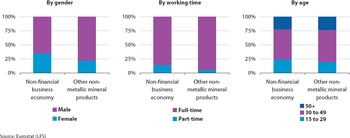
The profile of workers within the EU-27’s other non-metallic mineral products manufacturing sector was rather different to that of the non-financial business economy in terms of gender breakdown, part-time status and age profile.
There was a much higher proportion of men in the EU-27’s other non-metallic mineral products manufacturing workforce than across the non-financial business economy workforce (78.1 % compared with 64.9 %) in 2007. This characteristic was common across almost all of the Member States, but was particularly evident in Estonia, the Netherlands and Greece. It was only in the Czech Republic that the proportion of men working in this sector was relatively similar (albeit 2.8 percentage points higher) to that of its non-financial business economy.
Full-time employment within the EU-27’s other non-metallic mineral products manufacturing workforce (94.5 % in 2007) was also much more common than it was across the non-financial business economy as a whole (85.7 %).
The proportion of workers in the EU-27’s other non-metallic mineral products manufacturing sector under the age of 30 (19.7 %) was notably smaller than the proportion (24.3 %) within the non-financial business economy. This characteristic was particularly pronounced in Denmark, where the share of young workers was almost one half of that for young workers across its non-financial business economy, and was also quite pronounced in the Netherlands, the United Kingdom and Ireland.
Expenditure, productivity and profitability
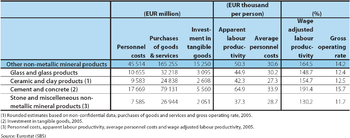
Personnel costs in the EU-27’s other non-metallic mineral products manufacturing sector accounted for 21.6 % of operating expenditure in 2006, a notably higher share than that (16.1 %) for the non-financial business economy as a whole. Personnel costs in the glass manufacturing subsector (NACE Group 26.1) and the ceramic goods and clay products manufacturing subsector (NACE Groups 26.2 to 26.4) accounted for even higher proportions of operating expenditure (24.9 % and 28.7 % in 2005).
Tangible investment in the EU-27’s other non-metallic mineral products manufacturing sector was EUR 15.3 billion in 2006. This investment was the equivalent of 19.1 % of the value added generated by the sector in 2006, which was a slightly higher investment rate than that (18.4 %) across the EU-27’s non-financial business economy. The level of tangible investment in other non-metallic mineral products manufacturing activities was almost the same as the value added generated by the sector in Romania (a corresponding investment rate of 109.2 %) and Lithuania (96.6 %), these investment rates being much higher than those of their non-financial business economies.
The apparent labour productivity of the EU-27’s other non-metallic mineral products manufacturing sector was EUR 50.3 thousand per person in 2006, which was about EUR 6.8 thousand per person more than the average for the non-financial business economy. This average amount of value added generated by each person within the EU-27’s other non-metallic mineral products manufacturing sector was also substantially more than average personnel costs (EUR 30.6 thousand per employee); the resulting wage adjusted labour productivity ratio was 164.5 % in 2007, which was higher than the average ratio (151.1 %) for the EU-27’s non-financial business economy. This characteristic was common to most of the Member States and was most notable in Bulgaria where the wage adjusted labour productivity ratio for the non-metallic mineral products manufacturing sector was 108 percentage points higher than the non-financial business economy average in 2005. Differences of between 40 and 60 percentage points were also noted for Hungary, Cyprus (2005), Greece, Estonia, Luxembourg and Spain. In contrast, the wage adjusted labour productivity ratio for the other non-metallic mineral products manufacturing sector was notably lower than that of the non-financial business economy in Denmark and the United Kingdom.
The gross operating rate of the EU-27’s other non-metallic mineral products manufacturing sector was 14.2 % in 2006, higher than the average for the non-financial business economy (10.8 %). This characteristic was noted for most of the Member States[1], the only exception being in Germany where it was fractionally lower.
External trade
Just over two thirds (68.4 %) of the value of exports of other non-metallic mineral products (CPA Division 26) by EU-27 Member States was as a result of trade with other Member States (so-called intra-EU trade) in 2007. EU-27 exports of other non-metallic mineral products to non-member countries (extra-EU-27 trade) were valued at EUR 18.4 billion in 2007, representing 1.6 % of the value of industrial (CPA Sections C to E) exports. With imports of other non-metallic mineral products into the EU-27 valued at EUR 12.3 billion in 2007, this resulted in the EU-27 having a trade surplus of EUR 6.1 billion in these products. Just over one half (EUR 3.2 billion) of this trade surplus came from ceramic goods and clay products (CPA Groups 26.2 to 26.4) and about one third (EUR 1.9 billion) from glass and glass products (CPA Group 26.1). The EU-27 also recorded relatively small trade surpluses for the two other CPA aggregates within other non-metallic mineral products in 2007. The overall trade surplus for other non-metallic mineral products in 2007 represented, however, a further narrowing of the surplus from its relative peak of EUR 8.4 billion in 2002. In the five years that followed, the value of imports grew much more strongly than exports (total growth of 73.0 % compared with 18.7 %). Much of this growth in imports was from other non-metallic mineral products from China. By 2007, just under two fifths (38.8 %) of all extra-EU-27 imports other non-metallic mineral products came from China. Although the value of EU-27 exports of other non-metallic mineral products grew by 4.4 % between 2006 and 2007, exports to the United States (the EU-27’s principal partner, accounting for a fifth of the market) declined by about one tenth.
Among the Member States, the largest exporters (intra- and extra-EU trade) of other non-metallic mineral products in 2007 were Germany (EUR 12.1 billion) and Italy (EUR 9.9 billion), both of whom recorded significant trade surpluses (EUR 4.2 billion and EUR 6.3 billion respectively). The largest trade deficits in other non-metallic mineral products were recorded for the United Kingdom (EUR 1.8 billion) and France (EUR 1.5 billion).
Data sources and availability
The main part of the analysis in this article is derived from structural business statistics (SBS), including core, business statistics which are disseminated regularly, as well as information compiled on a multi-yearly basis, and the latest results from development projects.
Other data sources include short-term statistics (STS), the Labour force survey (LFS) and the COMEXT database for external trade.
Context
The processes of transforming mineral raw materials such as clay, lime, sand or stone into other non-metallic mineral products (for use, among others, by construction, food and beverages manufacturing, or households in the form of consumer durables) tend to be energy-intensive. Indeed, energy costs accounted for 9.5 % of the purchases of goods and services in the EU’s other non-metallic mineral products manufacturing sector in 2006, the second highest ratio after non-energy mining and quarrying (NACE Subsection CB) among the industrial structural business statistics sectors. Within this sector, the share of energy costs in purchases of goods and services reached 14.9 % for the EU-27’s ceramic goods and clay products manufacturing subsector.
Current policy initiatives are focused on environmental impacts, energy strategies, and health and safety. Under the Competitiveness and Innovation Programme (CIP), independent consultants delivered studies to the European Commission’s Directorate-General for Enterprise and Industry on the competitiveness of the ceramics and glass sectors in October 2008.
Challenges were identified, including ensuring the availability of energy and raw materials at affordable prices, the need to minimise energy waste, reduce energy use, as well as maintaining emissions within targets and removing tariff and non-tariff international barriers to trade. Suggested areas of development were a focus on the high quality and high value products end of the market, investment in cleaner technologies and environmental management systems, investment in more efficient and flexible automation technologies, improved and more targeted skills training programmes and efforts at a policy level to establish EU environmental regulations on a global platform.
See also
Further Eurostat information
Publications
- European Business: Facts and figures - 2009 edition
Main tables
Database
Dedicated section
External links
Notes
- ↑ Bulgaria, Cyprus, Poland and Romania, 2005; Ireland, Malta and the Netherlands, not available.


