Archive:Farm structure in the United Kingdom - 2007 results
- Data from February 2009. Most recent data: Further Eurostat information, Main tables and Database.
This article is part of a series of country-specific essays on the results of the European Union (EU) Farm structure survey (FSS) 2007. It provides a brief but nevertheless comprehensive insight into farm structure in the United Kingdom.
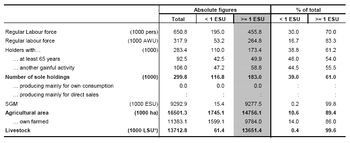
The 2007 FSS recorded 300 000 agricultural holdings in the United Kingdom, which represents a 5 % increase since 2005[1]. The increase is mainly on the smallest holdings of less than one European size unit (ESU). The utilised agricultural area (UAA) was slightly over 16.5 million hectares.
Main statistical findings
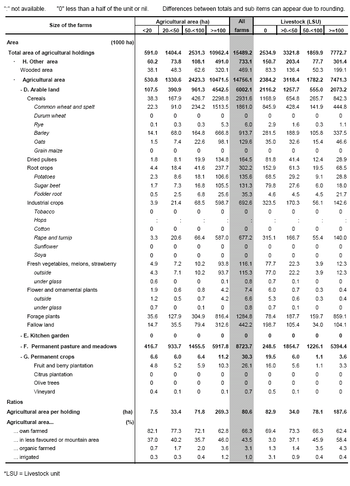
Permanent grassland and meadow accounts for 59 % of the total UAA.
In 2007, 61 % (183 000) of the agricultural holdings in the United Kingdom (UK) had an economic size of at least one European size unit (ESU).
They used about 14.8 million hectares (ha) of utilised agricultural area (UAA), a decrease of 0.3 % compared with 2005. This area represents 89% of the total UAA in the UK and an average of 81 ha per holding.
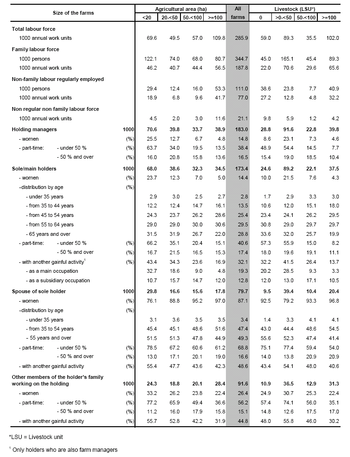
These holdings employed 286 000 annual work units (AWUs), the equivalent of 286 000 people working full time, a decrease of 2 % since 2005.
The farms contained 13.7 million livestock units (LSU) in 2007, 3.5 % less than in 2005. The distribution of livestock by farm size is shown in Table 4 and Graph 3.
Amongst the 183 000 agricultural holdings in 2007:
- 40 % made use of less than one AWU, while another 27 % made use of two or more AWUs;
- 7 % used less than 2 ha, while 73 % used 50 ha or more;
- 75 % of farms in UK specialised in livestock;
- 36 % were specialists in sheep, goats and other grazing livestock;
- 17 % were specialists in cattle - rearing and fattening;
- 16 % were specialists in cereals, oil seed and protein crops; and
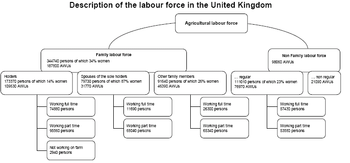
- The family labour force represents 27 % (187 795 AWU) of the total labour force.
Amongst the sole holders:
- 14 % were women in 2007;
- 58 % were aged 55 or more and 3 % were younger than 35 years; and
- 34 % had another gainful activity in 2007.
In the UK in 2007, 9.8 million hectares (43 %) of the agricultural area was farmed by its owners, a 6 % decrease compared with 2005.
The area of permanent grassland and meadow was 9 million ha, 59 % of the UAA in the UK, and it has suffered a 4 % reduction since 2005. 41 % of the UAA is arable land.
Industrial plants increased by 10 % in terms of area compared with 2005, this rise resulted from the growth in the area of rape and turnip with nearly 100 000 ha more in 2007.
84 % of the farms in the UK have livestock. The average LSU per holding was 88. Of all the farm animals 80 % are grazing livestock. The number of farms with dairy cows rose by 12 % from 2005 to 2007, in spite of the 6 % reduction in the number of dairy cows during the same period.
27 % of the British holdings are engaged in other gainful activities. When considering only tourism, accommodation and other leisure activities, the percentage of farms is 11 %.
Data sources and availability
Due to the different coverage of the FSS across Member States, the total number of farms is not comparable between countries. This is why the present analysis, including Tables 1-4 and the figures focus on holdings of at least one European size unit (ESU).
The Farm structure survey 2007 was coordinated by the Department for Environment, Food & Rural Affairs (Defra) which was responsible for collating the FSS data from the four constituent countries of the UK: Defra in England, the Department of Agriculture & Rural Development (DARD) in Northern Ireland (NI), the Scottish Government Rural and Environment Analytical Services (REAS) and the Welsh Assembly Government.
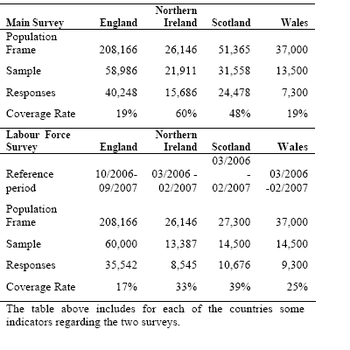
The FSS data were collected in each country in two separate surveys: the majority of data through the regular June survey of agriculture (with 1st June 2007 as its reference day) but the labour data was collected in a separate Labour survey.
In England and Wales a holding is a unit comprising land on which agricultural activities are carried out. In these countries holdings are classified by their Standard Labour Requirement (SLR). In the SLR system, each livestock type and land-use has a theoretical amount of labour required each year. This value is multiplied by the land area or livestock numbers and then summed to give the SLR for the holding. The SLR indicates the typical number of full time workers required on the holdings. Farms over 5 SLR are sampled 100 %, and under 0.25 SLR have a sampling rate of 20%. The threshold for a holding in NI is at least 1 ha or under 1 ha and having livestock (except equidae) or significant horticultural activity. In Scotland the farms included in the survey must have at least 1 ha and 1.66 ESU or one full time farmer or significant poultry or horticultural activity.
Between FSS 2005 and 2007 "maintaining land in good agricultural and environmental conditions" (GAEC) became an agricultural activity and the concerned land has been included in the agricultural area. In England it covers close to 31 100 ha, 97 % in holdings with at least 1 ESU.
For each activity (`enterprise`) on a farm (for instance wheat, dairy cow or vineyard), a standard gross margin (SGM) is estimated, based on the area (or the number of heads) and a regional coefficient. The sum of such margins in a farm is its economic size, expressed in European size units (ESU, 1 ESU is a 1200-euro SGM). The farm type of each holding is calculated into different categories using the SGM. A farm specialized in crops has two thirds or more of its SGM coming from the production of types 1 (field crops), 2 (horticulture) or 3 (permanent crops).
An annual work unit (AWU) is equivalent to a worker employed on a full-time basis for one year. In the United Kingdom it is 1800 hours (225 working days of 8 working hours per day).
Context
European Commission rural development policy aims to improve competitiveness in agriculture and forestry, improve the environment and countryside, improve the quality of life in rural areas and encourage the diversification of rural economies.
As agriculture has modernised and the importance of industry and services within the economy has increased, so agriculture has become much less important as a source of jobs. Consequently, increasing emphasis is placed on the role farmers can play in rural development, including forestry, biodiversity, the diversification of the rural economy to create alternative jobs and environmental protection in rural areas.
The FSS continues to adapt to provide timely and relevant data to help analyse and follow these developments.
See also
Further Eurostat information
Publications
- Farm Structure Survey in the United Kingdom - 2007 - Statistics in focus 81/2009
- National Methodological Report – FSS 2005 (available on request).
Main tables
- Agriculture, see:
- Farm structure: historical data (1990-2007) (t_ef)
Database
- Agriculture, see:
- Farm Structure (ef)
Dedicated section
- Ad-hoc tables: Farm Structure Survey
Methodology / Metadata
- Farm Structure (ESMS metadata file — ef_esms)
External links
- Defra - Department for Environment, Food and Rural Affairs
- Department of Agriculture and Rural Development
- European Commission - Agriculture and Rural Development - Rural Development policy 2007-2013
- Statistics for Wales
- Statistics in Scotland
Notes
- ↑ This rise is due to greater numbers of registrations for animal tracing purposes and for subsidy scheme payments.

