Archive:Business demography - regional analysis
This Statistics Explained article is outdated and has been archived - for recent articles on structural business statistics see here.
- Data from December 2014. Most recent data: Further Eurostat information, Database. Planned article update: December 2016.
The article presents the latest results from the pilot data collection on regional business demography in the European Union (EU), providing information on high-growth enterprises (HGE) and enterprises' birth and death rates.
The regional business demography 2012 data collection was intended to test the feasibility of the most detailed level of regional breakdown (NUTS 2 and NUTS 3) of already available national business demography data (see article Business demography statistics) for the reference years 2008, 2009 and 2010. Eleven Member States participated based on grant agreements (Bulgaria, Denmark, Spain, France, Hungary, Austria, Romania, Slovenia, Slovakia, Finland and the Netherlands) and six more on a voluntary basis (the Czech Republic, Italy, Lithuania, Poland, Estonia and Portugal). Luxembourg, Cyprus and Malta are not concerned, as they consist of only one or two NUTS 3 regions.

(See country codes)
Source: Eurostat (bd_hgnace2_r3)

(DK, FR and FI - 2010 data)
Source: Eurostat (bd_hgnace2_r3)

Source: Eurostat (bd_hgnace2_r3) and (nama_r_e3popgdp)
Main statistical findings
Highlights
- Business demography statistics at the national level can hide substantial differences between regions.
- Significant regional differences exist mainly in the smaller economies, although for France, Italy and Spain sizeable variations exist in death rates.
- Within large economies, differences in the rates of births and deaths of enterprises are driven mainly by micro firms.
- Birth rates of enterprises tend to be higher in the capital region than the national average, while death rates are typically closer to the average.
- In most countries, the highest rates of high-growth enterprises are registered outside the capital region.
Birth rate
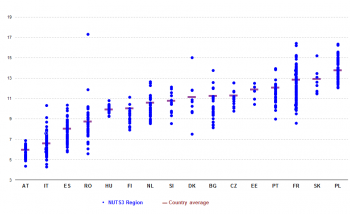
Birth rates of enterprises at NUTS 3 level for the reference year 2010 and for the total business economy of NACE Rev.2 (section B to S, excluding section O and group K642) are presented in Figure 1. The results are promising with plausible trends at the regional level. For example, birth rates of enterprises tend to be higher in (or around) the capital region and in regions with a significant tourism industry (Algarve in Portugal and along the South coast of Spain). In Austria and Italy, the birth rates were particularly low. In other countries, there are also large regional differences, though in some cases this is mainly due to a single region, such as the highest rate recorded for Ilfov in Romania, Varna in Bulgaria and in Denmark: Byen Kobenhavn (with a high rate) and Bornholm (a low rate).
Death rate
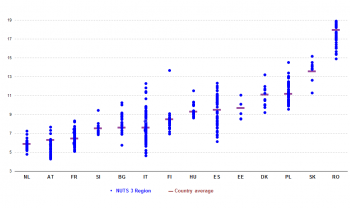
Death rates of enterprises at NUTS 3 level for the reference year 2009 and for the total business economy of NACE Rev.2 (section B to S, excluding section O and group K642) are presented in Figure 2. The death rates were particularly high in Romania, Slovakia and in most Polish regions as well as in southern regions of Spain (e.g. in Andalucia and Murcia), Italy (e.g. Calabria) and the eastern regions of Denmark. Low death rates were recorded in the Netherlands, Austria, north-east Italy and in several regions in France. Interestingly, regions in Poland and Slovakia tended to record high rates of both births and deaths of enterprises, indicating a high level of churn. In Romania, high death rates were accompanied by low rates of birth in 2010, reflecting the further contraction of the economy following the severe recession in 2009.
High-growth enterprises (growth of 10 % or more)
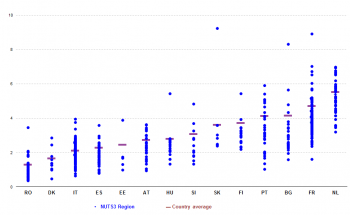
Figure 3 shows the share of high-growth enterprises across regions for the reference year 2010 and for the total business economy of NACE Rev.2 (section B to S, excluding section O and group K642). The results also vary across Europe, with high shares in France, Slovakia and the Netherlands. In Denmark, Estonia, Romania and Austria the share of high-growth enterprises is low, between 4.1 % and 6.0 %. Within countries, large disparities are registered in particular in France, Italy, Portugal and Spain. In most countries, the highest rates are registered outside the capital region. The region with the highest share in France is Guyane, while in the Netherlands Zuidoost-Zuid-Holland has the highest share. In Italy, 17 of the top 20 high-growth regions are located in the Southern part of the country, and the highest share is registered in Medio Campidano (Sardinia). In Spain, Menorca registers a very low performance.
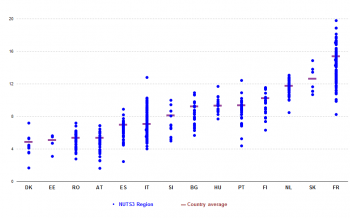
The ratios of high-growth enterprises per capita, presented in Figure 4, show also large regional variations. France and the Netherlands also score well for this indicator, while Slovakia registers the highest regional score for its capital region. In per capita terms, capital regions score better than the rest of the country in all Member States except Italy (Bolzano) and the Netherlands (Delft en Westland). In most cases, the capital regions, because of the high per capita number of firms, are outliers compared with the national averages.
Data sources and availability
The regional business demography (RBD) 2012 pilot data collection followed an explicit request made by the Directorate-General for Regional and Urban Policy (DG REGIO) to Eurostat. A budget portfolio was offered to National Statistical Institutes (NSIs) which needed a grant to participate in this data collection. The scheduled maximum duration of the action was nine months, with the delivery of data expected in February 2013. In March 2013 DG REGIO re-opened the call for proposal to extend the coverage of participating countries.
Data have been delivered from eleven Member States based on grant agreements (Bulgaria, Denmark, Spain, France, Hungary, Austria, Romania, Slovenia, Slovakia, Finland and the Netherlands) and from six others on a voluntary basis (the Czech Republic, Italy, Lithuania, Poland, Estonia and Portugal). Lithuanian results are not disseminated due to lack of consistency in the regional breakdowns of the national business demography figures.
In the next period, the Cohesion policy (2014-2020) will be closely aligned with the Europe 2020 strategy. As a result, it will focus heavily on smart growth with its emphasis on innovation and high-growth firms. In this context, DG REGIO intends to launch the RBD 2015 data collection, as a continuation of the previous one (2012), including the 2011, 2012 and 2013 reference years. This follow-up study will support the development of the NSIs' production systems and assure sustainable future data collections.
Context
The European Commission (EC) needs regional business demography to better assess and monitor the quality of the business environment in the regions of the European Union. A substantial share of Cohesion policy funds (EUR 350 billion between 2007-2013) was dedicated to improving the business environment and entrepreneurship. In particular, Cohesion policy targets support to small and medium-sized enterprises (SMEs) and newly born businesses, to boost their growth and innovative capacity. Given the regional nature of most Cohesion policy programmes, regional business demography indicators would reveal where new businesses are created and how quickly firms grow.
The Regional business demography data collection was carried out by applying the business demography methodology at the national level, based on enterprise demography events. In Business demography, the observation unit is an enterprise, thus the pilot data gave the breakdown of the national business demography figures at a regional level. However, some large enterprises consist of several local units that might be spread across different regions. To take this fact into account, the persons employed in the enterprises are based on the enterprise headquarters and may be not located in the same region.
The pilot exercise intended to test the feasibility of a regional breakdown of the available national business demography data for reference years 2008, 2009 and 2010. The information was demanded for business demography (BD) and employer business demography (EBD), including number of enterprises, births, deaths and survivals up to three years, as well as the related employment figures (persons employed and employees). In addition, the number of high-growth enterprises, with a 10 % level of growth over a three-year period was requested.
Both the NUTS 2 and the NUTS 3 regional breakdowns were requested, broken down separately by size class and NACE Rev. 2. The aggregated business demography employee size classes were used (0, 1 to 9, 10 or more employees), as well as the totals. To avoid the extensive confidentiality pattern, the economic coverage of NACE Rev. 2 concerned only the sections/aggregated sections of industry, construction and services (B+C+D+E, F, G, H, I, J, K+L, M+N, P+Q, R+S of NACE Rev. 2 and the total). Activities of holding companies (group K 64.2) were excluded from the data collection.
The project analyses were included by DG REGIO in the 6th Cohesion Report, published in July 2014. It includes analysis and maps highlighting the regions where the business environment could be further improved. This helps with policies aiming to improve access to credit, setting-up business incubators or offering joint services to small start-ups etc.
See also
- Business demography statistics
- Structural business statistics - theme entry page
- Structural business statistics introduced - background article
- Structural business statistics at regional level
Further Eurostat information
Database
- Business demography statistics - all activities (bd)
- Regional business demography (bd_r)
Dedicated section
Methodology / Metadata
- Business demography statistics - all activities (ESMS metadata file — bd_esms)
- Eurostat-OECD Manual on Business Demography Statistics
