- Data from April 2012. Most recent data: Further Eurostat information, Main tables and Database.
This article presents an overview of statistics for the telecommunications services sector in the European Union (EU), as covered by NACE Rev. 2 Division 61.


(% share of sectoral total) - Source: Eurostat (sbs_na_1a_se_r2)


Main statistical findings
Structural profile
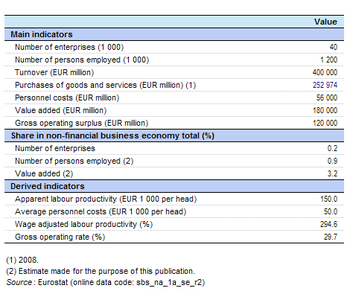
There were around 40 thousand enterprises operating within the telecommunications services (Division 61) sector in the EU-27 in 2009. Together they employed 1.2 million persons, equivalent to 0.9 % of the non-financial business economy (Sections B to J and L to N and Division 95) workforce, or in excess of one in five (20.9 %) of those employed in information and communication services (Section J). The EU-27 telecommunications services sector generated EUR 180 000 million of value added in 2009 which was 3.2 % of the non-financial business economy total and well in excess of one third (37.7 %) of the information and communication services total.
As such, with a considerably higher share of value added than employment, the telecommunications services sector had apparent labour productivity that was well above average. EU-27 productivity (using this measure) was EUR 150 thousand of value added per person employed in 2009, which was 3.6 times as high as the non-financial business economy average of EUR 41.6 thousand per person employed and almost double the information and communication services average of EUR 83 thousand per person employed. When ranking all of the NACE divisions within the non-financial business economy, telecommunications services had the fourth highest level of apparent labour productivity in 2009.
Average personnel costs for the EU-27 telecommunications services sector were, at EUR 50 thousand per employee, less elevated than apparent labour productivity – some two thirds higher than the non-financial business economy average of EUR 30.0 thousand per employee. Average personnel costs per employee for the telecommunications services sector were only EUR 1.4 thousand per employee higher than the average for the whole of information and communication services.
As a result, the wage-adjusted labour productivity ratio (which combines the two previous indicators and shows the extent to which value added per person employed covers average personnel costs per employee) stood at 294.6 % for the EU-27 telecommunications services sector in 2009. This was the fifth highest level of wage-adjusted labour productivity among the NACE divisions that compose the non-financial business economy and well above the information and communication services average of 171.2 % or the non-financial business economy average of 138.8 %.
The gross operating rate (the relation between the gross operating surplus and turnover) is one measure of operating profitability; it stood at 29.7 % for the EU-27’s telecommunications services sector in 2009, which was just over three times as high as the non-financial business economy average (9.7 %) and some 8.8 percentage points above the information and communication services average (20.9 %). As such, the telecommunication services sector recorded the sixth highest level of profitability (using this measure) among the NACE divisions within the non-financial business economy.
Sectoral analysis
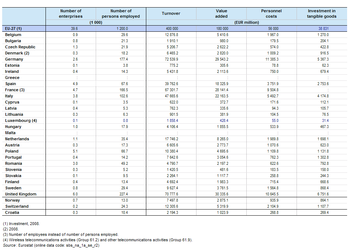
More than half of all the enterprises that were active within the EU-27’s telecommunications services sector in 2009 were classified in the residual grouping of other telecommunications activities (Group 61.9), some 21 700 enterprises or 54.9 % of the telecommunications services total. The next largest subsector (in terms of numbers of enterprises) was that of wired telecommunications activities (Group 61.1), for which there were 11 200 enterprises across the EU-27 in 2009. This was more than double the number of enterprises whose principal activity was wireless telecommunications (4 700, Group 61.2), while there were very few enterprises operating satellite telecommunications activities (800, Group 61.3).
The relative weight of these four subsectors was somewhat different in terms of employment. Wired telecommunications activities were the main employer, with an EU-27 workforce of 569.3 thousand persons in 2009 (49.7 % of the telecommunications services total). More than one quarter of the telecommunications services workforce worked in other telecommunications activities, while just over one in six was employed within wireless telecommunications activities.
Wireless telecommunications activities had a far higher share of value added, accounting for 30.0 % of the added value within the EU-27’s telecommunications services sector in 2009. This was still well behind the value added generated by wired telecommunications activities (45.9 % of the sectoral total or EUR 82 650 million). The relative weight of other telecommunications activities was considerably lower in terms of value added, accounting for 22.1 % of the sectoral total for telecommunications services, while satellite telecommunications activities accounted for a small share (1.6 % in 2008).
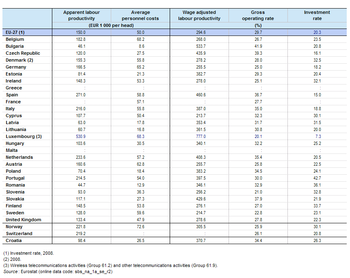
The EU-27 recorded apparent labour productivity in excess of EUR 100 thousand per person employed in all four subsectors. Note the data for satellite telecommunication activities are only available for 2008, when EUR 316 thousand of added value was generated per person employed. Wireless telecommunications activities had the next highest level of apparent labour productivity, EUR 265 thousand per person employed in 2009, while the ratio for wired telecommunications activities was EUR 139 thousand per person employed (also in 2009).
There was a high degree of similarity regarding average personnel costs across the EU-27 telecommunications services subsectors in 2009. For wired, wireless and satellite telecommunications activities average personnel costs ranged between EUR 50.6 thousand and EUR 50.0 thousand per employee, while those for other telecommunications activities were only slightly lower, at EUR 48.4 thousand per employee.
As such, with little difference in average personnel costs, the ranking of subsectors according to their wage-adjusted labour productivity ratios was highly influenced by apparent labour productivity figures. EU-27 wireless and satellite telecommunications activities had very high wage-adjusted labour productivity ratios, at 523.6 % and 522.8 % respectively; the latter for 2008. As such, wireless telecommunications activities recorded the fifth highest wage-adjusted labour productivity ratio among the NACE groups that make-up the non-financial business economy in 2009. The wage-adjusted labour productivity ratio for wired telecommunications activities (275.8 %) meant that it ranked just outside the top ten NACE groups in the non-financial business economy, lying in eleventh place in 2009.
The EU-27’s telecommunications services subsectors also consistently recorded high gross operating rates. These peaked in 2009 at 32.1 % for wired telecommunications activities, just 0.1 percentage points above the rate that was registered for wireless telecommunications activities. As such, both of these subsectors were among the top ten NACE groups in the non-financial business economy with the highest levels of profitability (using this measure).
Country analysis
The United Kingdom had the highest share (16.9 %) of EU-27 value added within the telecommunications services sector in 2009, in large part due to a 72.7 % share of the added value generated within the EU-27’s other telecommunications activities subsector. Indeed, France recorded the highest share of EU-27 value added for the other three subsectors, with a 21.6 % share of wireless telecommunication activities and a 17.6 % share of wired telecommunication activities (a full set of information is not available for the relatively small activity of satellite telecommunications services).
The highest contribution made by the telecommunications services sector to the non-financial business economy in value added terms was observed in Bulgaria, where this sector contributed 5.9 % of total added value in 2009. This reflected a general pattern of relatively high shares for the majority of the Member States that joined the EU in 2004 or 2007, as the next highest shares were recorded in Slovakia, Romania, Estonia and Latvia. The telecommunications services sector provided at least 4.5 % of non-financial business economy value added in each of these four countries in 2009.
The highest apparent labour productivity within the Member States for the telecommunications services sector in 2009 was recorded for Spain (EUR 271 thousand per person employed). This figure was almost seven times as high as the Spanish average for the whole of its non-financial business economy. In Portugal, the apparent labour productivity of the telecommunications sector was 9.1 times as high as the national non-financial business economy average, at EUR 214.5 thousand per person employed. Compared with national non-financial business economy, the Irish telecommunications services sector recorded apparent labour productivity that was double its average. Nevertheless, based upon this comparison this was the lowest ratio among the Member States, indicating how high the apparent labour productivity in this sector is when compared with other activities.
The wage-adjusted labour productivity ratio peaked in 2009 in Bulgaria at 533.7 %, followed by Spain (460.6 %) and the Czech Republic (435.9 %). These values were considerably higher than the respective national averages recorded for the whole of the non-financial business economy. Indeed, in Spain the wage-adjusted labour productivity ratio in this sector was 3.5 times as high as the non-financial business economy average, and in Italy it stood 3.4 times as high, while for Bulgaria and for Lithuania (361.5 %) the wage-adjusted labour productivity ratio in this sector was higher than in any other NACE division within the non-financial business economy in 2009, as it also was in Croatia (370.7 %). The lowest wage-adjusted labour productivity ratio for the telecommunications services sector was recorded in Cyprus (213.7 %), where the wage-adjusted labour productivity ratio was nevertheless 35 % higher than the non-financial business economy average.
A similar pattern was observed for the gross operating rate, as comparatively high rates were consistently recorded across all of the Member States. These peaked in 2009 at 41.9 % for the Bulgarian telecommunications services sector, followed by 39.3 % in the Czech Republic which was the highest gross operating rate in any NACE division within the Czech non-financial business economy. The lowest gross operating ratio in this sector was recorded in Slovenia (21.0 %), although this figure was almost three times as high as the Slovenian non-financial business economy average.
Data sources and availability
The analysis presented in this article is based on the main dataset for structural business statistics (SBS) which are disseminated annually. The series provides information for each Member State as well as a number of non-member countries at a detailed level according to the activity classification NACE. Data are available for a wide range of variables.
Context
This article presents an overview of statistics for the telecommunications services sector in the EU, as covered by NACE Rev. 2 Division 61. This division includes the activities of providing telecommunications and related service activities, such as transmitting voice, data, text, sound and video. The transmission facilities that carry out these activities may be based on a single technology or a combination of technologies. The commonality of activities classified in this division is the transmission of content, without being involved in its creation. The breakdown in this division is based on the type of infrastructure that is being operated. In the case of the transmission of television signals this may include the bundling of complete programming channels (produced by units classified to Division 60, programming and broadcasting activities) in to programme packages for distribution.
Wired, wireless and satellite telecommunications activities include operating and maintaining switching and transmission facilities to provide communications; these activities also include the provision of internet access. For wired technology, telecommunications are provided point to point via landlines, microwave, or a combination of landlines and satellite linkups; operating of cable distribution systems (for example, the distribution of data and television signals); furnishing telegraph and other non-vocal communications using own facilities. For wireless telecommunications omni-directional transmission via airwaves is provided and these services may be based on a single technology or a combination of technologies. Activities of maintaining and operating paging as well as cellular and other wireless telecommunications networks are also included. Satellite telecommunications activities use satellite infrastructure: this includes the delivery of visual, aural or textual programming received from television channels, television stations and networks, or radio networks to consumers via direct-to-home satellite systems.
Other telecommunications activities include the provision of specialised telecommunications applications, such as satellite tracking, communications telemetry, and radar station operations, as well as the operation of satellite terminal stations and associated facilities operationally connected with one or more terrestrial communications systems and capable of transmitting telecommunications to or receiving telecommunications from satellite systems. The provision of internet access over networks between the client and the ISP not owned or controlled by the ISP, such as dial-up internet access are included, as well as the provision of telephone and internet access in facilities open to the public, voice over internet protocol provision and telecommunications resellers (in other words, purchasing and reselling network capacity without providing additional services).
This NACE Division is composed of four Groups:
- wired telecommunications activities (Group 61.1);
- wireless telecommunications activities (Group 61.2);
- satellite telecommunications activities (Group 61.3);
- other telecommunications activities (Group 61.9).
Further Eurostat information
Publications
Main tables
Database
- SBS – services (sbs_serv)
- Annual detailed enterprise statistics - services (sbs_na_serv)
- Annual detailed enterprise statistics for services (NACE Rev.2 H-N and S95) (sbs_na_1a_se_r2)
- Preliminary results on services, main indicators (NACE Rev.2) (sbs_sc_r2preli)
- SMEs - Annual enterprise statistics broken down by size classes - services (sbs_sc_sc)
- Services broken down by employment size classes (NACE Rev.2 H-N and S95) (sbs_sc_1b_se_r2)
- Annual detailed enterprise statistics - services (sbs_na_serv)
- SBS - regional data - all activities (sbs_r)
- SBS data by NUTS 2 regions and NACE Rev.2, from 2008 onwards (sbs_r_nuts06_r2)
Dedicated section
Methodology / Metadata
- Name of the destination ESMS metadata file (ESMS metadata file - ESMS code, e.g. bop_fats_esms)
- Title of the publication
Source data for tables, figures and maps (MS Excel)
Other information
- Regulation 58/1997 of 20 December 1996 concerning structural business statistics
- Decision 2367/2002/EC of 16 December 2002 on the Community statistical programme 2003 to 2007
- Regulation 295/2008 of 11 March 2008 concerning structural business statistics
