Archive:Manufacture of basic metals statistics - NACE Rev. 2
- Data from April 2012. Most recent data: Further Eurostat information, Main tables and Database.
This article presents an overview of statistics for basic metals manufacturing in the European Union (EU), as covered by NACE Rev. 2 Division 24.


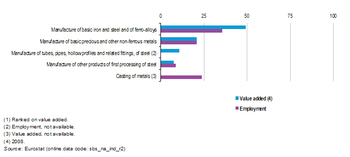
(% share of sectoral total) - Source: Eurostat (sbs_na_ind_r2)


Main statistical findings
Structural profile
The 17 thousand enterprises in the EU-27’s basic metals manufacturing sector (Division 24) in 2009 made up 0.1 % of all enterprises in the non-financial business economy (Sections B to J and L to N and Division 95). However, in terms of employment this sector was far more significant, as 1.03 million persons worked in basic metals manufacturing, equivalent to 0.8 % of the non-financial business economy workforce and 3.4 % of manufacturing (Section C) employment. In 2008 approximately EUR 80 000 million of value added was generated through basic metals manufacturing, around 4.8 % of the manufacturing total.
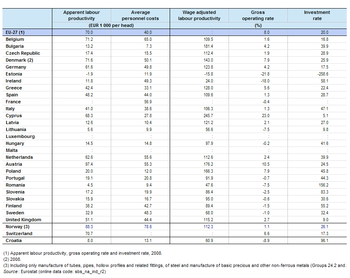
The apparent labour productivity of the EU-27's basic metals manufacturing sector in 2008 was EUR 70 thousand per person employed, above the manufacturing average of EUR 51 thousand per person employed. Equally, average personnel costs within this sector were above the manufacturing average, reaching EUR 40.0 thousand per employee for basic metals manufacturing in 2009 which was EUR 5.5 thousand per employee higher than the manufacturing average.
The gross operating rate (the relation between the gross operating surplus and turnover) was 8.0 % in 2008 for the EU-27’s basic metals manufacturing sector, marginally lower than the manufacturing average (8.3 %).
Sectoral analysis
Within the EU-27’s basic metals manufacturing sector the three largest subsectors in terms of employment were the manufacture of basic iron and steel and of ferro-alloys (Group 24.1), the casting of metals (Group 24.5) subsector and the manufacture of basic precious and other non-ferrous metals (Group 24.4), each occupying more than one fifth of the basic metals manufacturing workforce in 2009.
In output terms, the relative importance of the manufacture of basic iron and steel and of ferro-alloys was greater than in employment terms, accounting for almost half (49.3 %) of the sectoral value added in 2008. Particular care has to be taken comparing information on value added between 2008 and 2009 as the impact of the financial and economic crisis was strong. For example, although precise data for 2009 are not available, the share of the manufacture of basic iron and steel and of ferro-alloys subsector fell in 2009 to about one third of sectoral value added, compared with a share of almost one half in 2008.
In 2009 the only subsector to record an apparent labour productivity figure above the manufacturing and non-financial business economy averages was the manufacture of basic precious and other non-ferrous metals where value added per person employed within the EU-27 averaged EUR 59 thousand. The lowest level of apparent labour productivity among the basic metals manufacturing subsectors was EUR 37 thousand recorded for the casting of metals. Note that 2009 data is not available for the manufacture of tubes, pipes, hollow profiles and related fittings, of steel (Group 24.2) and that the 2008 apparent labour productivity (EUR 70 thousand) for this subsector should not be directly compared with the 2009 values for the other subsectors.
At the NACE group level, personnel costs per employee peaked in 2009 at an average of EUR 46.5 thousand for the EU-27’s manufacture of basic precious and other non-ferrous metals subsector. Average personnel costs per employee exceeded the non-financial business economy average (EUR 30 thousand) for all basic metals manufacturing subsectors and also exceeded the manufacturing average (EUR 34.5 thousand) for all subsectors except the casting of metals.
The wage-adjusted labour productivity was particularly low for the EU-27’s manufacture of basic iron and steel and of ferro-alloys subsector, where a ratio of 94.3 % was recorded, indicating that apparent labour productivity exceeded average personnel costs in 2009; this was the lowest wage-adjusted labour productivity ratio among all of the manufacturing NACE groups in 2009 and the fifth lowest among the non-financial business economy NACE groups. The three other subsectors for which 2009 data are available (see Table 2b) recorded wage-adjusted labour productivity ratios above 100 % but below the manufacturing and non-financial business economy averages.
In all of the four basic metals manufacturing NACE groups for which data are available for 2009 the EU-27 gross operating rate was below the non-financial business economy average (9.7 %). For three of the subsectors this ratio ranged from 2.7 % to 3.9 %, with the manufacture of tubes, pipes, hollow profiles and related fittings, of steel recording an EU-27 gross operating rate of 7.4 %, just above the manufacturing average (7.0 %). The manufacture of basic iron and steel and of ferro-alloys recorded a gross operating rate of 9.7 % in 2008, which was above the manufacturing average (8.3 %) for that year.
Country analysis
Germany had the highest value added of any Member State in each of the basic metals manufacturing subsectors in 2009: Germany’s share of EU-27 value added ranged from 30.7 % for the manufacture of other products of first processing of steel (Group 24.3) to 36.9 % for the casting of metals.
The relative importance of the basic metals manufacturing sector was highest in Austria where it accounted for 2.3 % of non-financial business economy value added in 2009, a far greater share than in the next most specialised Member States, namely Slovakia (1.7 %) and Belgium (1.4 %). Austrian specialisation was particularly strong in the manufacture of basic iron and steel and of ferro-alloys.
The wage-adjusted labour productivity ratios available for most Member States for 2009 reflect the economic situation: Estonia recorded a negative rate due to its negative value added. The wage-adjusted labour productivity ratio for this sector failed to reach 100 % for ten Member States in 2009, the second highest frequency among all of the NACE divisions within the non-financial business economy. Nevertheless, the wage-adjusted labour productivity ratio for basic metals manufacturing was above the manufacturing average for four Member States in 2009, most notably in Cyprus and Austria, but also in Bulgaria and Germany.
A broadly similar situation was observed for the gross operating rate, where Cyprus and Austria were the only Member States to record a gross operating rate for this sector that was above their national manufacturing averages. A total of 11 Member States recorded a negative gross operating rate in 2009, as did Croatia: in Estonia this again reflected the negative value added, while in the other ten Member States and Croatia value added did not cover the personnel costs. This represented the highest number of Member States with a negative gross operating rate across all of the non-financial business economy NACE divisions in 2009.
Data sources and availability
The analysis presented in this article is based on the main dataset for structural business statistics (SBS) which are disseminated annually. The series provides information for each Member State as well as a number of non-member countries at a detailed level according to the activity classification NACE. Data are available for a wide range of variables.
Context
This article presents an overview of statistics for the basic metals manufacturing sector in the EU, as covered by NACE Rev. 2 Division 24. This division includes the activities of smelting and/or refining ferrous and non-ferrous metals from ore, pig or scrap, using electrometallurgic and other process metallurgic techniques.
This division also includes the manufacture of metal alloys and super-alloys by introducing other chemical elements to pure metals.
The output of smelting and refining, usually in ingot form, is used in rolling, drawing and extruding operations to make products such as plate, sheet, strip, bars, rods, wire or tubes, pipes and hollow profiles and in molten form to make castings and other basic metal products.
The manufacture of other products from the first processing of steel (such as bars, strips, sheets or wire) includes manufacturing by cold processing of steel. The manufacture of basic precious and non-ferrous metals includes gold, silver, platinum, aluminium, lead, zinc, tin, copper, chrome, manganese, nickel, nuclear fuel (uranium).
This NACE division is composed of five groups:
- the manufacture of basic iron and steel and of ferro-alloys (Group 24.1);
- the manufacture of tubes, pipes, hollow profiles and related fittings, of steel (Group 24.2);
- the manufacture of other products of first processing of steel (Group 24.3);
- the manufacture of basic precious and non-ferrous metals (Group 24.4);
- the casting of metals (Group 24.5) as semi-finished products.
Excluded are the manufacture of finished metal products (which from part of the manufacture of fabricated metal products, Division 25) and metal jewellery (which is classified as part of other manufacturing, Division 32).
Further Eurostat information
Publications
Main tables
Database
- SBS - industry and construction (sbs_ind_co)
- Annual detailed enterprise statistics - industry and construction (sbs_na_ind)
- Annual detailed enterprise statistics for industry (NACE Rev.2 B-E) (sbs_na_ind_r2)
- Preliminary results on industry and construction, main indicators (NACE Rev.2) (sbs_na_r2preli)
- SMEs - Annual enterprise statistics broken down by size classes - industry and construction (sbs_sc_ind)
- Industry broken down by employment size classes (NACE Rev.2 B-E) (sbs_sc_ind_r2)
- Annual detailed enterprise statistics - industry and construction (sbs_na_ind)
- SBS - regional data - all activities (sbs_r)
- SBS data by NUTS 2 regions and NACE Rev.2, from 2008 onwards (sbs_r_nuts06_r2)
Dedicated section
Source data for tables, figures and maps (MS Excel)
Other information
- Regulation 58/1997 of 20 December 1996 concerning structural business statistics
- Decision 2367/2002/EC of 16 December 2002 on the Community statistical programme 2003 to 2007
- Regulation 295/2008 of 11 March 2008 concerning structural business statistics