- Data from September 2011, most recent data: Further Eurostat information, Main tables and Database.
This article presents recent statistical data on many different aspects of the information society in the European Union (EU). Progress in the development of the information society is regarded as critical to improve the competitiveness of EU industry and, more generally, to meet the demands of society and the EU economy.
Information and communication technologies (ICT) affect people's everyday lives in many ways, both at work and in the home, and EU policies in this area range from regulating entire sectors to trying to protect an individual's privacy.
Main statistical findings
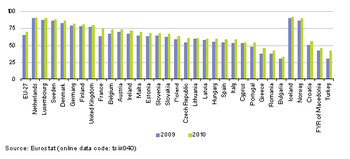
(% of all households) - Source: Eurostat (tsiir040)

(% of all households) - Source: Eurostat (isoc_pibi_hiac) and (isoc_pibi_hba)
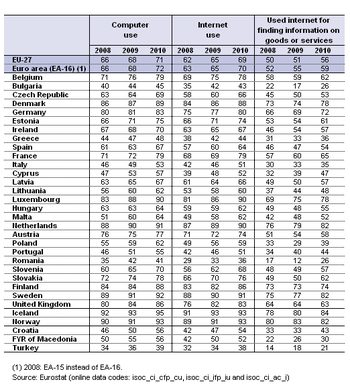
(% of individuals aged 16 to 74) - Source: Eurostat (isoc_ci_cfp_cu), (isoc_ci_ifp_iu) and (isoc_ci_ac_i)
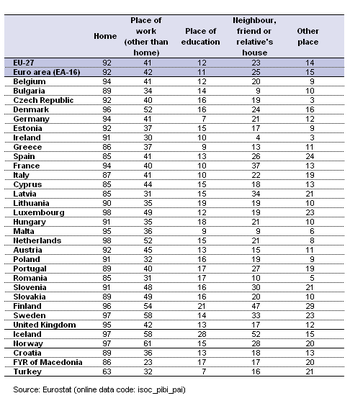
(% of individuals aged 16 to 74 who used the internet in the three months prior to the survey) - Source: Eurostat (isoc_pibi_pai)
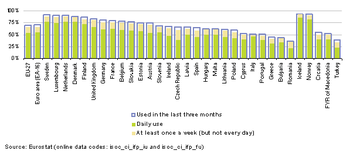
(% of individuals aged 16 to 74) - Source: Eurostat (isoc_ci_ifp_iu) and (isoc_ci_ifp_fu)
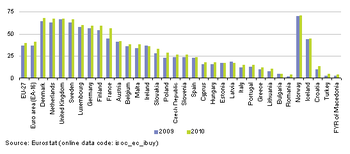
(% of individuals aged 16 to 74) - Source: Eurostat (isoc_ec_ibuy)
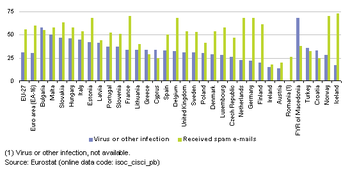
(% of individuals having used the internet in the 12 months prior to the survey) - Source: Eurostat (isoc_cisci_pb)
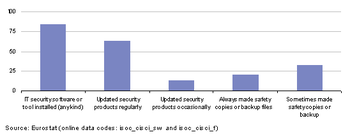
(% of individuals having used the internet in the 12 months prior to the survey) - Source: Eurostat (isoc_cisci_sw) and (isoc_cisci_f)
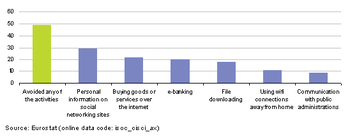
(% of individuals having used the internet in the 12 months prior to the survey) - Source: Eurostat (isoc_cisci_ax)
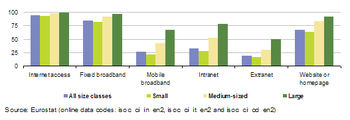
(% of enterprises) - Source: Eurostat (isoc_ci_in_en2), (isoc_ci_it_en2) and (isoc_ci_cd_en2)
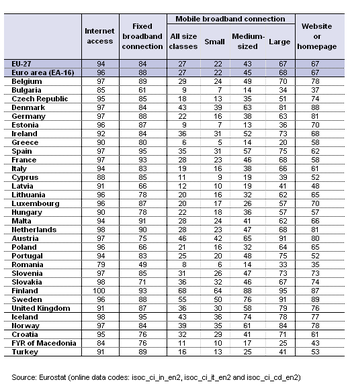
(% of enterprises) - Source: Eurostat (isoc_ci_in_en2), (isoc_ci_it_en2) and (isoc_ci_cd_en2)
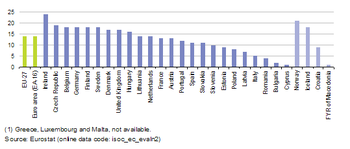
(% of total turnover) - Source: Eurostat (isoc_ec_evaln2)

(% of enterprises) - Source: Eurostat (isoc_ec_eseln2)
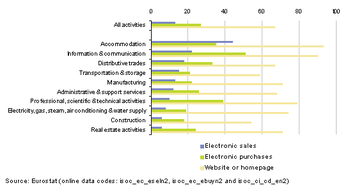
(% of enterprises) - Source: Eurostat (isoc_ec_eseln2), (isoc_ec_ebuyn2) and (isoc_ci_cd_en2)

(% of enterprises) - Source: Eurostat (isoc_cisce_ra)
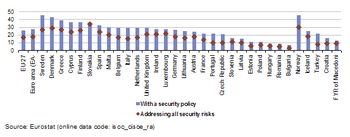
(% of enterprises) - Source: Eurostat (isoc_cisce_ra)
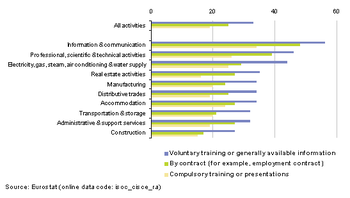
(% of enterprises) - Source: Eurostat (isoc_cisce_ra)
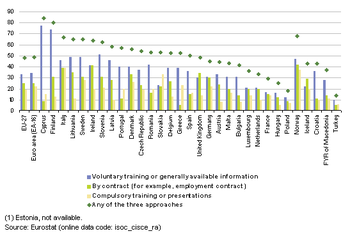
(% of enterprises) - Source: Eurostat (isoc_cisce_ra)
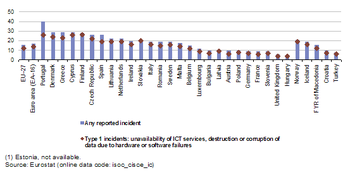
(% of enterprises) - Source: Eurostat (isoc_cisce_ic)
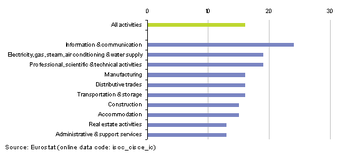
(% of enterprises) - Source: Eurostat (isoc_cisce_ic)
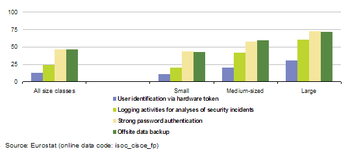
(% of enterprises) - Source: Eurostat (isoc_cisce_fp)
Households and individuals
During the last decade, ICT have become widely available to the general public, both in terms of accessibility as well as cost. A boundary was crossed in 2007, when a majority (54 %) of households in the EU-27 had internet access. This proportion continued to increase and in 2010 reached 70 %. The highest proportion (91 %) of households with internet access in 2010 was recorded in the Netherlands, the lowest (33 %) in Bulgaria (see Figure 1). Widespread and affordable broadband access is one of the means of promoting a knowledge-based and informed society. In all Member States broadband was by far the most common form of internet access, used by 61 % of all EU-27 households in 2010, approximately double the share in 2006 – see Figure 2.
Around seven out of every ten individuals in the EU-27, aged between 16 and 74 years, had used a computer in the first quarter of 2010 while a similar proportion used the internet. The proportion of individuals using a computer and using the internet in 2010 rose to 90 % in Sweden, the Netherlands and Luxembourg, and was around this level in Denmark and Finland. However, less than half of individuals used computers and the internet in Greece, Bulgaria and particularly in Romania. Well over half (56 %) of the individuals in the EU-27 used the internet for finding information on goods or services in 2010. Large increases of 9 percentage points or more in this type of use of the internet were recorded in 2010 in several Member States that had generally low internet usage, Bulgaria and Romania in particular, and also Slovakia and Poland (see Table 1).
Among internet users, in other words, those individuals within the EU-27 using the internet in the three months before the ICT survey, more than nine in ten (92 %) accessed the internet from home, as shown in Table 2. By comparison, less than half of this subset of the population accessed the internet at work (41 %), which in turn was around double the proportion accessing the internet from a friend's, neighbour's or relative’s house (23 %). Of the 69 % of individuals in the EU-27 that used the internet in 2010, more than three quarters accessed the internet on a daily or almost daily basis.
Two fifths (40 %) of individuals in the EU-27 ordered goods or services over the internet for private use during the year prior to the 2010 survey, an increase of 3 percentage points compared with the year before (see Figure 4). This proportion was around two thirds in Denmark, the Netherlands, the United Kingdom and Sweden, whereas no more than one in 20 persons made orders over the internet in Bulgaria or Romania.
Figures 5 to 7 provide an analysis of security related issues faced by Internet users. More than a half (56 %) of all internet users in the EU-27 in 2010 had (to their knowledge) received spam e-mails, a share that was as low as 18 % in Ireland but as high as 70 % in France; it was higher still (73 %) in Iceland. Nearly one third of users had been confronted by a computer virus (or similar infection), the average across the EU-27 being 31 %. In Bulgaria and Malta did even at least half of all internet users report having experienced such an infection; a much higher proportion (68 %) was reported in the former Yugoslav Republic of Macedonia. More than four fifths (84 %) of internet users in the EU-27 had an IT security software or tool installed, and more than three fifths (63 %) reported that they regularly updated their security products; backing-up data or making safety copies of files was less common – see Figure 6. Around half (49 %) of all internet users reported having at least once avoided an activity on the internet due to security concerns (see Figure 7); the most common of these was to avoid providing personal information on social networking sites, followed by e-commerce (buying goods or services over the internet) and e-banking.
Enterprises
Only about one in 20 of all enterprises in the EU-27 did not have internet access as of the beginning of 2010 (see Figure 8). Around two thirds (67 %) of all enterprises in the EU-27 had their own website and this proportion rose to 92 % among large enterprises. By 2010, the proportion of enterprises with internet access exceeded 90 % in all Member States except Romania, Bulgaria and Cyprus, while in each of the Member States except Romania, Bulgaria and Latvia more than half of all enterprises had a website (Table 3).
In total, e-commerce accounted for around 14 % of turnover among enterprises with at least ten persons employed in the EU-27, a share that ranged from 1 % in Cyprus to 24 % in Ireland in 2009 (see Figure 9). Some 13 % of enterprises in the EU-27 received orders on-line during 2009, which was about half the proportion of enterprises (27 %) that made purchases on-line (see Figure 11). The percentage of enterprises selling on-line was highest in the accommodation sector (44 %), whereas the highest proportion of enterprises making on-line purchases was recorded for information and communication services (51 %).
By January 2010, 26 % of enterprises in the EU-27 had a formally defined ICT security policy with a plan for regular review; this share rose to over 50 % among those enterprises whose principal activity was information and communication activities. Large enterprises were more than three times as likely to have such a security policy as small ones – see Figure 12. Among the Member States, the highest shares of enterprises with a formally defined ICT security policy were recorded in Sweden and Denmark where more than two fifths of enterprises had such policies, as was also the case in Norway.
Enterprises adopt various approaches to raise awareness among employees of ICT security policy and the associated risks – see Figures 14 and 15. Voluntary training or use of generally available information was the approach most commonly reported by enterprises and around three quarters of enterprises had adopted this approach in Cyprus and Finland. Around half (48 %) of all enterprises in the EU-27 reported having used at least one of the three approaches surveyed with this share ranging from 18 % in Poland to 84 % in Cyprus.
ICT related security incidents concern the core elements of information security, integrity, confidentiality and availability of data and IT systems. Type 1 incidents concern the unavailability of ICT services or the destruction or corruption of data due to hardware or software failures. In 2009, 16 % of enterprises in the EU-27 had experienced some kind of ICT-related security incident and 12 % had experienced a type 1 incident. Enterprises in Portugal were by far the most likely to indicate that they had experienced an ICT-related security incident, this being the case in two fifths of Portuguese enterprises in 2009 – see Figure 16.
In January 2010, the use of strong password authentication and offsite data backup were the most commonly reported procedures used by enterprises for internal ICT security, with each of these approaches used by 47 % of enterprises in the EU-27.
Data sources and availability
Statisticians are well aware of the challenges posed by rapid technological change in areas related to the internet and other new applications of ICTs. As such, there has been a considerable degree of evolution in this area, with statistical tools being adapted to satisfy new demands for data. Statistics within this domain are reassessed on an annual basis in order to meet user needs and reflect the rapid pace of technological change.
This approach is reflected in Eurostat’s survey on ICT usage in households and by individuals, and Eurostat’s survey on ICT usage in enterprises. These annual surveys are used to benchmark ICT-driven developments, both by following developments for core variables over time, as well as by looking in greater depth at other aspects at a specific point in time. While the surveys initially concentrated on access and connectivity issues, their scope has subsequently been extended to cover a variety of subjects (for example, e-government and e-commerce) and socio-economic breakdowns, such as regional diversity, gender specificity, age, educational differences and the individual’s employment situation in the household survey, or a breakdown by enterprise size (small, medium-sized, large) in the enterprise survey. The scope of the surveys with respect to different technologies is also adapted so as to cover new product groups and means of delivering communication technologies to end-users (enterprises and households).
Households and individuals
The household survey covers those households having at least one member in the age group 16 to 74 years old. Internet access of households refers to the percentage of households that have an internet access, so that anyone in the household could use the internet at home, if so desired, even simply to send an e-mail. Internet users are defined as all individuals aged 16-74 who had used the internet in the three months prior to the survey. Regular internet users are individuals who used the internet, on average, at least once a week in the three months prior to the survey. The reference period was the first quarter of 2010; the survey period was the second quarter in most countries.
The technologies most commonly used to access the internet are divided between broadband and dial-up access over a normal or an ISDN telephone line. Broadband includes digital subscriber lines (DSL) and uses technology that transports data at high speeds. Broadband lines are defined as having a capacity equal to or higher than 144 kbit/s.
A computer is defined as a personal computer powered by one of the major operating systems (Macintosh, Linux or Microsoft); handheld computers or palmtops (PDAs) are also included.
The ordering of goods and services by individuals includes confirmed reservations for accommodation, purchasing financial investments, participation in lotteries and betting, internet auctions, as well as information services from the internet that are directly paid for. Goods and services that are obtained via the internet for free are excluded. Orders made by manually written e-mails are also excluded.
A special module on internet security was included in the 2010 ICT survey, asking individuals who had used the internet in the previous 12 months about their experience of security threats and their behaviour to avoid security incidences. The latter looked, for example, at viruses (and other infections such as worms or Trojan horses) and unsolicited e-mails (spam). Among other precautions, the use of security software (such as virus checking or anti-spyware programs) was included, as was backing-up by making copies of computer files to an external storage device such as a CD, DVD, external hard disk, USB stick or disk space on a server.
Enterprises
The survey on ICT usage and e-commerce in enterprises covers enterprises that have at least ten persons employed. The activity coverage is restricted to those enterprises whose principal activity is within manufacturing, electricity, gas, steam and water supply, sewerage and waste management, construction, wholesale and retail trade, repair of motor vehicles and motorcycles, transportation and storage, accommodation and food service activities, information and communication, real estate, professional, scientific and technical activities, administrative and support activities and repair of computers and communication equipment (NACE Rev. 2 Sections C to N excluding Division 75 plus Group 95.1); the financial and insurance activities (Section K) are covered by the survey but are excluded from the analysis presented here. A distinction is made according to the size of enterprises in terms of persons employed into small (10-49 persons employed), medium-sized (50-249) and large (250 or more persons employed) enterprises.
ICT usage data are grouped according to the year in which the survey was conducted; most data refer to the situation in January whereas some others (like e-commerce) refer to the calendar year prior to the survey year.
Context
ICT are considered as critical for improving the competitiveness of European industry and, more generally, to meet the demands of society and the economy. ICT affects many aspects of everyday lives, at both work and in the home, and EU policies in this area range from the regulation of entire sectors to the protection of an individual’s privacy.
Broadband technologies are considered to be important when measuring access to and use of the internet, as they offer users the possibility to rapidly transfer large volumes of data and keep access lines open. The take-up of broadband is considered to be a key indicator within the domain of ICT policy-making. Widespread access to the internet via broadband is seen as essential for the development of advanced services on the internet, such as e-business, e-government or e-learning. Digital subscriber lines (DSL) remain the main form of delivery for broadband technology, although alternatives, such as the use of cable, satellite, fibre optics and wireless local loops are becoming more widespread.
Until 2010 the EU policy framework for ICT was the i2010 initiative called 'A European information society for growth and employment' (COM(2005) 229 final) which sought to boost efficiency throughout the EU economy by means of the wider use of ICT. Having undergone a mid-term review, an updated i2010 strategy was presented in April 2008, addressing key challenges for the period 2008-2010.
In May 2010 the European Commission adopted its Communication concerning 'A digital agenda for Europe' (COM(2010) 245 final), a strategy for a flourishing digital economy by 2020. It outlines policies and actions aimed at maximising the benefit of the digital era to all sections of society and economy. The agenda focuses on seven priority areas for action: creating a digital single market, greater interoperability, boosting internet trust and security, providing much faster internet access, encouraging investment in research and development, enhancing digital literacy skills and inclusion, and applying ICT to address challenges facing society like climate change and the ageing population. Examples of benefits include easier electronic payments and invoicing, rapid deployment of telemedicine and energy efficient lighting. The Digital Agenda for Europe is one of the seven flagship initiatives under the Europe 2020 strategy for smart, sustainable and inclusive growth.
Further Eurostat information
Publications
- Science, technology and innovation in Europe
- Science, technology and innovation in Europe – 2011 edition - Pocketbook
Main tables
- Information society, see:
- Information society statistics
- Policy indicators (t_isoc_pi)
- Information society: Structural Indicators (t_isoc_si)
- Telecommunication services (t_isoc_tc)
- Computers and the Internet in households and enterprises (t_isoc_ci)
- E-skills of individuals and ICT competence in enterprises (t_isoc_sk)
Database
- Information society, see:
- Information society statistics
- Policy indicators (isoc_pi)
- Information society: Structural Indicators (isoc_si)
- Telecommunication services (isoc_tc)
- Computers and the Internet in households and enterprises (isoc_ci)
- E-commerce by individuals and enterprises (isoc_ec)
- E-skills of individuals and ICT competence in enterprises (isoc_sk)
- Regional Information society statistics (isoc_reg)
Dedicated section
Methodology / Metadata
- Computers and the Internet in households and enterprises (ESMS metadata file - isoc_ci_esms)
- E-commerce by individuals and enterprises (ESMS metadata file - isoc_ec_esms)
- E-skills of individuals and ICT competence in enterprises (ESMS metadata file - isoc_sk_esms)
- Policy indicators (ESMS metadata file - isoc_pi_esms)
- Regional Information society statistics (ESMS metadata file - isoc_reg_esms)
- Telecommunication services (ESMS metadata file - isoc_tc_esms]
