Archive:Fertiliser consumption and nutrient balance statistics
- Data from August 2011, most recent data: Further Eurostat information, Main tables and Database.
This article presents data on agriculture and the environment within the European Union (EU). Around 40 % of the EU-27’s land area is farmed, highlighting the importance of farming for the EU’s natural environment.
Links between the natural environment and farming practices are complex: farming has contributed over the centuries to creating and maintaining a variety of valuable semi-natural habitats within which a wide range of species rely for their survival; on the other hand, inappropriate agricultural practices and land use can have an adverse effect on natural resources, through the pollution of soil, water and air, or the fragmentation of habitats and a subsequent loss of wildlife.

(in kilograms of nutrient per hectare of UAA)
BLEU = Belgium-Luxembourg Economic Union
Source: Fertilizers Europe (Eurostat online data code: (aei_fm_manfert))
Main statistical findings


Fertilisers consumption
Figure 1 shows the estimated consumption of manufactured fertilisers in kilograms of nutrients (expressed as N, P and K) per hectare of utilised agricultural area (UAA) in the EU (excluding Malta) in 2009.
This consumption is estimated by Fertilizers Europe, the European federation of fertilizers manufacturers. The estimated consumption of nutrient is divided by the UAA to calculate the estimated consumption per hectare. The UAA data are the 2007 FSS values from Eurostat (online data codes:
(aei_ps_alt) and
(ef_lu_ovcropaa).
In 2009 the total estimated consumption of manufactured fertilisers in the EU (excluding Malta) averaged 76 kilograms of nutrients (N, P and K altogether) per hectare of UAA. Nitrogen accounted for the vast majority (78%) of the nutrients consumed in manufactured fertilizers, with an estimated consumption of 59 kg/ha on average in the EU that ranged from 19 kg/ha in Portugal to 125 kg/ha in the Netherlands. In contrast, the average estimated consumption for Phosphorus was 6 kg/ha (from 2 to 10 kg/ha) and 11 kg/ha for Potassium (from 2 to 33 kg/ha). The countries with the highest consumption of nutrients (from manufactured fertilizers) per hectare were the Netherlands, Belgium and Luxembourg, and Norway, followed by Germany. By contrast, Portugal and Romania were the countries with the lowest consumption of nutrients.
Besides the consumption estimated by the fertilisers industry, some European countries produce official statistics on the use of such mineral fertilisers. These data are presented in Figures 2 and 3 respectively showing the Average Annual Percent Change (AAPC) in the absolute quantities of Nitrogen and Phosphorus consumed between 2000 and 2008. (The AAPC is the arithmetic average of the eight individual annual percent changes.) Figure 2 shows that between 2000 and 2008 the Nitrogen fertiliser consumption increased in Latvia (by more than 10% each year), Lithuania, Czech Republic, Poland, Bulgaria, Slovakia, Romania, Austria, Hungary and Norway, whereas it remained stable in Sweden and decreased in Portugal, Netherlands, Slovenia, Ireland, United Kingdom, Luxembourg, Belgium, Spain, Denmark, Germany, France, Switzerland and Finland. Figure 3 shows that between 2000 and 2008 the Phosphorus fertiliser consumption increased in Bulgaria (more than 18% each year), Latvia (more than 13% each year), Poland, Hungary, Romania, Czech Republic, Slovakia, Switzerland and Austria, whereas it decreased in Denmark, Netherlands, Luxembourg, Belgium, Ireland, United Kingdom, Slovenia, France, Portugal, Finland, Germany, Sweden, Spain and Norway.

(kg of P per ha of agricultural land)
Source: Eurostat (aei_pr_gnb)
Gross Nutrient Balances
- Gross Nitrogen Balance
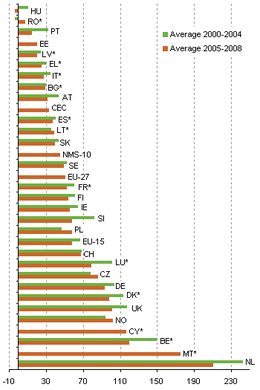 Figure 4: Gross Nitrogen Balance, 2000-2008
(kg of N per ha of agricultural land)
Source: Eurostat (aei_pr_gnb)

Between 2005 and 2008, the Gross Nitrogen Balance for the EU-27 remained relatively stable, with an estimated average of 50 kilograms of N per hectare of agricultural land, ranging from 210 kg/ha in the Netherlands to -4 kg/ha in Hungary.
In the EU-15 the Gross Nitrogen Balance fell from an estimated average of 66 kg/ha over the period 2000-2004 to an estimated average of 58 kg/ha over the period 2005-2008. In the ten Central and Eastern European (CEC) countries (Poland, Slovenia, Slovakia, Estonia, Lithuania, Latvia, Czech Republic, Hungary, Romania and Bulgaria) the Gross Nitrogen Balance was much lower than in the EU-15, with an estimated average of 33 kg/ha over the period 2005-2008.
The Nitrogen surplus scored the highest in the North-Western European countries (Belgium, Netherlands, Norway, United Kingdom, Germany, Denmark) and the Mediterranean islands Malta and Cyprus. By contrast the Mediterranean countries (Portugal, Italy, Spain, Greece) and many of the CEC countries had the lowest Nitrogen surpluses. Figure 4 shows the average Gross Nitrogen Balance per hectare of agricultural land (the total of arable land, land under permanent crops and permanent grassland) for the periods 2000-2004 and 2005-2008. Most countries reduced the Gross Nitrogen Balance per hectare in the period 2005-2008 compared to the period 2000-2004; the exceptions were Czech Republic, Poland, Romania and Norway. The average Gross Nitrogen Balance could not be estimated for the period 2000-2004 for Cyprus, Malta and Estonia due to lack of data.
- Gross Phosphorus Balance
Between 2005 and 2008, the Gross Phosphorus Balance for the EU-27 remained relatively stable, with an estimated average of 2 kilograms of P per hectare of agricultural land, ranging from 26 kg/ha in Malta to -11 kg/ha in Hungary.
In the EU-15 the Gross Phosphorus Balance fell from an estimated average of 5 kg/ha over the period 2000-2004 to an estimated average of 3 kg/ha over the period 2005-2008. In the ten Central and Eastern European (CEC) countries (Poland, Slovenia, Slovakia, Estonia, Lithuania, Latvia, Czech Republic, Hungary, Romania and Bulgaria) the Gross Phosphorus Balance was neutral, with an estimated average of 0 kg/ha over the period 2005-2008.
The Gross Phosphorus Balance was high in the Mediterranean islands Malta and Cyprus and Northwestern Europe (Norway, Netherlands, United Kingdom, Denmark) while the balance was negative for Italy, Greece and many CEC countries. Figure 5 shows the average Gross Phosphorus Balance per hectare of agricultural land (the total of arable land, land under permanent crops and permanent grassland) for the periods 2000-2004 and 2005-2008. The Gross Phosphorus Balance per hectare decreased in most countries in 2005-2008 compared to 2000-2004, exceptions were Norway, Poland and Romania. Data for Cyprus and Estonia were not available for 2000-2004.
Data sources and availability
Fertilisers consumption
- Industry estimate:
Dataset available at Consumption estimate of manufactured fertilizers (source: Fertilizers Europe)
Data on the estimated consumption of nutrients contained in manufactured fertilizers were provided by Fertilizers Europe, the European association of fertilizers manufacturers. A uniform methodology is applied to all countries included in the dataset. The methodology was developed as a forecasting exercise for the industry. It relies on the estimation of application rates by crop at national and sometimes even regional levels by experts (recruted in the fertilizers industry, agricultural institutes, etc.) and multiplied by the forecasted cropping areas. Then the forecasted consumption is reconciled with the quantities actually sold to constitute the time series presented in this article. The methodology includes a 2-year margin where estimated consumption can differ from actual sales to account for potential changes in stocks (when the product was sold but might not yet have been used). After the 2 years, the estimated consumption is fixed at the level of the actual sales.
Data are available annually over the period 1985-2009 for the following countries and aggregates: European Union (27 countries), European Union (15 countries), New Member States (12 countries), Bulgaria, Czech Republic, Denmark, Germany, Estonia, Ireland, Greece, Spain, France, Italy, Cyprus, Latvia, Lithuania, Hungary, Netherlands, Austria, Poland, Portugal, Romania, Slovenia, Slovakia, Finland, Sweden, United Kingdom, Belgo-Luxembourg Economic Union, Norway.
Data are broken down by nutrient type: Nitrogen (N), Phosphorus (P), Phosphate (P2O5), Potassium (K), Potash (K2O)
- Official Member States data:
Dataset available at Use of inorganic fertilizers
Data on the quantities of nutrients contained in fertilizers used at national level were generally provided by the National Statistical Institutes of the countries included in the dataset (for Luxembourg data were provided by the Ministry of Agriculture). These data were provided in the framework of the Joint Eurostat/OECD Questionnaire on Agri-Environmental Indicators and of the Eurostat/OECD Gross Nutrient Balances data collection exercise. At present no harmonised European statistics on mineral fertilizer use are officially available. Different data sources have been used to compile the dataset and therefore comparability is not very high. Some countries have carried out farmer surveys, others have estimated consumption from statistics on production and trade of mineral fertilizers.
Data are available annually over the period 1985-2009, on Nitrogen (N) and Phosphorus (P), for the following countries: Bulgaria, Belgium, Czech Republic, Denmark, Germany, Estonia, Ireland, Greece, Spain, France, Latvia, Luxembourg, Hungary, Netherlands, Austria, Poland, Portugal, Romania, Slovenia, Slovakia, Finland, Sweden, Norway and Switzerland.
Gross Nutrient Balances
Dataset available at Gross Nutrient Balance
Data were generally provided by the National Statistical Institutes in the framework of the Eurostat/OECD Nutrient Balances data collection exercise. For some countries, the Gross Nutrient Balances were estimated by Eurostat, and afterwards approved by the national authorities. Methodologies are described in the Eurostat/OECD Nitrogen Balance Handbook and the Eurostat/OECD Phosphorus Balance Handbook.
A Gross Nutrient Balance is calculated as the total nutrient input minus the total nutrient output to the soil. The Gross Nutrient Balance per hectare is derived by dividing the total Gross Nutrient Balance by the reference area. The reference area is the sum of arable land, permanent grassland and land under permanent crops. Data on these areas are available at Agricultural products - Land use
- Inputs of the Gross Nutrient Balance:
Fertilisers:
- Inorganic fertilisers
- Organic fertilisers (excluding manure)
Manure input:
- Manure production (animal excretion)
- Manure withdrawals (manure export, manure processed as industrial waste, non-agricultural use of manure, other withdrawals)
- Change in manure stocks
- Manure import
Other inputs:
- Seeds and planting material
- Atmospheric nutrient deposition
(Only for Nitrogen: - Biological fixation by leguminous crops (like Clover, Soya beans etc) and free living organisms)
- Outputs of the Gross Nutrient Balance:
- Harvest of crops (cereals, dried pulses, root crops, industrial crops, vegetables, fruit, ornamental plants, other harvested crops)
- Harvest and grazing of fodder (fodder from arable land, permanent and temporary pasture consumption)
- Crop residuals removed from the field
Nutrient inputs and outputs are estimated for each item of the balance by multiplying basic data (such as crop area, crop production, livestock numbers, etc) with coefficients to convert the data into nutrient contents.
Further information on the nutrient balances and fertilizers data are available in the articles on Gross Nitrogen Balance and Gross Phosphorus Balance.
Context
Political context
The complex relationship between agriculture and the environment has resulted in environmental concerns and safeguards being integrated within the EU’s common agricultural policy (CAP), with particular attention being paid to reducing the risks of environmental degradation through cross-compliance criteria (as a condition for benefiting from direct payments, farmers must comply with certain requirements, some related to environmental protection) and targeted agri-environmental measures, in order to enhance the sustainability of agro-ecosystems.
The importance attached to assessing the interaction between agriculture and the environment is underlined by a European Commission Communication COM(2006) 508 ‘Development of agri-environmental indicators for monitoring the integration of environmental concerns into the common agricultural policy’, containing a list of 28 Agri-Environmental Indicators (AEI). The AEI portray farming practices, agricultural production systems, pressures and risks to the environment, and the state of natural resources.
In order to limit the environmental damage associated with excess nutrient application, such as eutrophication, a number of legislative measures have been taken, such as the adoption of the Nitrates Directive and the Water Framework Directive, covering the designation of nitrate-vulnerable zones where Member States have imposed regulatory limits on the load and timing of the spreading of fertiliser (and manure) on agricultural land.
Agri-environmental context
Fertilisers contain important nutrients, such as Nitrogen (N), Phosphorus (P) and Potassium (K), which plants absorb from the soil for their growth. Fertilisers are therefore an essential input in agricultural production. In addition to livestock manure used as an organic fertiliser, most farms — with the exception of organic farms — also apply large amounts of mineral fertilisers manufactured by the fertiliser industry. When the amount of fertiliser applied exceeds the plants’ nutritional requirements, there is a greater risk of nutrient losses from agricultural soils into ground and surface water. The resulting higher concentration of nutrients (‘eutrophication’) can cause serious degradation of ecosystems.
In addition to the problems triggered by eutrophication, fertilisers also have adverse environmental effects resulting from their production processes. More specifically, nitrogenous fertilisers — the most commonly consumed fertilisers — require large amounts of energy and ultimately cause greenhouse gas emissions. In a completely different way, phosphorus and potash fertilisers also have an environmental impact, since the raw materials used to produce them are mined, therefore creating the damage typically associated with mining, e.g. landscape destruction, water contamination, excessive water consumption and air pollution.
However, in order to estimate the risk of nutrient loss, consumption of manufactured fertilisers should be combined with other nutrient inputs, such as application of manure and slurry, biological nitrogen fixation and atmospheric nutrient deposition, along with nutrient uptake by plants. In addition, the nutrient requirements (and hence consumption) of plants are influenced by previous land management, soil type and climatic factors, and they vary from one crop to another.
The Gross Nutrient Balance (GNB) provides an insight into the links between agricultural nutrient use, losses of nutrient to the environment, and the sustainable use of soil nutrient resources. A persistent surplus of nutrient indicates potential environmental problems, such as nutrient leaching (resulting in pollution of drinking water and eutrophication of surface waters), ammonia emissions (contributing to acidification, eutrophication and atmospheric particulate pollution), or emissions of nitrous oxide (a potent greenhouse gas). A persistent deficit in nutrient indicates the risk of a decline in soil fertility.
The GNB, i.e. the estimated nutrient surplus, can only indicate the total potential risk to the environment (air, water and soil), as the actual risk depends on many factors including climate conditions, soil type and soil characteristics, soil saturation, and management practices such as drainage, tillage, irrigation, etc. As the GNB roughly represents the difference between the nutrients applied to the soil and the nutrients removed with the crops, the GNB reflects the risk of the remaining nutrients either leaching into the soil and water or being released into the atmosphere.
Further Eurostat information
Publications
- Agricultural statistics: Main results - 2008-09
- Agricultural statistics: Main results - 2007-08
- Environmental statistics and accounts
- Farm data needed for agri-environmental reporting
- From farm to fork - Focus on sustainable agriculture and fisheries statistics - SIGMA - The Bulletin of European Statistics, 01/2010
Main tables
- Consumption estimate of manufactured fertilizers: Nitrogen (tonnes of N) (source: Fertilizers Europe) (tag00090)
- Consumption estimate of manufactured fertilizers: Phosphorus (tonnes of P) (source: Fertilizers Europe) (tag00091)
- Consumption estimate of manufactured fertilizers: Potassium (tonnes of K) (source: Fertilizers Europe) (tag00092)
Database
- Farm management (aei_fm): Consumption estimate of manufactured fertilizers (source: Fertilizers Europe) (aei_fm_manfert)
- Pressures and risks (aei_pr): Gross Nutrient Balance (aei_pr_gnb)
Dedicated section
Methodology / Metadata
- Gross Nutrient Balance (ESMS metadata file - aei_pr_gnb_esms)
Source data for figures (MS Excel)
See also
- Agricultural census
- Agri-environmental statistics
- Agri-environment indicators - essential tools to assess EU agricultural policy
- Cropping and livestock pattern statistics
- Farm structure
- Gross Nitrogen Balance
- Gross Phosphorus Balance