Minimum wage statistics
Data extracted in July 2024.
Planned article update: 30 January 2025.
Highlights
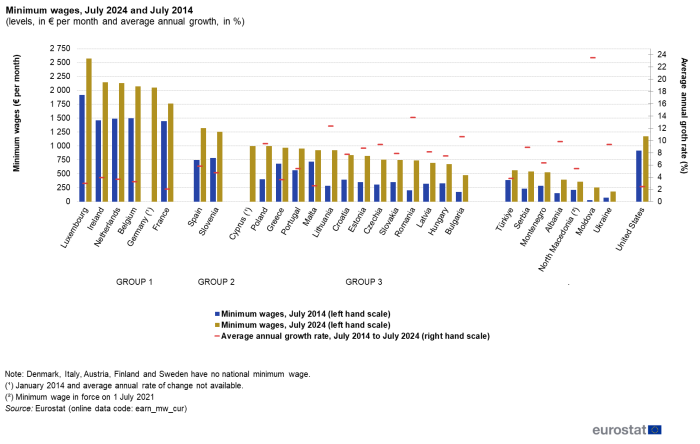
In July 2024 minimum wages in the EU countries ranged from €477 per month in Bulgaria to €2 571 per month in Luxembourg.

Source: Eurostat (earn_mw_cur)
This article illustrates how minimum wage levels vary across the European Union (EU) countries; it also provides a comparison with the situation in the candidate countries and the United States.
Full article
General overview
Minimum wage statistics, as published by Eurostat, refer to national minimum wages. The national minimum wage usually applies to all employees, or at least to a large majority of employees in a country. It is enforced by law, often after consultation with social partners, or directly by a national inter-sectoral agreement.
Minimum wages are generally presented as monthly wage rates for gross earnings, that is, before the deduction of income tax and social security contributions payable by the employee; these deductions vary from country to country.
National minimum wages are published by Eurostat bi-annually. They reflect the situation on 1 January and 1 July of each year. As a consequence, modifications to minimum wages introduced between these two dates are only shown for the following bi-annual release of data.
Variations in national minimum wages
Minimum wages in the EU countries range from €477 per month in Bulgaria to €2 571 per month in Luxembourg
On 1 July 2024, 22 out of the 27 EU countries had a national minimum wage (including Cyprus as of 1 January 2023). EU countries without a national minimum wage were: Denmark, Italy, Austria, Finland and Sweden. Monthly minimum wages vary widely across the Member States, from €477 in Bulgaria to €2 571 in Luxembourg (see Figure 1).
Among 10 candidate and potential candidate countries, 7 had a national minimum wage (Montenegro, Moldova, North Macedonia, Albania, Serbia, Türkiye und Ukraine), while Bosnia and Herzegovina, Georgia and Kosovo did not have a national minimum wage.

Source: Eurostat (earn_mw_cur)
Based on the level of their national gross monthly minimum wages applicable on 1 July 2024, expressed in euro (€), the EU countries concerned may be classified into 3 different groups; (see Figure 1, non-EU countries are shown separately).
- Group 1, with a national minimum wage above €1 500 per month. This group includes: Luxembourg, Ireland, the Netherlands, Belgium, Germany and France. Their national minimum wages ranged from €1 767 in France to €2 571 in Luxembourg.
- Group 2, with a national minimum wage above €1 000 and below € 1 500 per month. This group includes: Spain and Slovenia. Their national minimum wages were €1 254 in Slovenia and €1 323 in Spain.
- Group 3, with a national minimum wage equal or below €1 000 per month. This group includes: Cyprus, Poland, Greece, Portugal, Malta, Lithuania, Croatia, Estonia, Czechia, Slovakia, Romania, Latvia, Hungary and Bulgaria. Their national minimum wages ranged from €477 in Bulgaria to €1 000 in Cyprus.
All candidate and potential candidate countries with a national minimum wage, for which data are available, would belong to group 3, with minimum wage levels ranging from €185 in Ukraine to €568 in Türkiye.
The United States would fall within group 2 (€1 137 per month, at federal level).
The average annual growth rate between July 2014 and July 2024 was highest in Romania (+13.7%) followed by Lithuania (+12.3%), Bulgaria (+10.6%), Poland (+9.5%) and Czechia (+9.3%) . The lowest average annual growth rates among EU countries were recorded in France (+2.0%), Malta (+2.6%) and Luxembourg (+3.0%).
Note: for countries whose national currency is not the euro: Bulgaria, Czechia, Hungary, Poland and Romania, candidate and potential candidate countries except Montenegro[1] as well as the United States, the minimum wage has been converted to euro using the exchange rate in force at the end of June 2024.
Croatia adopted the euro as the national currency as of 1 January 2023.
Minimum wages expressed in purchasing power standards
Disparities in minimum wages are considerably smaller after adjusting for differences in price levels
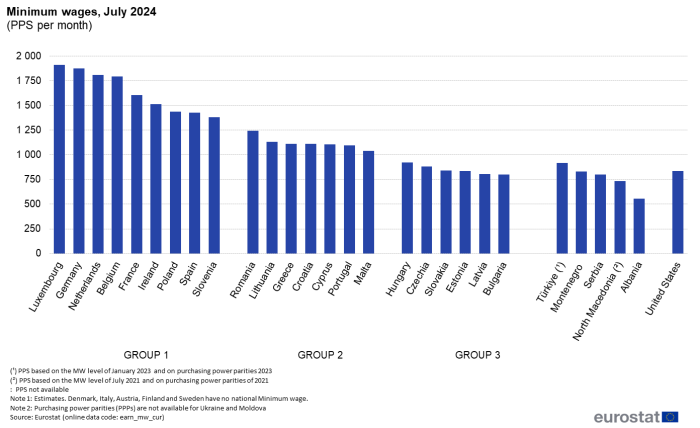
Figure 2 compares gross minimum wages applicable on 1 July 2024, after adjusting them to price differences across countries. This is done by using purchasing power parities (PPPs) for household final consumption expenditure. As might be expected, this adjustment reduces differences across countries. In PPS terms, EU countries with a national minimum wage may be classified into three groups, as was the case for the values expressed in euro, but with a different composition (see Figure 2, non-EU countries are shown separately).
- Group 1, with a national minimum wage above PPS 1 250. This group includes: Luxembourg, Germany, the Netherlands, Belgium, France, Ireland, Poland, Spain and Slovenia. Their national minimum wages ranged from PPS 1 379 in Slovenia to PPS 1 912 in Luxembourg.
- Group 2, with a national minimum wage between PPS 1 000 and below PPS 1 250. This group includes: Romania, Lithuania, Greece, Croatia, Cyprus, Portugal and Malta. Their national minimum wages ranged from PPS 1 037 in Malta to PPS 1 243 in Romania.
- Group 3, with a national minimum wage below PPS 1 000. This group includes: Hungary, Czechia, Slovakia, Estonia, Latvia and Bulgaria. Their national minimum wages ranged from PPS 799 in Bulgaria to PPS 922 in Hungary.
All candidate and potential candidate countries with a national minimum wage, for which data are available, would belong to group 3, with minimum wage levels ranging from PPS 556 in Albania to PPS 919 in Türkiye[2]. The United States (PPS 837) would also fall within group 3.
On 1 July 2024, the highest minimum wage in euro (in Luxembourg) was 5.4 times the lowest one (in Bulgaria). When expressed in PPS, the highest (in Luxembourg) was 2.4 times the lowest (in Bulgaria).
Minimum wage levels in relation to median gross earnings
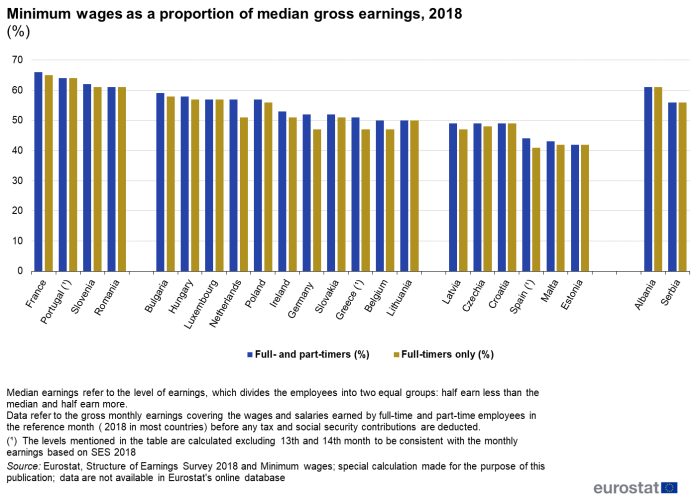
Figure 3 provides information on national minimum wages in proportion to median gross earnings, calculated with and without part-time employees. Data are published for reference year 2018, the last year for which earnings data are available, based on the Structure of Earning Survey (SES 2018).
National minimum wages expressed in euro, applicable on 1 July 2018, were divided by the median gross earnings measured from the Structure of Earning Survey (SES 2018). Within the EU, the resulting ratio ranged from 42% (in Estonia) to 66% (in France), part-time employees included.
In 2018, minimum wages represented over 60% of the median gross earnings in only 4 EU countries: France ( 66%), Portugal ( 64%), Slovenia (62%) and Romania (61%). The minimum wages ranged between 50% and 60% of the median gross earnings in 11 EU countries: Bulgaria (59%), Hungary (58%), Luxembourg, the Netherlands and Poland (all 57%), Ireland (53%), Germany and Slovakia (both 52%), Greece (51%), followed by Belgium and Lithuania (both 50%). In 6 EU countries: Czechia, Croatia and Latvia (all 49%), Spain (44%), Malta (43%) and Estonia (42%), the minimum wages were less than half of the median earnings.

(%)
Source: Eurostat (earn_mw_cur) and Structure of Earnings Survey 2018; special calculation made for the purpose of this publication; these special calculations are not available in Eurostat's online database.
Note: For the purpose of this analysis, payments for overtime and shift work have been excluded from the calculation of median gross earnings. In the case of Germany, France and Ireland, whose minimum wages are set on an hourly basis, the ratio was calculated as a proportion of the median hourly earnings. For the other 18 EU countries that have a national monthly minimum wage and for which data are available, the ratio was calculated as a proportion of the median monthly earnings.
Median earnings were calculated with and without part-time workers (see Figure 3). When part-time workers are included in the calculation, their earnings are first converted into full-time equivalents. Including part-time workers had the largest impact on the minimum wage to median earnings ratios of: the Netherlands (+6%), Germany (+5%) and Greece (+4%).
Proportion of minimum wage earners
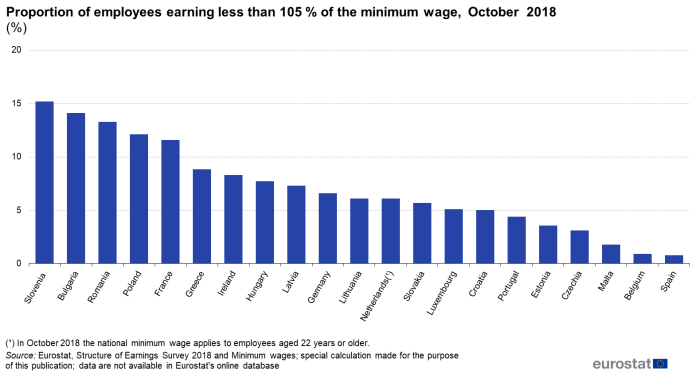
The proportion of employees earning the minimum wage can vary considerably across countries. By linking microdata from the Structure of Earnings Survey (SES2018) with the level of minimum wages in force at the time (reference date: 1 July 2018), it is possible to derive an estimate of these proportions (as presented in Figure 4). For the sake of comparability, the scope has been restricted to full timers and part-timers — converted into full time units), aged 21 years and over, working in enterprises with 10 employees and more, excluding public administration, defense and compulsory social security (NACE Rev. 2 Section O). Moreover, monthly earnings calculated from the SES 2018 exclude any earnings related to overtime and shift work.
In 2018, the proportion of employees being paid less[3] than 105% of the national minimum wage was above 10% in 5 EU countries with a minimum wage, namely: Slovenia (15.2%), Bulgaria (14.1%), Romania (13.3%), Poland (12.1%), and France (11.6%). The lowest proportion of employees earning less than 105% of the national minimum wage were recorded in Spain (0.8%), Belgium (0.9%) and Malta (1.8%).

Source: Eurostat (earn_mw_cur) and Structure of Earnings Survey 2018; special calculation made for the purpose of this publication; these special calculations are not available in Eurostat's online database
Source data for tables and graphs
Data sources
Monthly national minimum wages
Minimum wage statistics published by Eurostat refer to monthly national minimum wages. Data are published in relation to the minimum wages applied on 1 January and 1 July each year. The basic national minimum wage is fixed at an hourly, weekly or monthly rate, and this minimum wage is enforced by law (the government), often after consultation with social partners, or directly by a national intersectoral agreement.
The national minimum wage usually applies to all employees, or at least to a large majority of employees in the country; the information is reported in gross terms. A complete set of country-specific information on national minimum wages is available in an annex as part of the metadata.
For those countries where the national minimum wage is not fixed in gross terms, the net value is grossed up to cover the applicable taxes; this is the case for Montenegro and for Serbia.
For those countries where the national minimum wage is not fixed at a monthly rate (for example, where minimum wages are specified on an hourly or weekly basis) the level of the minimum wage is converted into a monthly rate according to conversion factors supplied by the countries concerned:
Germany: data from January 2024 onwards [(hourly rate x 38.1 hours per week) * 4.345]; the value of 38.1 hours relates to mean basic hours per week for full time employees in NACE Rev.2 sections B to S: this value is a result of quarterly earnings survey;
Ireland: (hourly rate x 39 hours x 52 weeks) / 12 months;
France: data from July 2005 onwards (hourly rate x 35 hours x 52 weeks) / 12 months;
The Netherlands: data from January 2024 onwards (hourly rate x 36 hours x 52 weeks) / 12 months;
Malta: (weekly rate x 52 weeks) / 12 months;
United States: (hourly rate x 40 hours x 52 weeks) / 12 months.
In Serbia, the national minimum wage is determined in net hourly terms. The following conversion is applied: (hourly net rate x 40 hours x 52.2 weeks) / 12 months. This value is then grossed up to cover applicable taxes.
In addition, when the minimum wage is paid for more than 12 months per year (as in Greece, Spain and Portugal, where it is paid for 14 months a year), data have been adjusted to take these payments into account.
Data on national minimum wages are submitted to Eurostat in national currency terms. For the non-euro area countries, minimum wages in national currencies are converted into euro by applying the exchange rate as recorded at the end of the previous month (for example, the rate at the end of December 2023 was used for calculating minimum wages in euro terms as of 1 January 2024).
To remove the effect of differences in price levels between the countries, special conversion rates called purchasing power parities (PPPs) are used. PPPs for household final consumption expenditure in each country are used to convert the monthly minimum wages expressed in euro or national currencies to an artificial common unit called the purchasing power standard (PPS). If PPPs for the latest reference period are not yet available, they are replaced by the PPP of the previous year, and the series are updated once the latest PPPs are available.
Countries not covered by minimum wage statistics
As of 1 June 2024, there was no national minimum wage in Denmark, Italy, Austria, Finland and Sweden. This was also the case in the EFTA countries of Iceland, Norway and Switzerland. The minimum wage was introduced in Cyprus as of 1 January 2023. In Denmark, Italy, Austria , Finland and Sweden, as well as in Iceland, Norway and Switzerland, minimum wage are laid down by collective agreements for a range of specific sectors.
Median gross monthly earnings
Data on median gross monthly earnings are based on the latest data collected from the structure of earnings survey (SES) in 2018 (this survey is conducted once every four years). Data on median gross monthly earnings refer to all employees (excluding apprentices) working in enterprises with 10 employees or more and which operate in all sectors of the economy except agriculture, forestry and fishing (NACE Rev. 2 section A) and public administration and defence; compulsory social security (NACE Rev. 2 section O). Median earnings is the level of earnings which divides all employees into two equal groups: half earn less than the median and half earn more. Gross monthly earnings refer to the wages and salaries earned by full-time and part-time employees in the reference month (2018) before any tax and social security contributions are deducted. Monthly earnings calculated from the SES 2018 exclude any earnings related to overtime payments, shift premiums, allowances, bonuses, commission, etc. The gross monthly earnings were calculated for full-time employees with part-time employees and with full-time employees only. The gross monthly earnings of part-time employees have been converted into full-time units before being included in the average with the same weight as full time employees. Average exchange rates for 2018 were used to convert data for non-euro area countries into euro. The country-specific activity coverage for national minimum wages as a proportion of average monthly earnings is available in an annex that forms part of the metadata.
Context
In November 2017, the European Parliament, the Council and the Commission proclaimed the European Pillar of Social Rights (hereafter the Pillar) to deliver on Europe’s promise of prosperity, progress and convergence, and make social Europe a reality for all. Principle 6 of the Pillar on ‘Wages’ calls for adequate minimum wages as well as for transparent and predictable wage setting to be put in place, according to national practices and respecting the autonomy of the social partners. The Strategic Agenda for 2019-2024, agreed at the European Council in June 2019, called on the implementation of the Pillar at EU and national level.
On 19 October 2022, the European Parliament and the Council adopted Directive (EU) 2022/2041 on adequate minimum wages in the European Union [1]. It aims to improve working and living conditions in the European Union (EU) by establishing a framework for adequacy of statutory minimum wages; promoting collective bargaining on wage-setting; enhancing the effective access of workers to their rights to minimum wage protection under national legislation and/or collective agreements.
*This designation is without prejudice to positions on status, and is in line with UNSCR 1244/1999 and the ICJ Opinion on the Kosovo Declaration of Independence.
Direct access to
- Earnings, see:
- Minimum wages (tps00155)
- Earnings, see:
- Minimum wages (earn_minw)
- Monthly minimum wages - bi-annual data (earn_mw_cur)
- Monthly minimum wage as a proportion of average monthly earnings (%) — NACE Rev. 2 (from 2008 onwards) (earn_mw_avgr2)
- Monthly minimum wage as a proportion of average monthly earnings (%) — NACE Rev. 1.1 (1999-2009) (earn_mw_avgr1)
- Minimum wages (earn_minw)
- Minimum wages (ESMS metadata file — earn_minw_esms)
- ↑ Montenegro has unilaterally adopted the euro as the national currency
- ↑ PPS based on MW level of January 2023 and on purchasing power parities 2023
- ↑ This proportion is derived from the monthly earnings collected through the Structure of Earnings Survey (SES 2018) whereas the monthly minimum wage is calculated based on a standard number of hours worked per month. For this reason, the threshold used to estimate the proportion of minimum wage earners includes a 5% mark-up.
