International trade in goods by invoicing currency
Data extracted in June 2024
Planned article update: no update planned
Highlights
In 2023, more than half of all goods imported into the EU were invoiced in US dollars.
In 2023, more than half of all EU exports were invoiced in euros.
Globalisation patterns in EU trade and investment is an online Eurostat publication presenting a summary of recent European Union (EU) statistics on economic aspects of globalisation, focusing on patterns of EU trade and investment.
Economic theory suggests those currencies that are 'liquid' (in other words, the ones which have the highest volume of trade) have low transaction costs and are therefore more likely to be chosen as a preferred (and efficient) means for exchanging goods. Choices over invoicing currencies have the potential to impact a country's trade balance as a result of exchange rate movements. Note that the start of Globalisation patterns in EU trade and investment (chapter 1) provides further information on the development of global commodity prices and exchange rate fluctuations.
Full article
General overview
In a globalised world, there are a number of factors that may determine the invoicing currency that is used in any trade transaction. The choice may reflect particular standards within specific sectors, for example, the price of oil and petroleum products is almost always denominated in US dollar terms, or alternatively it could be related to historical trading relationships between a pair of countries. From an enterprise perspective, the choice is not neutral insofar as traders are exposed to exchange rate risks; indeed, both sides of the trading relationship are usually affected by opposing risks. Importers usually want to limit the share of foreign currency invoicing in order to reduce their risk, whereas an exporter may wish to unilaterally determine the currency of payment so as to maximise export earnings. Some exporters with particularly large export markets prefer to limit the price volatility of their goods abroad by opting to use the invoicing currency of their trading partner; in so doing they have greater control over the price of their goods relative to competitors in the foreign market.
When enterprises are forced to invoice in a foreign currency they may try to reduce their risk through the use of different financial products, for example, trading credits or hedging instruments; these facilities tend to be more widely available for large enterprises. It may be particularly important to hedge against exchange rate movements in those industries characterised by lengthy production chains (for example, the manufacture of a ship or an aircraft) or in those cases where a large volume of trade is conducted on futures markets. As such, within the context of globalisation, large multinational enterprises may have a greater opportunity to benefit from the flexibility of managing their exchange rate exposure through transfer pricing and operational hedging.
More than half of all goods imported into the EU were invoiced in US dollars
In 2023, more than half of all goods imported into the EU were invoiced in US dollars
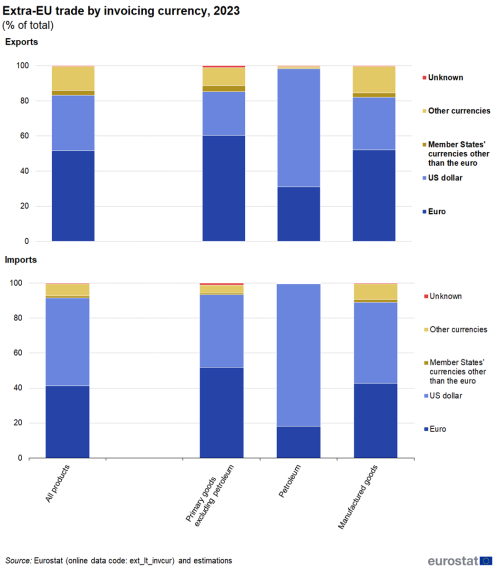
In 2023, 50.3 % of the goods originating from non-member countries that were imported into the EU were invoiced in US dollars, while 41.2 % were invoiced in euros.
As noted above, some primary products that are widely traded on global markets tend to be invoiced exclusively in a single currency, the most well-known examples being the price of oil or gold. Given that the EU imports large quantities of crude oil, it is perhaps unsurprising to find that 81.5 % of the EU's imports of petroleum, petroleum products and related materials were invoiced in US dollars, compared with just 18.0 % in euro terms. By contrast, for primary goods other than petroleum, the share of imports invoiced in euro (51.9 %) was much higher than in US dollars (41.5 %).
The picture was reversed for exports, as half (51.6 %) of goods that left the EU that were destined for non-member countries were invoiced in euros, while just under one-third (31.6 %) were invoiced in US dollars (see Figure 1). The share of EU exported goods denominated in euro terms was higher than the share of imports denominated in euro terms for all three types of goods shown. The euro was the preferred currency for exporters of primary goods excluding petroleum (60.4 % of the EU's exports were denominated in euros) and manufactured goods (52.2 %). However exports of petroleum, petroleum products and related materials were mostly invoiced in US dollars (67.3 %).
The euro was the most used currency for extra-EU exports
In 2023, the euro was the most used currency for extra-EU exports in 19 of the EU Member States …
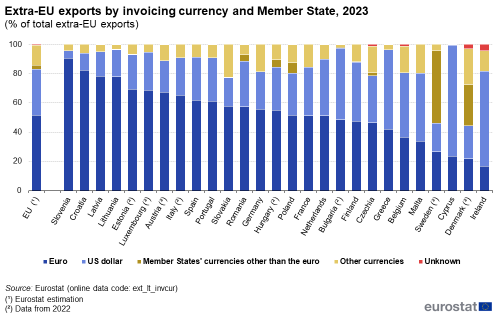
Figure 2 presents similar information for the individual EU Member States, focusing on the share of extra-EU exports by invoicing currency. In 2023, a majority of the Member States (19 out of 27) invoiced the highest share of their exports to non-member countries in euro terms. The largest shares were recorded in Slovenia (90.5 %), Croatia (82.2 %), Latvia (78.2 %) and Lithuania (78.0 %). In five countries the US dollar was the most used currency for exports. These were Cyprus (76.0 %), Ireland (64.9 %), Greece (54.4 %), Malta (46.5 %) and Belgium (44.1 %). In Sweden (49.7 %) and Denmark (27.9 %), EU currencies other than the euro had the highest share primarily due to high shares for their national currency.
… while the US dollar was the most used currency for extra-EU imports in 16 of the EU Member States.
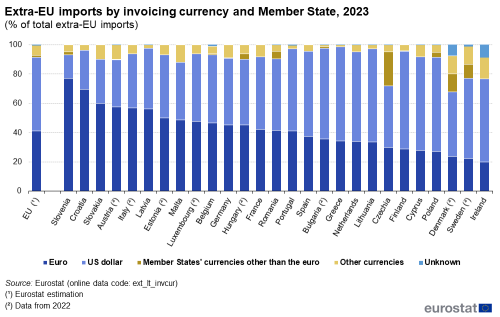
In 2023, the US dollar was the predominant invoicing currency among EU Member States concerning extra-EU imports (see Figure 3): in 16 of the 27 EU Member States, the US dollar was the most popular invoicing currency. The highest share was recorded in Finland (66.9 %).
Of the 11 EU Member States where the euro was the most popular currency for invoicing extra-EU goods that were imported in 2023 the highest share was recorded in Slovenia (77.0 %), followed by Croatia (69.6 %) and Slovakia (60.1 %). At the other end of the range, euro invoicing accounted for less than a quarter of all goods imported from non-member countries into Denmark (23.6 %), Sweden (22.2 %) and Ireland (19.8 %).
Source data for tables and graphs
Direct access to


