Foreign-born people and their descendants - educational attainment level and skills in host country language
Data extracted in June 2024 (part on educational attainment). No update of the part on language skills.
Planned article update: June 2025 (part on educational attainment); no update planned for the part on language skills.
Highlights
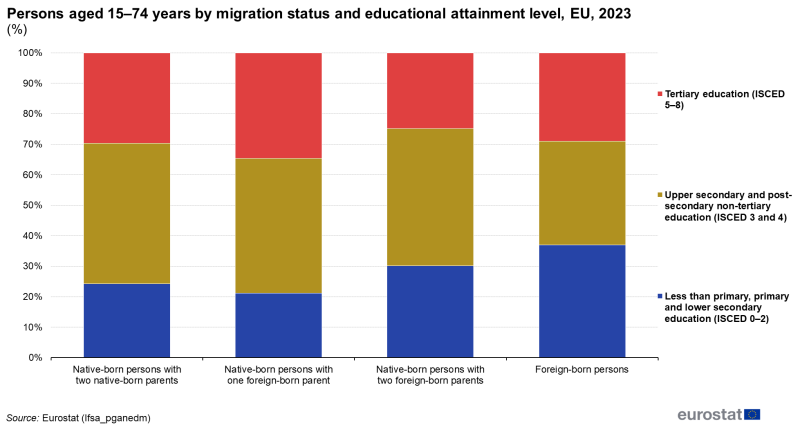
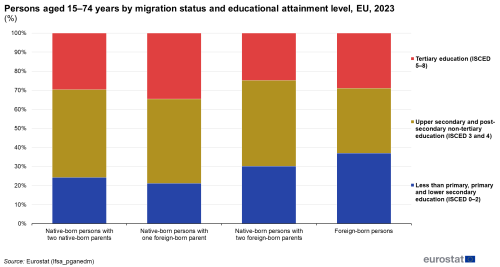
In 2023, the share of foreign-born people with a low education level was higher (37.0 %) compared to native-born people (24.3 %). Notably, native-born people with one foreign-born parent had the highest education level (34.6 %).
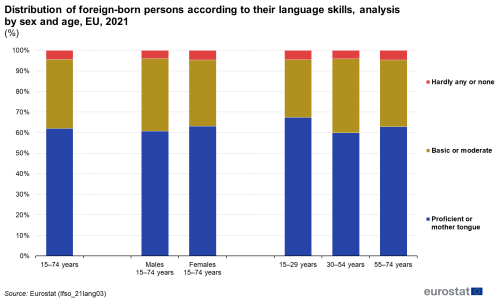
In 2021, 61.9 % of foreign-born people in the EU reported that their host country’s language was either their mother tongue or they were proficient in it, while a third (33.7 %) had a basic or moderate skill level and 4.4 % had no or hardly any skills in that language.
(%)
Source: Eurostat (lfsa_pganedm)
This article is one of a set of statistical articles concerning foreign-born people and their immediate descendants in the EU. This article forms part of the online publication Foreign-born people and their descendants. It presents statistics on two subjects: educational attainment and skills in relation to their host country’s language. These statistics help to inform how people with various migration status compare in terms of skills that become increasingly important, both in the labour market and for individuals as well as society in general.
Full article
Overview
The EU Labour Force Survey is the source of data for this article and these data relate to the population usually residing in private households in the European Union (EU). The focus is on people aged 15–74 years.
People living in private households can be categorised based on their place of birth into foreign-born and native-born. To better understand the status of native-born people, the birthplace of their parents is also considered. The categories of migration status are as follows:
- native-born with two native-born parents,
- native-born descendants of at least one foreign-born parent,
- native-born descendants of one foreign-born parent,
- native-born descendants of two foreign-born parents,
- foreign-born people.
An article on the main characteristics of people by migration status (based on the EU-LFS data) provides information on the relative size of these categories.
(%)
Source: Eurostat (lfsa_pganedm)
When analysed by country of birth, two main differences can be seen in the structure of the EU’s population in 2023 in terms of educational attainment.
- For native-born people with one foreign-born parent, the share who had a tertiary educational attainment was notably higher than for the other categories of migration status.
- For foreign-born people, the share who had, at most, lower secondary educational attainment was clearly larger than for any of the three native-born categories.
(%)
Source: Eurostat (lfso_21lang03)
This article also presents information on foreign-born people according to level of current skills in the main host country language.
- More than 60 % of foreign-born people in the EU reported, in 2021, that either they were proficient in their host country’s language or it was their mother tongue. In addition, 33.7 % had a basic or moderate skill level. The share reporting that they had no or hardly any skills in the host country’s language was 4.4 %.
- Females in the EU were more likely than males to have mother tongue or proficient skills in their host country’s language but were also more likely to have no or hardly any skills in this language. An analysis by age shows a similar situation, with younger (aged 15–29 years) and older people (aged 55–74 years) more likely than those aged 30–54 years to have mother tongue or proficient skills and also more likely to have no or hardly any skills in the host country’s language.
- Younger people (aged 15–29 years) had the highest share of foreign-born people whose mother tongue was that of the host country and the lowest share with moderate or basic skills of the host country’s language. The combined share of mother tongue or proficient for younger people was 67.3 %. By comparison, this combined share was 59.9 % for people aged 30–54 years and 62.9 % for older people (aged 55–74 years).
- Comparing people aged 30–54 years and older people, the largest difference (in percentage point terms) was that for the share of foreign-born people with only basic and moderate host country language skills, which was 3.5 percentage points higher for those aged 30–54 years.
Educational attainment
An analysis of educational attainment is based on the highest level of education that a person has successfully completed.
Educational levels are defined and classified in the international standard classification of education (ISCED). The levels of educational attainment used in this article are based on ISCED 2011.
- less than primary, primary or lower secondary level of education (ISCED 2011 levels 0–2);
- upper secondary or post-secondary non-tertiary education (ISCED 2011 levels 3 and 4);
- tertiary education (ISCED 2011 levels 5–8).
(%)
Source: Eurostat (lfsa_pganedm)
As already noted in the introduction, when analysed by migration status, two main differences can be seen in the structure of the EU’s population in terms of educational attainment in 2023.
- For native-born people with one foreign-born parent, the share who had a tertiary educational attainment level (34.6 %) was notably higher compared to the three other category of migration status (24.9–29.6 %).
- For foreign-born people, the share who had, at most, lower secondary educational attainment level (37.0 %) was clearly larger than for any of the three native-born migration status (21.1–30.2 %).
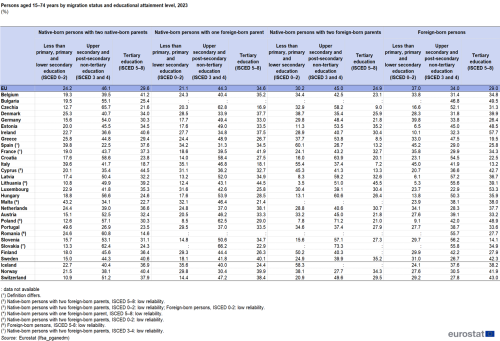
Among the EU countries, with complete and reliable data, the share of people who had tertiary educational attainment varied greatly according to migration status. In 2023, the highest share of tertiary education attainment was observed in Ireland (57.7 %) and in Luxembourg (53.3 %), both for foreign-born people. The lowest share was recorded in Italy, where only 7.2 % of native-born people with two foreign-born parents attained tertiary education.
The highest share of upper secondary or post-secondary non-tertiary education was observed in Poland (71.2 %) for native-born people with two foreign-born parents. The lowest share was recorded in Spain, where only 22.5 % of native-born people with two native-born parents attained upper secondary or post-secondary non-tertiary education.
Lastly, the highest share of people with, at most, a lower secondary level of education was observed in Spain (60.1 %) for native-born people with two foreign-born parents. The lowest share was recorded in Latvia, where only 6.1 % of foreign-born people had a less than primary, primary or lower secondary level of education.
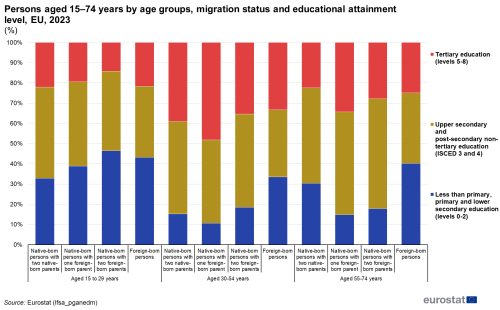
This analysis is extended by including a breakdown by age in Figure 3 that shows – for all four categories of migration status – the difference in the share of each educational attainment.
(%)
Source: Eurostat (lfsa_pganedm)
For people aged 15–29 years, a fairly clear pattern can be observed. Native-born people with two native-born parents (22.0 %) and foreign-born people (21.7 %) had higher shares of people with tertiary education while native-born people with one foreign-born parent (19.4 %) and native-born people with two foreign-born parents (14.2 %) the lowest. Native-born people with two native-born parents are also the group with the highest share of upper secondary or post-secondary non-tertiary education (45.2 %) while native-born people with two foreign-born parents had the highest share of people with, at most, lower secondary attainment of education (46.4 %).
For people aged 30–54 years, native-born people with one foreign-born parent had higher shares of people with tertiary education (48.2 %) while foreign-born people (33.2 %) the lowest. Native-born people with two foreign-born parents are the group with the highest share of upper secondary or post-secondary non-tertiary education (46.2 %) while foreign-born had the highest share of people with, at most, lower secondary attainment of education (33.5 %).
Finally, for people aged 55–74 years, native-born people with one foreign-born parent had the highest share of people with tertiary education (34.3 %) while native-born people with two native-born parents had the lowest (22.4 %). Native-born people with two foreign-born parents are the group with the highest share of upper secondary or post-secondary non-tertiary education (54.4 %) while foreign-born had the highest share of people with, at most, lower secondary attainment of education (40.2 %).
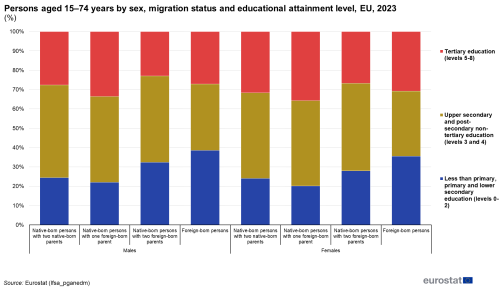
A similar analysis is presented in Figure 4, with the focus on an analysis by sex rather than by age.
(%)
Source: Eurostat (lfsa_pganedm)
The educational attainment structures of the various migration status were similar for males and females. For both sexes, native-born people with one foreign-born parent had the highest shares of people with tertiary education (35.7 % for females and 33.6 % for males) while native-born people with two foreign-born parents had the lowest (26.8 % for females and 23.0 % for males). For both sexes and regardless of place of birth, the native-born had similar values for upper secondary or post-secondary non-tertiary education, ranging from 44.1 % to 47.9 %. In contrast, the foreign-born population had lower values, with 33.7 % for females and 34.3 % for males. Foreign-born individuals are also the group with the highest share of people with, at most, lower secondary education (35.5 % for females and 38.6 % for males).
Host country language skills
This section focuses exclusively on foreign-born people, presenting information concerning their skill level in the language of their host country. Five language skill levels are identified.
- Mother tongue
- Proficient
- Moderate
- Basic
- Hardly any or none
These five levels are used in Figure 6. An aggregated classification regrouping these five levels into three levels is used in Figures 5, 7, 8 and 9 as well as Table 2.
Data shown in this section come from the module of the Labour Force Survey (EU-LFS) on the labour market situation of migrants and their immediate descendants held in 2021. The age group focused on in this article is 15-74 years, which is the reference age of the module.
(%)
Source: Eurostat (lfso_21lang02)
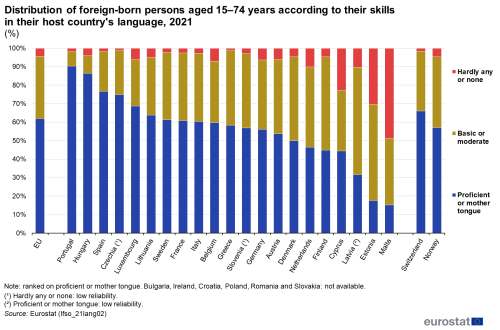
As already noted in the introduction, more than three fifths (61.9 %) of foreign-born people in the EU reported in 2021 that their host country’s language was either their mother tongue or they were proficient in it. In addition, 33.7 % had a basic or moderate skill level. The share reporting that they had no or hardly any skills in the host country’s language was 4.4 %.
Among the 18 EU countries for which data are complete and reliable (see Figure 5), the share of foreign-born people who reported that their host country’s language was either their mother tongue or they were proficient in was highest in 2021 in Portugal (90.4 %). Hungary (86.3 %) also recorded a particularly high share. The lowest shares, by far, were observed in Estonia (17.6 %) and Malta (15.2 %).
The share of foreign-born people with hardly any or no skills in their host country’s language was the highest for Malta (48.8 %), Estonia (30.4 %), Cyprus (22.7 %), Latvia and the Netherlands (both 10.2 %). Elsewhere the shares were at most 6.9 %.
(%)
Source: Eurostat (lfso_21lang02)
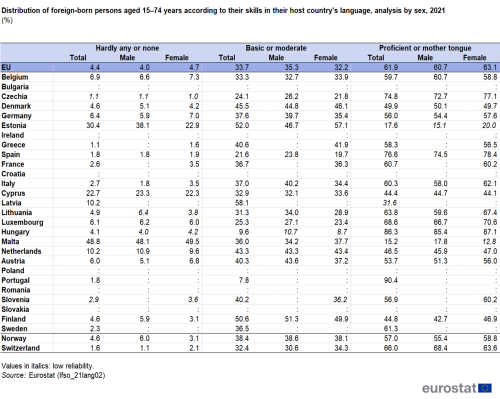
Foreign-born females in the EU were more likely than males to have mother tongue or proficient skills in their host country’s language in 2021. This situation was also observed in 11 of the 15 EU countries for which data are available. The largest gap with a higher share for females (the difference of 7.7 percentage points) was observed in Lithuania.
Equally, foreign-born females in the EU were more likely than males to have no or hardly any skills in their host country’s language in 2021. Among the 15 EU countries for which data are available, there was no clear pattern: seven had a higher share of no or hardly any skills in their host country’s language for females and seven a higher share for males; in Czechia, the shares were the same. The largest gender gap, by far, was in Estonia, where 38.1 % of foreign-born males had hardly any or no skills in their host country’s language compared with 22.9 % for females.
(%)
Source: Eurostat (lfso_21lang03)
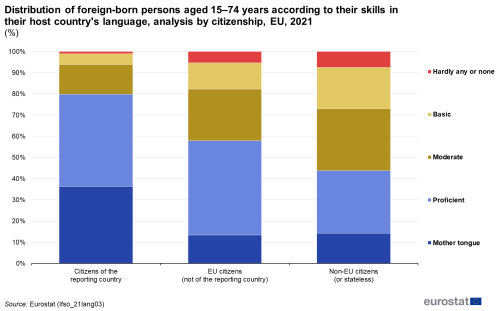
When analysed by citizenship, a clear distinction of host country language skills can be identified for foreign-born people in the EU in 2021.
- Citizens of the host (reporting) country had the highest share of foreign-born people whose mother tongue was that of the host country and the lowest shares with moderate, basic, or hardly any or no skills of the host country’s language. The combined share of mother tongue or proficient for citizens of the host country was 79.9 %. By comparison, this combined share was 57.9 % for citizens of other EU countries (not the host country) and 43.8 % for non-EU citizens.
- Comparing citizens of other EU countries and non-EU citizens, the former had a slightly smaller share of people whose mother tongue was that of the host country, a much larger share who were proficient, and smaller shares for the remaining language skill levels.
(%)
Source: Eurostat (lfso_21lang03)
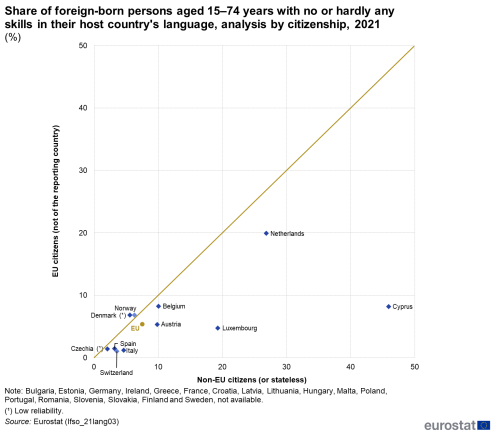
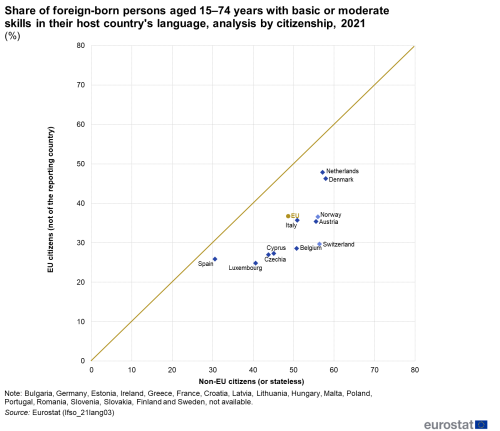
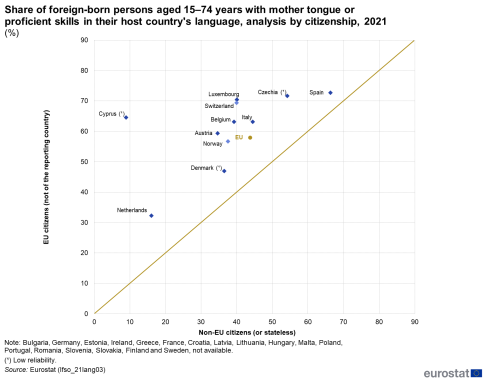
Figures 7–9 look in turn at each of the three aggregated language skill levels (no or hardly any language skills; basic or moderate language skills; mother tongue or proficient language skills). They each present information for foreign-born citizens (aged 15–74 years), comparing the shares for citizens of other EU countries and non-EU citizens.
Figure 7 shows the share in 2021 of foreign-born people with hardly any or no skills in the host country’s language; the reliable data are available for the EU, seven EU countries, Norway and Switzerland. For citizens of other EU countries, this share was highest in the Netherlands (19.9 %). For non-EU citizens, the highest shares were in Cyprus (45.9 %), the Netherlands (26.8 %) and Luxembourg (19.3 %). The largest gaps between the two categories of citizenship were observed in Cyprus and Luxembourg.
(%)
Source: Eurostat (lfso_21lang03)
Concerning the share of foreign-born people with basic or moderate skills in their host country’s language (as shown in Figure 8), the reliable data for 2021 are available for the EU, nine EU countries, Norway and Switzerland. In the EU and all of these countries, a lower proportion of citizens of other countries had basic or moderate skills than did non-EU citizens. Among the countries, the largest gaps based on citizenship were observed in Belgium and Austria, while a larger gap was observed in Switzerland.
(%)
Source: Eurostat (lfso_21lang03)
Unsurprisingly, Figure 9 broadly shows a mirror image of Figure 8: all of the six EU countries for which 2021 reliable data are available for the share of foreign-born people with mother tongue or proficient skills in the host country’s language recorded higher shares for other EU citizens than for non-EU citizens. These shares were most balanced in Spain, where there was nevertheless a 6.4 percentage point difference. The largest gap based on citizenship was observed in Luxembourg, where the difference between the two shares – with higher shares for other EU citizens than for non-EU citizens – was 30.3 percentage points.
For citizens of other EU countries, the shares of foreign-born people with mother tongue or proficient skills in the host country’s language were highest in 2021 in Spain (72.7 %). The lowest share was in the Netherlands (32.2 %).
For non-EU citizens, the share of foreign-born people with mother tongue or proficient skills in the host country’s language in 2021 was also highest in Spain (66.3 %). The lowest share was in the Netherlands (16.0 %).
Source data for tables and graphs
Data sources
The data presented in this article are from the labour force survey (LFS), the largest household sample survey in the EU. The survey covers the resident population, defined as all people usually residing in private households. As such, people living in collective households are excluded from the target population. Usual residence means the place where a person normally spends the daily period of rest, regardless of temporary absences for purposes of recreation, holidays, visits to friends and relatives, business, medical treatment or religious pilgrimage. The data for the EU are aggregated results for the 27 EU countries. Data in the 'Host country language skills' section come from the Labour Force Survey (EU-LFS) module on the labour market situation of migrants and their immediate descendants, held in 2021. The module will be included again in 2029, with the new data expected to be published in 2030. For more information on the data sources used, please consult the online publication EU labour force survey.
Due to the sampling nature of the survey, some data have low reliability or are not published due to very low reliability or confidentiality. Data that are of low reliability are duly marked in the footnotes below the figures and tables.
Main concepts
Educational attainment refers to the highest level of education successfully completed. Educational levels are defined and classified in the international standard classification of education (ISCED). The levels of education used in this article are based on ISCED 2011. A low level of education refers to ISCED levels 0–2 (less than primary, primary and lower secondary education), a medium level refers to ISCED levels 3 and 4 (upper secondary and post-secondary non-tertiary education) and a high level refers to ISCED levels 5–8 (tertiary education).
For the educational attainment of a person’s parents, the classification is based on the highest level attained by either of the parents.
For skills in the host country’s language, multilingual countries (such as Belgium) interpret the host country language as the official language of the region where the respondent lives. Luxembourg considered each of the three official languages (Luxembourgish, German and French) as the "main host country language" and asked separately for each one of those languages.
- For the definition of mother tongue, the aim is to identify the first language learned at home in childhood and still understood by the individual at the time of the survey. In bilingual or multi-lingual homes, a person may have more than one mother tongue.
- The categories of proficient, moderate and basic correspond to the advances, intermediate and beginner levels of the common European framework of references for languages.
- Hardly any or no language skills corresponds to someone who does not speak the language at all or only understands and can use a few words and phrases.
Country notes
Spain and France have assessed the attachment to the job and included in employment those who, in their reference week, had an unknown duration of absence but expected to return to the same job once health measures allow it.
Calculation of shares in totals
Most of the tables and figures in this article present shares of a total. Table 1 shows the distribution of the population by educational attainment while Table 2 shows the distribution of the population by language skill. While most survey respondents provided information on their highest level of education or language skills, a relatively small proportion did not. Those that did not are classified as not stated (non-response) or unknown.
The calculation of shares/distributions is ideally based on a total excluding the number of people classified in the not stated or unknown. This has been done for the shares by education level and by language skill. The distributions for the education levels and language skills therefore each sum to 100.0 %.
Context
The data in this article concerning educational attainment provide information not only on foreign-born people living in the EU but also about native-born people with at least one foreign-born parent. The data concerning host country language skills are focused on foreign-born people.
Successful integration may lead to economic and social benefits for migrants and for the society where they live. More information on the policies and legislation in force in this area can be found in an introductory article on migrant integration statistics.
Direct access to
Online publications
Methodology
- LFS series – Detailed annual survey results (ESMS metadata file – lfsa_esms)
- EU labour force survey