Structure of government debt
Data extracted on 14 June 2024
Planned update: November 2024
Highlights
In the context of the Stability and Growth Pact's Excessive deficit procedure notification process, Eurostat publishes general government government gross debt data twice a year, in April and October, while quarterly general government gross debt data are transmitted in line with Regulation (EU) No 549/2013 (ESA 2010 transmission programme). In order to analyse the debt structure in European countries, Eurostat additionally collects, in an annual survey, data on European Union (EU) countries' general government gross debt by sector of debt holder, by instrument, by original and remaining maturity and by currency of issuance. The survey also collects information on (one-off and standardised) guarantees granted by the general government to non-government units, on the market value of the Maastricht debt instruments and on the apparent cost of government debt. Guarantees are contingent liabilities which are not included in general government gross debt.
This article presents the main results of the latest survey on the structure of general government debt and its relationship to gross domestic product (GDP), fully or partly completed by the 27 EU countries and Norway.
Full article
General government gross (Maastricht) debt as a percentage of GDP
Maastricht debt followed an upward trend after the 2008 financial crisis. From a high point at the end of 2014 (87.2 % of GDP), at EU level, the debt to GDP ratio decreased continuously to reach 77.8 % of GDP at the end of 2019. Then, the ratio increased sharply in 2020 to 90.0 % of GDP, mainly due to the effects of the COVID-19 pandemic. The 2020 increase represents the steepest increase observed in the time series since 1995, and the highest level of general government gross debt as percentage of GDP recorded.
Between the end of 2020 and the end of 2023, the EU general government gross debt decreased by -8.3 percentage points (pp) to 81.7 % of GDP. Compared to the end of 2022, the ratio in 2023 decreased by -1.7 pp of GDP. In the euro area, the general government gross debt decreased from 90.8 % of GDP at the end of 2022 to 88.6 % at the end of 2023 (or by -2.3 pp).
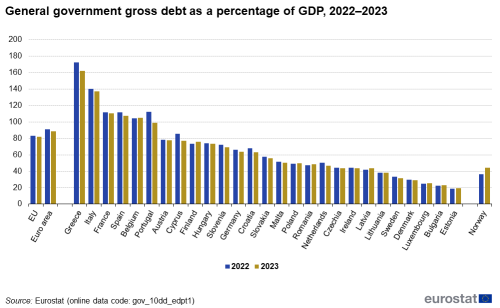
Between the end of 2022 and the end of 2023, 18 EU countries registered a decrease in their debt to GDP ratio, and 9 EU countries and Norway registered an increase. The largest decreases were recorded in Portugal (-13.3 pp), Greece (-10.8 pp), Cyprus (-8.3 pp), Croatia (-4.8 pp) and Spain (-4.0 pp), while increases were recorded in Finland (+2.3 pp), Latvia (+1.8 pp), Romania (+1.3 pp), Estonia (+1.1 pp), Luxembourg and Belgium (both +0.9 pp), Bulgaria (+0.5 pp), Poland (+0.4 pp) and Lithuania (+0.2 pp), as well as Norway (+7.8 pp).
At the end of 2023, 13 out of 27 EU countries reported debt to GDP ratios higher than 60.0 %, while five EU countries recorded debt to GDP ratios of more than 100.0 %: Greece recorded the highest debt to GDP ratio at 161.9 %, followed by Italy (137.3 %), France (110.6 %), Spain (107.7 %) and Belgium (105.2 %).
At the end of 2023, the lowest debt to GDP ratio was registered by Estonia at 19.6 % of GDP, followed by Bulgaria (23.1 %), Luxembourg (25.7 %), Denmark (29.3 %), Sweden (31.2 %), Lithuania (38.3 %) and Norway (44.3 %).
Breakdown by subsector of general government
According to ESA 2010, the general government sector (S.13) is divided into four subsectors:
- Central government (S.1311);
- State government (S.1312);
- Local government (S.1313);
- Social security funds (S.1314).
Figure 2 gives an overview of the subsector breakdown, as a percentage of total debt for all subsectors, i.e. not consolidated between different levels of government.
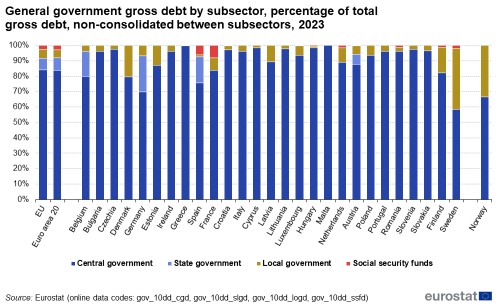
For 25 of the 27 EU countries, the central government represented more than 75 % of the general government debt (not consolidated between subsectors) at the end of 2023, while other subsectors of general government had a comparatively large share in Sweden (41 %) and Germany (30 %), as well as in Norway (33 %).
Local government debt played an important role in Sweden (40 %), Denmark (21 %), Finland (17 %), Estonia (13 %) and Latvia (11 %). The share of local government debt (non-consolidated between subsectors) was also important in Norway (33 %).
In Germany (23 %), Spain (17 %) and Belgium (16 %), state governments accounted for a significant share in the total gross debt (not consolidated between subsectors). State government as a subsector of general government exists only in four EU countries, namely, Belgium, Germany, Spain and Austria. The debt share of state government was 7 % in Austria.
The impact of social security funds on the general government debt continues to be relatively small: contributions of less than 5 % were recorded in 23 countries (out of the 25 reporting countries with a social security funds' subsector). Only two countries had somewhat higher ratios of debt for social security funds: France (8.2 %) and Spain (6.1 %).
Impact of consolidation
The general government debt has to be consolidated within each subsector and between subsectors at the level of general government. This implies that the debt issued by one subsector and held by another one should be excluded from the general government debt. When debt of one subsector of general government is held by another subsector, general government gross debt is then lower than the sum of subsector gross debt. Table 1 illustrates this effect in percentage of total non-consolidated debt (consolidated within subsectors but not between).
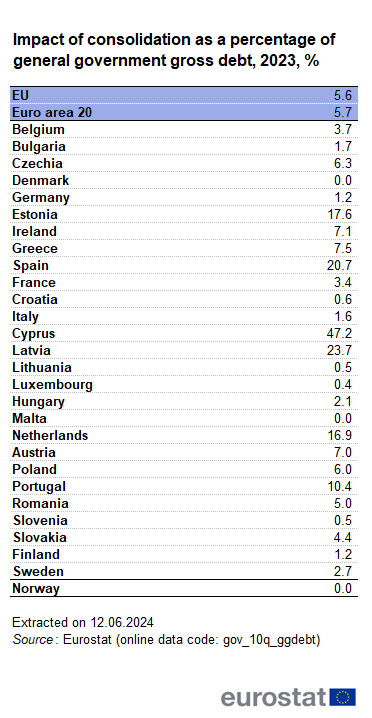
For 16 of the 27 EU countries and Norway, the consolidation between the subsectors of general government had a limited impact, reducing the general government debt by less than 5 %. A significant consolidation effect was observed in Cyprus (47 %), Latvia (24 %), Spain (21 %), Estonia (18 %) and the Netherlands (17 %). Significant consolidation effects are often due to central government liabilities in deposits held by local government and social security funds, for example in Estonia, Latvia and Cyprus. The level of consolidation tends to be influenced by the growing prevalence of cash pooling arrangements.
On the other hand, seven countries showed no consolidating amounts between subsectors of general government or consolidating amounts below 1 %: Denmark, Croatia, Lithuania, Luxembourg, Malta, Slovenia and Norway.
Breakdown by financial instrument
The Maastricht debt is composed of the stock of liabilities in the following financial instruments according to the ESA 2010 classification:
- currency and deposits (AF.2);
- debt securities (AF.3); and
- loans (AF.4).
The breakdown of debt by financial instrument is presented in Figure 3.
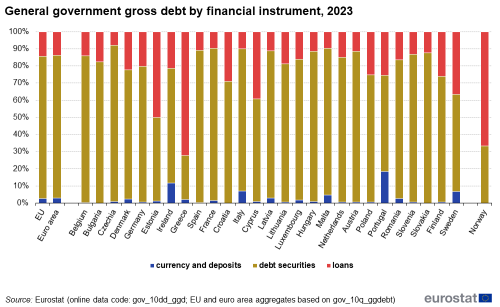
Data for 2023 show that for the EU, debt securities represented 82.9 % of the general government gross debt, loans represented 14.4 %, and currency and deposits represented 2.7 %. For the euro area, debt securities represented 83.4 % of the general government gross debt, loans represented 13.8 %, and currency and deposits represented 2.8 %.
For 25 of the 27 EU countries, the most used debt instrument remained debt securities at the end of 2023. The share of debt securities in general government gross debt ranged from 25.8 % in Greece and 48.9 % in Estonia, to 91.2 % in Czechia.
Greece (72.2 %) and Estonia (49.9 %) as well as Norway (66.6 %) registered high shares of loans. Significant loan to total debt ratios were also recorded for Cyprus (39.2 %), Sweden (36.7 %) and Croatia (29.1 %). The countries reporting a higher share of loans tended to be those either having a relatively low level of general government gross debt (e.g. Estonia), a relatively high share of debt of subcentral sectors of government (e.g. Sweden) or having benefited in recent years from loans of EFSF, ESM, IMF and other international institutional financing (e.g. Greece and Cyprus).
At the end of 2023, currency and deposits represented less than 5 % of total debt for 23 countries. In contrast, currency and deposits accounted for 18.4 % of total general government gross debt in Portugal (due to saving certificates), 11.7 % in Ireland (due to defeasance structures), 7.0 % in Italy and 6.7 % in Sweden (due to saving certificates).
Breakdown by sector of debt holder
Figure 4 presents general government gross debt by sector of the debt holder: non-financial residents (non-financial corporations, households and non-profit institutions serving households), financial residents (financial corporations) and non-residents (rest of the world).
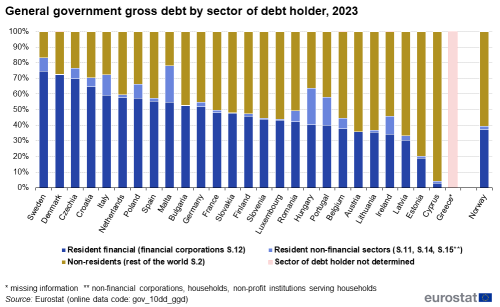
At the end of 2023, among the 26 EU countries for which data was available, government debt was mainly held by the resident financial corporations sector in 12 EU countries. Its share was the highest in Sweden (74.6 %), followed by Denmark (72.3 %), Czechia (69.9 %) and Croatia (64.6 %). At the other end of the scale, the smallest proportion of debt held by resident financial corporations was recorded in Cyprus (2.8 %), ahead of Estonia (18.9 %), Latvia (30.2 %), Ireland (34.1 %), Lithuania (35.4 %), Austria (35.7 %) and Belgium (37.7 %) as well as Norway (37.1 %).
The debt share held by non-residents (rest of the world sector) was significant in 14 EU countries, and Norway, with shares of 42.0 % and higher. Among the countries with the highest share of non-resident sector as debt holder were: Cyprus (95.7 %), Estonia (79.8 %), Latvia (66.6 %), Austria (64.1 %) and Lithuania (63.2 %), as well as Norway (60.6 %). In contrast, this proportion was only 16.9 % in Sweden, 21.8 % in Malta, 23.7 % in Czechia, 27.2 % in Denmark, 27.6 % in Italy and 29.5 % in Croatia.
The resident non-financial sectors (non-financial corporations, households and non-profit institutions serving households) played a major role as debt holder in Malta (23.6 %), Hungary (23.4 %), Portugal (18.0 %), Italy (13.4 %) and Ireland (11.7 %).
Breakdown by original/initial maturity
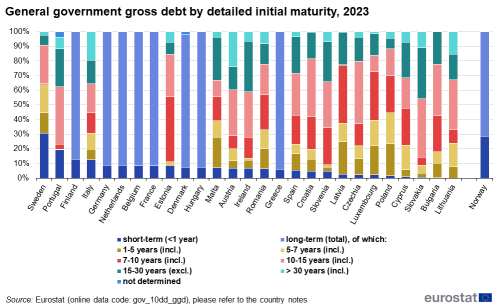
The debt survey aims to provide detailed information on the time structure of government debt based on its original maturity. The maturity is subdivided into several maturity brackets: less than one year, one to five years, five to seven years, seven to ten years, ten to fifteen years, fifteen to thirty years, and more than thirty years, as well as the summary category of more than one year. For some countries, which did not provide the complete breakdown, only two categories are shown: less than one year (short-term) and more than one year (long-term). For the other 19 countries, a detailed debt maturity breakdown is available. The debt structure by initial maturity (share of short-term and long-term debt to total debt) is illustrated in Figure 5.
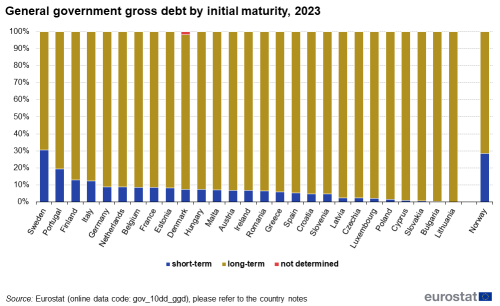
General government gross debt classified by maturity reveals a common pattern: between 69.5 % (in Sweden) and nearly 100 % (in Lithuania) of the outstanding debt was incurred on a long-term basis. Short-term debt levels of less than or equal to 1 % were recorded in Lithuania (0.0 %), Bulgaria (0.3 %), Slovakia (0.6 %) and Cyprus (0.8 %).
The short-term debt ratio was significant in Sweden (30.5 %), followed by Portugal (19.5 %), Finland (13.0 %) and Italy (12.5 %), as well in Norway (28.6 %).
The countries providing a detailed long-term debt breakdown showed very different structures. This is shown in Figure 6.
Breakdown by remaining maturity
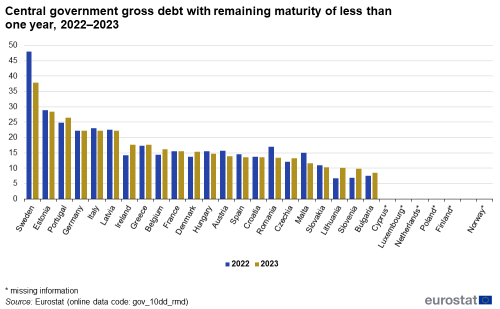
While the initial or original maturity of debt measures the time between issuance date and redemption date, the remaining maturity of debt measures the time left until the redemption date.
Figure 7 shows the share of central government gross debt with a remaining maturity of less than one year, at end 2022 and at end 2023, i.e. the share of the central government debt which was to be redeemed in 2023 and is due to be redeemed during 2024.
Data is available for 22 out of the 28 countries having completed the survey.
At the end of 2023, the highest shares of short-term remaining maturity in total central government debt were reported by Sweden (37.9 %), ahead of Estonia (28.4 %), Portugal (26.4 %), Germany and Italy (both 23.3 %, estimated for Germany), and Latvia (22.1 %), while the lowest shares were observed for Bulgaria (8.5 %) and Slovenia (9.8 %).
The largest reductions in the share of short-term remaining maturity of debt between the end of 2022 and the end of 2023 were observed for Sweden (-10.0 pp), Romania (-3.6 pp) and Malta (-3.4 pp), whereas the largest increases in the shares were noted for Ireland and Lithuania (both +3.4 pp) and Slovenia (+3.0 pp).
Breakdown by currency of denomination
As shown in Figure 8, for the vast majority of the current euro area members, all or almost all (more than 99.5 %) of their central government gross debt at face value was denominated in national currency (€) at end of 2023. (Please see the notes below.)
Similarly, for Denmark, Czechia and Sweden, over 90 % of their central government gross debt was denominated in their national currency.
There were only 2 EU countries where more than 50% of their central government gross debt was denominated in foreign currencies at the end of 2023: Bulgaria (75 %, note that Bulgaria has a currency board arrangement vis a vis the euro) and Romania (51 %). For Hungary (30 %) and Poland (24 %), significant shares of foreign currency debt are noted, too. The major share of all non-euro area EU countries’ foreign currency debt at the end of 2023 was denominated in euro.
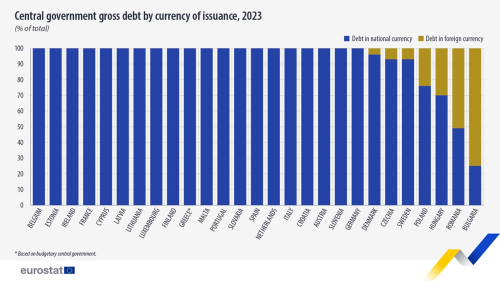
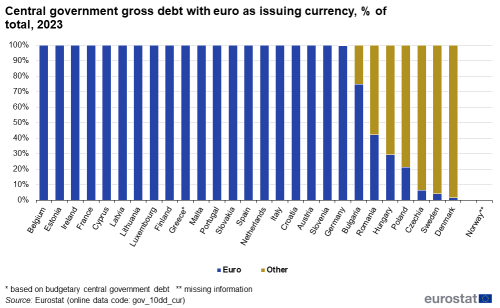
Figure 9 presents the share of outstanding central government debt issued in euro at the end of 2023. The debt denominated in euro is equal to the debt issued in national currency for the 20 EU countries, which were part of the euro area at the end of 2023. All general government debt was denominated in euro or swapped into euro in Belgium, Estonia, Ireland, France, Cyprus, Latvia, Lithuania, Luxembourg and Finland. A share higher than 99 % of total central government gross debt was denominated in euro in Germany, Greece, Spain, Croatia, Italy, Malta, the Netherlands, Austria, Portugal, Slovenia and Slovakia.
In contrast, the major issuing currency in the non-euro countries were their national currencies: Denmark (96.4 % issued in Danish krone), Czechia and Sweden (93.2 % issued in Czech koruna and in Swedish krona respectively), Poland (75.6 % issued in Polish zloty) and Hungary (70.5 % issued in Hungarian forint).
Apparent cost of government debt
The apparent cost of general government debt (i.e. the ratio of accrued interest expenditure as a percentage of the average debt over the year) shows the past and present conditions countries encounter when accessing the financial markets. In general, as long as debt issued is not indexed on inflation measures, this measure of the cost of debt depends on interest rates prevailing at the moment of issuance in the past, and it is normally not very sensitive to the most recent market trends, provided that the composition of debt is mainly long-term.
Based on the replies of 27 EU countries and Norway, the estimates of apparent cost of general government debt are shown in Figure 10.
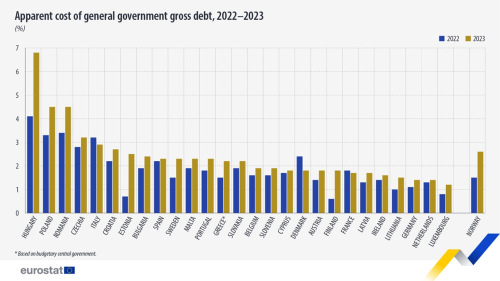
In 2023, the highest apparent cost of general government gross debt was reported by Hungary (6.8%), followed by Poland and Romania (both 4.5%). The lowest apparent cost of general government gross debt was noted for Luxembourg (1.2%), followed by the Netherlands and Germany (both 1.4%).
In all EU countries except Italy, Denmark and France the apparent cost of the government debt increased between 2022 and 2023, mainly due to new issuances carrying a higher interest than debt redeemed. The slow down of inflation measures in some countries in 2023 had an opposing effect.
The largest increases were observed for Hungary (+2.7 pp.), followed by Estonia (+1.8 pp.), Poland (+1.2 pp.) as well as Romania and Finland (both +1.1 pp.). In Denmark (-0.6 pp.), Italy (-0.3 pp.) and France (-0.2 pp.), decrease in the apparent cost are observed.
Government guarantees as a percentage of GDP
The survey collects also data about guarantees granted by general and central government to non-government units. These guarantees (both 'one-off' and 'standardised') are not part of government gross debt, as they are contingent liabilities, being contingent on the actual call of the guarantee.
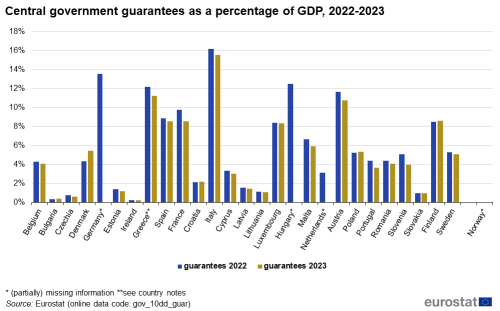
The ratio of government guarantees provided by central government on debt of non-government units as a percentage of GDP, is shown in Figure 11. At the end of 2023, the amount of government guarantees exceeded 10 % of GDP in three countries: Italy (15.5 %), Greece (11.2 %) and Austria (10.7 %), out of 24 countries reporting data for 2023. At the end of 2022 for which data is also available for all EU countries, the ratio of 10 %-to-GDP was exceeded in Italy, Germany, Hungary, Greece and Austria.
At the end of 2023, a ratio to GDP of less than 5 % was recorded in Ireland (0.2 %), Bulgaria (0.4 %), Czechia (0.6 %), Slovakia (1.0 %), Lithuania (1.1 %), Estonia (1.2 %) and Latvia (1.5 %).
Between 2022 and 2023, ratio of the stock of guarantees granted by central governments as a percentage of GDP decreased in 18 of the 24 countries for which data is available. The largest decreases were reported by France (-1.2 pp), Slovenia (-1.1 pp), Greece (-1.0 pp) and Austria (-0.9 pp), Malta (-0.8 pp) and Portugal (-0.7 pp) and Italy (-0.6 pp), while data for Denmark shows the largest increase (1.1 pp).
Data sources
Market vs. face value
The market value is the price as determined dynamically by buyers and sellers in an open market.
In Council Regulation (EC) No 479/2009, as amended, the face value is used. This is equal to the undiscounted amount of the principal that the government will have to pay to creditors at maturity.
General government
Debt statistics cover data for general government as well as its subsectors: central government (S.1311), when applicable state government (S.1312), local government (S.1313) and when applicable social security funds (S.1314).
Instruments
Maastricht debt comprises the stock of liabilities in the following financial instruments:
- AF.2: 'currency and deposits' consist of currency in circulation and all types of deposits in national and in foreign currency.
- AF.3: 'debt securities' consist of negotiable financial instruments that are bearer instruments and are usually traded on secondary markets or can be offset on the market, and do not grant the holder any ownership rights in the institutional unit issuing them.
- AF.4: 'loans' consist of financial instruments created when creditors lend funds to debtors, either directly or through brokers, which are either evidenced by non-negotiable documents or not evidenced by documents.
Consolidation
Debt figures on general government statistics and each of its subsectors are reported consolidated.
Consolidation is a method of presenting statistics for a grouping of units, such as institutional sectors or subsectors, as if it constituted a single unit. Consolidation thus involves a special kind of cancelling out of flows and stocks: eliminating those transactions or debtor/ creditor relationships that occur between two transactors belonging to the same grouping. Usually the sum of subsectors should exceed the value of the general government sector. Subsector data should be consolidated within each subsector, but not between them. ESA 2010 recommends compiling both consolidated and non-consolidated financial accounts. For macro-financial analysis, the focus is on consolidated figures. The Maastricht debt is also consolidated.
The Eurostat 2024 government debt structure survey
The survey launched by Eurostat on government debt structure contains a set of five tables to be completed with general government gross debt data and its subsectors' debt (central government, state government, local government, social security funds) for 2023 and the three preceding years, detailing gross debt by financial instrument, sector of debt holder and original maturity, and a table with additional classifications of government debt (by remaining maturity, currency of issuance, apparent cost of debt, market value of gross debt and guarantees (contingent liabilities)).
Notes
For the EU and euro area (20 countries) aggregates, data from ESA table 28 (quarterly government debt) and EDP notification supplied in April 2024 is used to complement the analysis. For all countries, the data reported in the structure of government debt survey corresponds to the general government gross debt totals submitted in the context of the April 2024 Excessive Deficit Procedure notification.
For all 27 EU countries and Norway, the data used in this article was reported in the structure of government debt survey. The survey is not fully completed by all countries. Hence the number of countries shown for each breakdown of gross debt as well as guarantees varies.
The analysis on breakdown by currency, apparent cost of the debt and guarantees is based on central government data.
For EU countries, the GDP supplied to Eurostat in the context of the April 2024 EDP notification is used in the graphs and analysis. For Norway, the most recent GDP transmitted in the ESA national accounts transmission programme is used.
Breakdown by denomination in national and foreign currency: Denominated in national currency means issued in national currency as well as issued in foreign currency and hedged (using financial derivatives) to national currency. The reporting may not yet be fully harmonised between reporting countries. Countries are encouraged to report hedged foreign currency amounts to national currency using financial derivatives under domestic currency. A small number of countries may report the stock of foreign currency debt at nominal value, implying a small distortion in the shares of domestic and foreign currency.
The coverage of guarantees may still vary across countries and have an expanding coverage over time. Guarantees consist of on-off and standardised guarantees. Standardised guarantees reported within total guarantee amounts are guarantees that are usually issued in large numbers and for fairly small amounts, with similar features, for example mortgage loan guarantees, student loan guarantees etc. An estimate for expected loss can be made for standardised guarantees - this is expensed when the standardised guarantees are granted. The reporting by counterpart institutional sector is not yet fully harmonised between reporting countries for standardised guarantees.
Country notes
Some breakdowns of gross debt by (detailed) original maturity and by sector of debt holder may not sum to the total debt instrument / gross debt, in case detailed information was not available for some items.
Denmark: The coverage of data relating to the remaining maturity of central government gross debt is limited to debt securities and deposits. The negative stocks in AF.32 held by S1313 are due to a repurchase agreement (repo) of a governmental body, where the unit receive government bonds as part of the repo and sell those government bonds on the secondary market.
Germany: Only asset guarantees provided to publicly controlled monetary financial institutions are included under guarantees given by government units on non-government borrowing to financial corporations (S.12) sector, see also https://www.destatis.de/EN/Themes/Government/Public-Finance/EU-Directive-Budgetary-Frameworks/Tables/guarantees.html. Remaining maturity breakdowns are estimated.
Greece: The coverage of data relating to the remaining maturity of debt, currency of issuance, apparent cost of debt excludes extra-budgetary units of central government. Thus the coverage of central government data for these indicators is limited to S.1311.1, the budgetary central government. For guarantees: the amounts for scheme of standardised guarantees are included (taking into consideration COVID-19 related measures).
Cyprus: The information on holders of debt securities reflects place of issuance.
Portugal: Information on the detailed split of long-term loans by original maturity is partially available. For this reason, total long-term loans exceed the detailed breakdown. Information on the detailed split of long-term loans by initial maturity for local government is not available. For this reason, total long-term debt exceed the detailed breakdown.
Context
Monitoring and keeping government debt sustainable is a crucial part of maintaining budgetary discipline which is essential as Europe undergoes demographic changes and the related economic, budgetary and social challenges.
General government gross debt (Maastricht debt)
The Protocol on the excessive deficit procedure (EDP) annexed to the Maastricht Treaty specifies that the ratio of gross government debt to GDP must not exceed 60 % at the end of the preceding fiscal year. The application to statistical data is made operational by Council Regulation (EC) No 479/2009, as amended.
ESA 2010
Fiscal data are compiled in accordance with national accounts rules, as laid down in the European System of Accounts (ESA 2010) adopted in the form of a Regulation (EU) No 549/2013 of the European Parliament and of the Council of 21 May 2013. The compilation of general government debt data is consistent with the ESA 2010 rules concerning the sector classification of institutional units, the consolidation rules, the classification of financial transactions and of financial assets and liabilities and the time of recording. The valuation is however different. Debt liabilities in ESA 2010 are valued at market value, whereas Maastricht debt is valued at nominal (face) value as required by Council Regulation (EC) No 479/2009, as amended. Most data in the publication on the structure of government debt refer to general government gross debt (and various breakdowns) expressed at face value.
Direct access to
- Annual government finance statistics (t_gov_10a)
- Government deficit and debt (t_gov_10dd)
- Quarterly government finance statistics (t_gov_10q)
- Government statistics (gov)<noprint>, see:
- Annual government finance statistics (gov_10a)
- Government deficit and debt (gov_10dd)
- Structure of government debt (gov_10dd_sgd)
- Quarterly government finance statistics (gov_10q)
- Structure of government debt (ESMS metadata file — gov_10dd_sgd_esms)
- Government deficit and debt (ESMS metadata file — gov_10dd_esms)
- Quarterly financial accounts for general government (ESMS metadata file — gov_10q_ggfa_esms)
- Quarterly government debt (ESMS metadata file — gov_10q_ggdebt_esms)