- Data from October 2010, most recent data: Further Eurostat information, Main tables and Database.
Creating, exploiting and commercialising new technologies has become essential in the global race for competitiveness. High-technology or 'high-tech' sectors are key drivers of economic growth, productivity and social protection, and are generally a source of high value added and well-paid employment. Technology-intensive enterprises are often referred to as 'high-technology' – or 'high-tech' – companies.
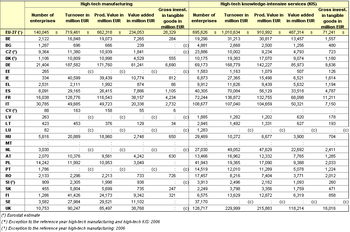
But what exactly is high-tech? Eurostat collects all available high-tech statistics for the European Union under the more formal name 'Statistics on high-tech industry and knowledge-intensive services' and defines high-tech according to three approaches: the sector approach, the product approach and the patent approach. The sector approach looks at: the high-tech manufacturing sector, medium high-tech manufacturing sector, and high-tech knowledge-intensive service sector, focusing on employment, earnings and economic indicators as shown in Table 1. The product approach looks simply at whether a product is a high-tech product or not and examines trade in high-tech products. The patent approach looks at whether a patent is a high-tech patent or not and also defines what biotechnology patents are.
Main statistical findings
Economic statistics on high-tech sectors
In 2007, the European Union had almost 140 000 enterprises in high-tech manufacturing and five times as many in high-tech knowledge-intensive services (695 000) (Table 1). High-tech manufacturers were most numerous in Italy, Germany, France and Poland, accounting together for around 60 % of the high-tech sector in the EU. The United Kingdom counted the most enterprises in the high-tech KIS sector (128 717), comprising almost one-fifth of the EU total, followed by Italy, France and Germany.
A different picture emerges when considering turnover; Germany led the way in 2007, with a total turnover of EUR 188 billion in high-tech manufacturing, ahead of France (EUR 129 billion). The United Kingdom ranked third (EUR 90 billion). Although Italy had more high-tech manufacturers, its high-tech manufacturing sector was smaller then in the other leading European countries when measured by turnover and other indicators (value added, production value, etc.). One of the main reasons for this is the size class of enterprises and a prevailing share of SME.
Turning to the high-tech KIS sector, in 2007, the European Union had 696 thousands of enterprises in high-tech knowledge-intensive services, 34 % of which were registered in the United Kingdom and Italy with 130 000 and 109 000 respectively. However, it is striking that turnover, production value and value added figures were practically twice as high in the United Kingdom as in Italy. Germany was well ahead in terms of value added generated by high-tech manufacturing, with almost EUR 61 billion, followed by France and United Kingdom, both with 38 billion.
Trade in high-tech products
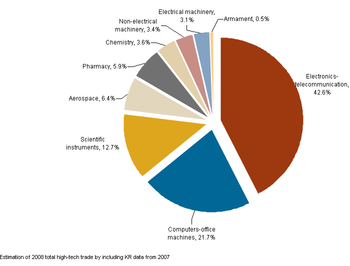
Trade in high-tech products means import and export of products identified as being of high-technology. The list of such products was compiled based on the R&D intensity (R&D expenditure/total sales). Products with high R&D intensity are classified as high-tech and are regrouped in 9 groups. At the global level, the export value of high-tech products represented around 14% of all exports value in 2008. The two groups of products ‘Electronics – telecommunication’ and ‘Computer – office machines’ both added up to 64% of high-tech exports worldwide (Figure 1). Taken together ‘Scientific instruments’, ‘Aerospace’ and Pharmacy accounted for a one fourth of global high-tech exports. By contrast, ‘Chemistry, ‘Non-electrical machinery’, ‘Electrical machinery’ and ‘Armament’ summed up to 10% of total high-tech exports.
In 2008, the three leaders at world level in terms of exports of high-tech products were China (21.5 %), the EU (16.7 %) and the United States (14.1%). Hong-Kong ranked at the fourth position with a share of 8.1 % by overlapping Japan (7.2%) which remained until 2007 the fourth biggest exporter of high-tech goods. Two other countries: Singapore and South Korea recorded as well the significant shares of 7.0% and 6.3% respectively. The high performance of Hong-Kong and Singapore being relatively small Asian countries was driven by the important number of transiting high-tech products. Those two countries owe their ranks to the hub effect and re-exports of goods. ‘Other Asian countries’, Mexico, Malaysia and Switzerland registered the shares in exports of high-tech products ranging from 3.4% to 2.4%. Close behind came Thailand, Canada and Philippines with shares between 1.8% and 1.4%. The remaining main EU partners, Israel, India, Norway, Russian Federation, Indonesia, Brazil and Australia each recorded global export shares in high-tech products below 1%.
In 2008, the 21 largest exporting countries (entities) accounted for 99 % of global exports in high-tech products.
Employment in high-tech
In 2009, 35 million people were employed in the manufacturing sector in the EU-27, representing 16.1% of the total employment (see Table 2). Out of 35 million workers, 2.4 million were employed in high-tech manufacturing what equals to 1.1% of total employment. High-tech KIS sector in 2009 was as double as high-tech manufacturing and accounted for 2.6% of total employment. The shares of both manufacturing and services high-technology sectors varied considerably from country to another. High-tech manufacturing shares ranged from 0.3% in Turkey and Cyprus, 0.4% in Greece, 0.5% in Spain to 3% in Ireland, 2.8% in Switzerland and 2.5% in Hungary. The disparities in terms of the proportion of high-tech KIS in total employment were as well observed across countries. The biggest shares of more than 4% recorded Finland, Sweden, Iceland and Former Yugoslav Republic of Macedonia and the lowest below 1.7% were found in Turkey, Romania, Portugal, Lithuania and Greece.
While the manufacturing employment decreased from 2008 by 7.4%, the high-tech manufacturing recorded a little bit slower fall of 6.0% at EU level. This decrease in employment can be explained partly by the economical crisis reaching its apogee in 2009 in numerous European countries. The impact of crisis was as well observed in the Services sector recording a very slight growth of 0.1% from 2008 to 2009. Services used to generate new jobs at the pace of 2% annually until 2008. The mark of the economical crisis can be seen as well in high-technology services (KIS): EU-27 recorded the loss of 0.1% of jobs in 2009 compared to 2008.
The important differences existed comparing the employment change among countries with big growths in one hand, and equally big decreases in other hand. 19 out of 33 observed countries registered the fall in employment in high-tech manufacturing with the biggest fall by 38% in Spain, then by 37% in Cyprus and Croatia and by 21% in Norway. The biggest growth performed high-tech manufacturing sector in Latvia (15%), Germany (8%) and Estonia (5%). In high-tech KIS the loss was more moderate. 12 countries registered the decrease. The biggest decrease was the case in Latvia and United Kingdom (-16%) and Malta (-10%). The best performing countries in terms of growth of employment in high-tech KIS were: Norway (15%), Spain (14%), Slovenia (12%), Belgium and Czech Republic (10%).
Table 2 compares as well the percentages of women of both high-tech sectors with respective total of manufacturing or total of services.
In the EU-27, women accounted for 30.0% of employment in manufacturing and this share reached 37.7% in high-tech manufacturing. However, even if shares of women were higher in high-tech manufacturing than in manufacturing in almost all the countries excepting Bulgaria and former Yugoslav Republic of Macedonia, the gender balance was in favor to women (above 50% of employed) only in four countries: Latvia, Portugal, Slovakia and Czech Republic.
High-tech KIS sector compared to high-tech manufacturing showed lower shares of women in all the countries excepting Finland and Turkey. Moreover, in high-tech KIS none of the countries reached the gender balance. For high-tech KIS the lowest share were found in Former Yugoslav Republic of Macedonia (10%), the Netherlands (24%) and Turkey (27%) and the highest in Estonia (43%), Bulgaria (43%), Lithuania (41%) and Finland (37%). The reasons behind lower female participation in high-tech KIS lay in the specificities of sectors included in that aggregate: Computer programming, Scientific research and development, Telecommunication and corresponding occupations which apparently remain more popular among men.
High-tech employment at regional level
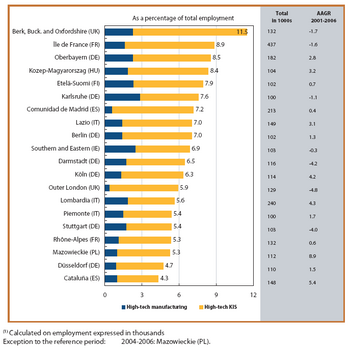
Figure 2 presents the top 20 regions (at NUTS level 2) in terms of employment in high-tech sectors in 2006, as a share of total employment and the annual average growth rate from 2001 to 2006. In 2006, the leading region was Berkshire, Buckinghamshire and Oxfordshire (UK - see list of country abbreviations), with high-tech sectors accounting for 11.5 % of total employment. This was followed by Île de France (FR), with 8.9 % and Oberbayern (DE), with 8.5 %.
Out of the 20 leading regions, seven were found in Germany, three in Italy, two each in France, the UK and Spain, and one in Ireland, Finland, Hungary and Poland, the two latter countries being the only representatives from the New Member States.
In terms of annual average growth rate, employment in high-tech sectors as a share of total employment increased in 13 of the 20 leading regions. Mazowieckie (PL) showed the highest growth rate (8.9 %), followed by Cataluña (ES), with an increase of 5.4 % on average per year. In contrast, over the same period the share of employment in high-tech sectors fell in Outer London (UK), Darmstadt (DE) and Stuttgart (DE) by an annual average of 4.8 %, 4.2 %, and 4.0 % respectively. Employment in high-tech sectors also decreased in Berkshire, Buckinghamshire and Oxfordshire (UK), Île de France (FR), Karlsruhe (DE) and Southern and Eastern (IE). Most of the population employed on high-tech was devoted to high-tech knowledge-intensive services (high-tech KIS). Karlsruhe, in Germany, and Southern and Eastern, in Ireland, show the highest percentages of employment in high-tech manufacturing, while Outer London (UK) and Comunidad de Madrid (ES) can be found at the lower end of the top 20 regions.
Considering the difference between the shares of people employed in high-tech manufacturing and the share of people employed in high-tech KIS, the largest discrepancies were found in Berkshire, Buckinghamshire and Oxfordshire (UK), Île de France (FR), Comunidad de Madrid (ES) and Outer London (UK).
Data sources and availability
High-tech statistics uses various other domains and sources mainly within Eurostat's official statistics (CIS, COMEXT, HRST, LFS, SBS, SES, PAT and R&D). Its coverage and availability is therefore dependent on these other primary sources.
The sectoral approach is an aggregation of manufacturing industries according to technological intensity (R & D expenditure/value added) and based on the Statistical Classification of Economic Activities in the European Community (NACE) at 2- or 3-digit level for compiling aggregates related to high-technology, medium high-technology, medium low-technology and low-technology. Services are mainly aggregated into knowledge-intensive services (KIS) and less knowledge-intensive services (LKIS) and defined according to a similar logic at NACE 2-digit level.
Note that due to the revision of NACE from NACE Rev. 1.1 to NACE Rev. 2 the definition of high-technology industries and knowledge-intensive services has changed. For high-tech statistics this means that two different definitions (one according NACE Rev. 1.1 and one according NACE Rev. 2) will be used in paralell as long as necessary. The data in this article is as defined by NACE Rev. 1.1.
The product approach was devised to complement the sectoral approach. The product list is based on the calculations of R&D intensity by groups of products (R & D expenditure/total sales). The groups classified as high-technology products are aggregated on the basis of the Standard international trade classification. The product approach is used for data on high-tech trade.
Due to the revision of SITC from SITC Rev. 3 to SITC Rev. 4 the definition of high-tech products has also changed. High-tech statistics will start publishing statistics based on SITC Rev. 4 sometime in 2009. The data in this article is as defined by SITC Rev. 3.
High-tech patents and biotechnology patents are defined according to the patent approach. The groups are aggregated on the basis of the International patent classification - 8th edition. Biotechnology patents are also aggregated on the basis of the IPC - 8th edition.
For more detailed information of the various high-tech definitions see:
- High-tech aggregation by NACE Rev. 1.1
- High-tech aggregation by NACE Rev. 2
- High-tech aggregation by SITC Rev. 3
- High-tech aggregation by SITC Rev. 4
- High-tech aggregations by patents
Context
EP/Council Decision 1608/2003 concerning the production and development of Community statistics on science and technology and Commission Regulation 753/2004 addressing statistics on science and technology determine the production and development of statistics on high-tech (in particular with regard to activities, products, contribution to the whole economy, etc.).
Further Eurostat information
Publications
- Science, technology and innovation in Europe - Statistical book 2008
- Science, technology and innovation in Europe - Pocketbook 2008
- China passes the EU in High-tech exports - Statistics in focus 25/2009
- Who are the people employed in high-tech and in which regions do they work? - Statistics in focus 51/2008
- High-tech knowledge-intensive services - Statistics in focus 18/2008
- Trade in high-tech products - Statistics in focus 7/2008
- Biotechnology in Europe - Patents and R&D investments - Statistics in focus 100/2007
- Regional employment in high-tech sectors - Statistics in focus 102/2007
Main tables
- Science and technology, see:
- High-tech industry and knowledge-intensive services (t_htec)
Database
- Science and technology, see:
- High-tech industry and knowledge-intensive services (htec)
- High-tech industries and knowledge-intensive services: economic statistics at national level (htec_eco)
- High-tech industries and knowledge-intensive services: employment statistics at national and regional level (htec_emp)
- High-tech industries and knowledge-intensive services: science and technology statistics at national and regional level (htec_sti)
Dedicated section
Methodology / Metadata
- High-tech industry and knowledge-intensive services (ESMS metadata file - htec_esms)
Other information
- Decision (EC) 1608/2003 (Legal text)
- Regulation (EC) 753/2004 (Legal text)
External Links
- DG Enterprise: European innovation scoreboard
- OECD:Statistical analysis of science, technology and industry


