Data extracted in March 2024
Planned article update: May 2025
Highlights
This article presents an overview of statistics for the European Union’s (EU) accommodation and food services sector, as covered by NACE Rev. 2. These activities make up a significant part of tourism supply, although they also serve local clients and business customers. This article belongs to a set of statistical articles on 'Business economy by sector'.
Structural profile
In 2021, the accommodation and food services sector has still not fully recovered from the COVID-19 pandemic, which forced governments to take strict measures, such as closing the borders or temporary shutting down some of the business sectors, many of those in the accommodation and food services sector. In 2021, the sector’s value added of €203.6 billion in the EU increased by 39.1 % compared to 2020 (€146.4 billion), yet still remained almost 20 % under the pre-pandemic level (€252.4 billion in 2019). In 2021, the number of persons employed was still 10% lower compared to the pre-pandemic levels of 2019, amounting to approximately 9.9 million persons. This figure includes a significant portion engaged in part-time roles, alongside a considerable presence of self-employed individuals and unpaid family workers. However, there was a positive increase of 6 % from the previous year, 2020, where employment stood at 9.4 million persons. The accommodation and food services sector’s contribution to the business economy’s (Sections B to N and P to R, as well as Divisions S95 and S96) employment was much higher (6.3 % of the total) than its contribution to value added (2.2 %). Around 1.90 million enterprises operated in the EU’s accommodation and food services sector with a share of 6.1 % of the total number of enterprises in the business economy, reflecting the small average size of the enterprises. The total number of enterprises slightly increased compared to both years 2020 (1.84 million enterprises) and 2019 (1.89 million enterprises).

In 2021, the EU’s accommodation and food services sector recorded an apparent labour productivity of €20 600 per person employed, an increase of 31.0 % compared to the figures recorded in 2020. This can partly be explained by an unusually low value added in this sector in the Covid-19-year 2020, together with an attempt by enterprises (in some cases supported by government subsidies) to keep staff in employment. Despite this positive trend, the sector still maintained the lowest apparent labor productivity among all NACE sections within the business economy.
Similarly, the average employee benefits expense (average personnel costs) in this sector amounted to €17,000 per employee, reflecting the lowest values observed across all sectors included in the business economy. However, it's important to note that both of these indicators are pulled downwards by the traditionally high incidence of part-time employment in the accommodation and food services sector. The wage-adjusted labour productivity ratio is not directly affected by part-time employment as it shows the ratio between value added and total employee benefits expense without relating this to the number of persons producing the output or receiving wages and salaries. The combination of low productivity and employee benefits expense in the EU’s accommodation and food services sector led to a wage-adjusted labour productivity ratio of 120.9 % in 2021, which was considerably below the average (154.4 %) of the business economy. By contrast, the gross operating rate which shows the share of turnover that remains after paying for purchased goods and services and employee benefits expense (in other words, the gross operating surplus) was 14.3 % for the EU’s accommodation and food services sector in 2021, slightly above the business economy average of 13.2 %.
Sectoral analysis
According to most structural business indicators, the food and beverages subsector (Division 56) is larger than the accommodation subsector (Division 55). The food and beverages subsector accounted for 80.1 % of all enterprises in the EU’s accommodation and food services sector in 2021, 78.0 % of the persons employed and 68.9 % of the sectoral value added.

(% share of sectoral total) - Source: Eurostat (sbs_ovw_act)
In 2021, around 80 % of the enterprises and the workforce of the accommodation and food services sector was registered in the subsector of food and beverages, which includes traditional restaurants, fast-food or take-away restaurant, cafeterias, mobile food trucks, catering services, as well as bars, coffee shops and mobile beverage vendors. 1.5 million enterprises were active in this sector in 2021, and employed 7.7 million persons, contributing to the EU's business economy with a value added of €140.2 billion. The subsector of accommodation, which includes among others hotels, youth hostels, mountain refuges, camping grounds, recreational vehicle parks and trailer parks, as well as student residences and railway sleeping cars, employed 2.2 million persons and generated €63.4 billion in value added— see Table 2a.


The very low apparent labour productivity figure for the EU’s accommodation and food services sector in 2021 was pulled downwards by both subsectors: the food and beverages subsector, where an average of €18 200 of value was added per person employed, and the accommodation subsector with €29 100 . In both subsectors there was a significant increase compared to 2020 (see above). In the case of the food and beverages subsector the value increased by almost quarter, while for the accommodation subsector, which was even more affected by the COVID-19 pandemic in 2020, the apparent labour productivity increased in 2021 by 52 %. Among all NACE divisions within the business economy, the food and beverages subsector had in 2021 the lowest apparent labour productivity ratio and the lowest average employee benefits expense (€15 700 per person). As already noted, many activities in the accommodation and food services sector have a high incidence of part-time employment and wage-adjusted labour productivity is an indicator that is less influenced by this characteristic. The accommodation subsector recorded a wage-adjusted labour productivity ratio of 134.2 %, while the food and beverages subsector recorded a ratio of 116.1 %, both being far lower than the business economy average (154.4 %).
Country overview
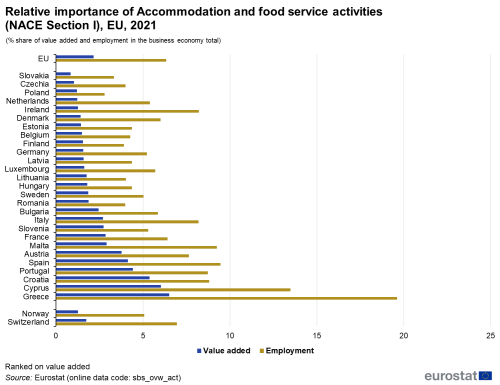
In Greece, 19.6 % of the business economy employment was active in accommodation and food services in 2021, while this sector accounted for 6.5 % of business economy value added in Greece— see Figure 2. The next highest employment share was in Cyprus, with 13.5 % and a value added share of 6.0 % of the business economy. Spain, Malta, Portugal and Croatia had as well a high share in employment in the accommodation and food services.

(% share of value added and employment in the business economy total) - Source: Eurostat (sbs_ovw_act)
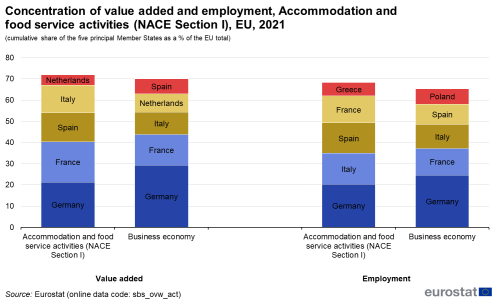
In absolute terms, Germany recorded the highest level of value added within the accommodation and food services sector in 2021 (€ 43.4 billion), which was equivalent to 21.3 % of the EU total. France, Spain, and Italy emerged also as significant contributors to the European Union's value added in the accommodation and food services sector, with France accounting for 19.0 %, Spain for 13.6 %, and Italy for 13.1 %. The Netherlands contributed 4.9 % to the EU's overall value added in this sector. Together, these five Member States accounted for a substantial portion, comprising 71.8 % of the EU's total value added in the accommodation and food services sector for the year 2021. In employment terms, this high concentration of activity within the largest EU Member States was similarly visible, as 68.3 % of the accommodation and food services sector’s workforce were employed in top five Member States. As seen in Figure 3, Italy and Spain employed a higher number of persons than France, while Germany was the highest employer among the EU Member States.

(cumulative share of the five principal Member States as a % of the EU total) - Source: Eurostat (sbs_ovw_act)

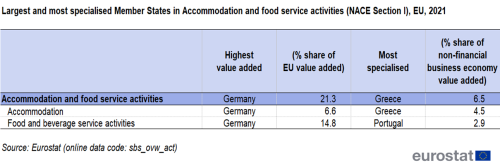
In value added terms, Germany was the largest EU Member States in both subsectors in 2021 (see Table 3), the highest share being in food and beverages subsector (14.8 % of the EU value added). Within the same subsector, Portugal recorder the highest degree of specialization, while for the subsector of accommodation, Greece emerged as the most specialized country. A further analysis shows that Romania had the highest wage-adjusted labour productivity ratio among the EU Member States in the accommodation and food sector in 2021, at 161.3 %, followed by Cyprus (156.1 %) and Belgium (155.5 %). On the other hand, Czechia (62.0 %), Slovakia (72.4 %) and Denmark (85.0) were the EU Member States with the lowest wage-adjusted labour productivity in the accommodation and food sector.


Data sources
Coverage
The provision of accommodation services (Division 55) covers hotels and other provision of short-stay accommodation; activities related to the provision of long-term primary residences are excluded and are covered by real estate activities (Section L). The food and beverage services subsector (Division 56) provides complete meals or drinks fit for immediate consumption, regardless of the type of facility supplying the service; sit-down and take-away restaurants are included, as well as bars, canteens and catering services. Note that these activities do not cover the provision of food or drinks that are sold through independent distribution channels, in other words through wholesale or retail trade activities (Section G).
It is important to bear in mind (in keeping with all structural business statistics) that only enterprises for which the provision of accommodation, food or beverages is the principal activity are covered by the statistics presented in this article. Enterprises offering food and drink as a complement to their core business are not included and in some cases meals and beverages may represent a significant secondary activity — for example, the sale of food and beverages in stadiums, cinemas or recreation parks (if these are not operated by separate enterprises).
Data sources
The analysis presented in this article is based on the main dataset for structural business statistics (SBS), size class data and regional data, all of which are published annually.
The main series provides information for each EU Member State as well as a number of non-member countries at a detailed level according to the activity classification NACE. Data are available for a wide range of variables.
In structural business statistics, size classes are generally defined by the number of persons employed. A limited set of the standard structural business statistics variables (for example, the number of enterprises, turnover, persons employed and value added) are analyzed by size class, mostly down to the three-digit (group) level of NACE. The main size classes used in this article for presenting the results are:
- small and medium-sized enterprises (SMEs): with 1 to 249 persons employed, further divided into:
- micro enterprises: with less than 10 persons employed;
- small enterprises: with 10 to 49 persons employed;
- medium-sized enterprises: with 50 to 249 persons employed;
- large enterprises: with 250 or more persons employed.
Structural business statistics also include regional data. Regional SBS data are available at NUTS levels 1 and 2 for the EU Member States, Iceland and Norway, mostly down to the two-digit (division) level of NACE. The main variable analyzed in this article is the number of persons employed. The type of statistical unit used for regional SBS data is normally the local unit, which is an enterprise or part of an enterprise situated in a geographically identified place. Local units are classified into sectors (by NACE) normally according to their own main activity, but in some EU Member States the activity code is assigned on the basis of the main activity of the enterprise to which the local unit belongs. The main SBS data series are presented at national level only, and for this national data the statistical unit is the enterprise. It is possible for the principal activity of a local unit to differ from that of the enterprise to which it belongs. Hence, national SBS data from the main series are not necessarily directly comparable with national aggregates compiled from regional SBS.
Context
Tourism plays an important role in Europe and makes a considerable contribution to employment and regional development, as well as a range of other EU objectives, such as sustainable development or the enhancement of natural and cultural heritage.
One of the main characteristics of tourism-related activities is their high income elasticity of demand, which increases or reduces more easily than for many other products or services. As such, spending on tourism generally decreases proportionally faster than consumers’ income during times of economic slowdown. Moreover, political or economic uncertainties (for example, when exchange rates change rapidly) tend to lead to a diversion of tourism demand, resulting in shifts between outbound tourism and domestic tourism. Furthermore, a downturn in economic fortunes is also likely to result in reduced business activity; this in turn may be reflected in fewer business trips and nights spent in hotels, as well as less corporate entertainment.
In June 2010, the European Commission adopted a Communication titled Europe, the world’s No 1 tourist destination — a new political framework for tourism in Europe. This Communication addresses issues such as: the impact of the changing global economy on tourism, as well as various challenges to be faced by the providers of tourism services, such as seasonality of demand or an ageing population. The Communication outlines policies to stimulate competitiveness: to support diversification of tourism supply, develop innovation, improve professional skills, encourage an extension of the tourism season, and consolidate the socio-economic knowledge base for tourism. Further policies concern the promotion of the development of sustainable, responsible and high-quality tourism, the consolidation of the image and profile of Europe as a collection of sustainable and high-quality tourist destinations, and the maximization of the potential of EU financial policies and instruments for developing tourism.
EDEN is an acronym for European Destinations of Excellence, a project run by the European Commission to promote sustainable tourism development models. The project is based on national competitions that take place every year which result in the selection of tourist destinations of excellence in each participating country. The European Commission has been running EDEN since 2006.
Explore further
Other articles
Thematic section
Publications
- Recent Eurostat publications on SBS
- Key figures on Europe – 2023 edition – see subchapter on Business
- Eurostat's Regional Yearbook – see chapter 8. Business
- News Release SBS – 2021 final data
- Structural business statistics – SBS metadata file
