Living conditions - quarterly statistics
Data extracted in May 2024
No update planned
Highlights
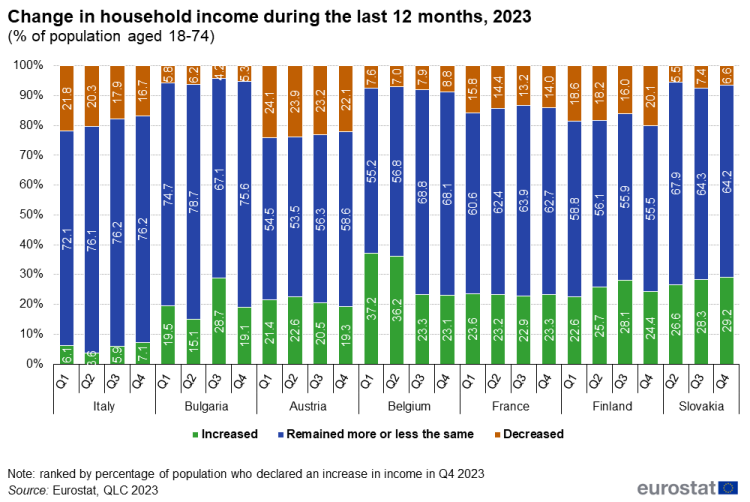
(% of population aged 18-74 years)
Source: Eurostat, Quarterly data collection on living conditions 2023
This article is the last in a series of Statistics Explained articles that are based on the quarterly data collection on living conditions (QLC). This quarterly data collection has been developed to provide more information about living conditions of people during the COVID-19 outbreak and the recovery period. This article presents the results for all quarters of 2023 for seven EU Member States (Belgium, Bulgaria, France, Italy, Austria, Slovakia and Finland).
Full article
More employed people reported an increase in income rather than a decrease
In the fourth quarter (Q4) of 2023, at least 15 % of the employed population in all participating countries experienced an increase in household income, except in Italy where the share was 9.5 %. Throughout 2023, in Austria, Belgium, Bulgaria, Finland, France, and Slovakia the share of the employed population reporting an increase in income was higher than those reporting a decrease. Italy was the only country where the opposite was observed for all quarters of 2023.
In Belgium, Bulgaria, Finland, France, and Slovakia, the share of employed people with an increase in household income was at least twice as high as those experiencing a decrease throughout 2023. In Austria, the shares were identical, while in Italy, the share of employed people with a decrease in income was significantly higher than those with an increase.
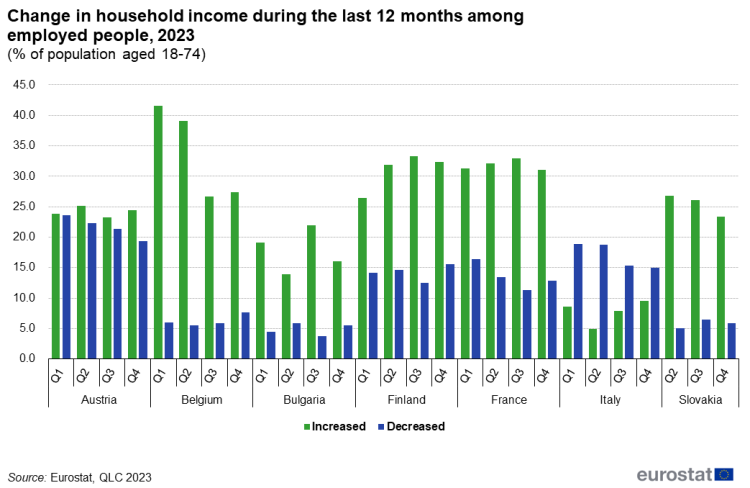
(% of population aged 18-74 years)
Source: Eurostat, Quarterly data collection on living conditions 2023
One in every seven unemployed persons saw a decrease in household income
Income fluctuations among the unemployed population were also dynamic. In Q4 2023, at least one in every three unemployed individuals in Austria, Finland, France, and Italy experienced a decrease in household income. The lowest percentages were observed in Belgium (22.9 %) and Bulgaria (13.7 %). During the same period, the part of the unemployed population reporting an increase in income ranged from 3.2 % in Austria to 11.9 % in Belgium.
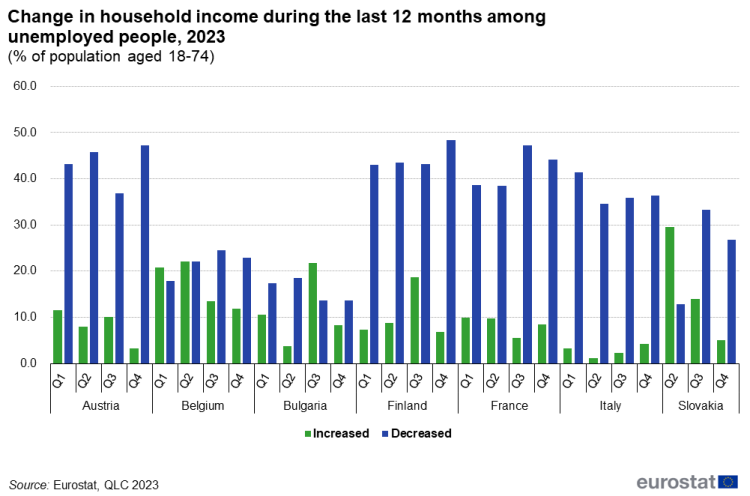
(% of population aged 18-74 years)
Source: Eurostat, Quarterly data collection on living conditions 2023
Highly educated people were able to make ends meet more easily
Another indicator which allows analyzing the financial situation of households is the 'ability to make ends meet' indicator which shows whether a household has enough financial resources to make ends meet, which subjectively describes the overall financial situation of the household (income, wealth, expenditure and purchasing power changes due to inflation). The indicator has six categories “with great difficulty”, “with difficulty”, “with some difficulty”, “fairly easily”, “easily” and “very easily” which describe the magnitude of the observed occurrence.
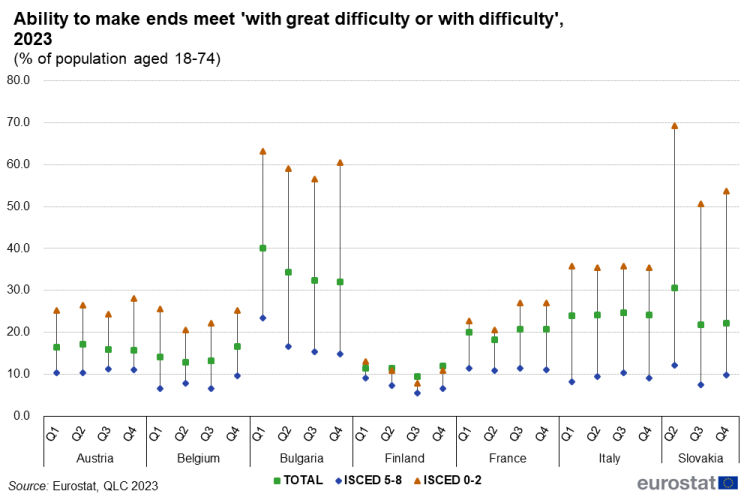
(% of population aged 18-74 years)
Source: Eurostat, Quarterly data collection on living conditions 2023
In Q4 2023, the share of population able to make ends meet with great difficulty or with difficulty ranged from 11.9 % in Finland to 32.0 % in Bulgaria. When broken down by education level, there was a significant difference between those with high (ISCED 5-8) and low (ISCED 0-2) educational attainment. The share of the population reporting great difficulty or difficulty in ability to make ends meet was at least twice as high for those with low education levels compared with those with high education levels. The only exception was Finland, where the differences were less pronounced. In Bulgaria and Slovakia, the differences between these two groups exceeded 40 percentage points (pp).
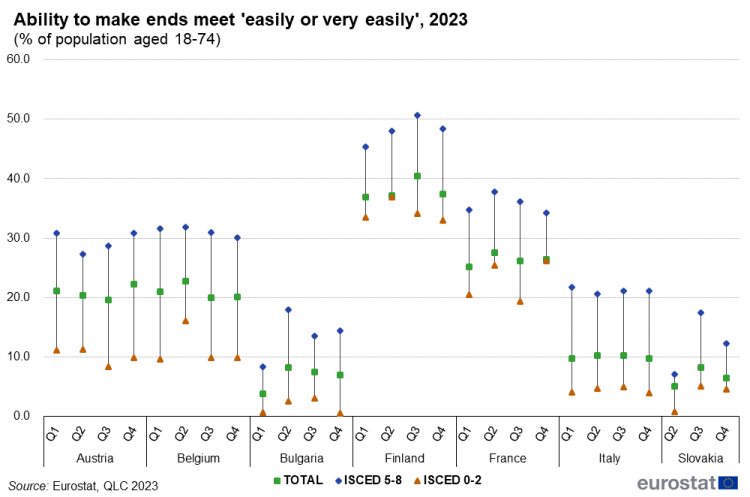
(% of population aged 18-74 years)
Source: Eurostat, Quarterly data collection on living conditions 2023
On the other hand, in Q4 2023, the share of population with ability to make ends meet easily or very easily ranged from 6.4 % in Slovakia and 7.0 % in Bulgaria to 26.4 % in France and 37.4 % in Finland. Differences based on educational attainment levels were also evident. In Austria, Belgium, Finland, and France, nearly one in three individuals with a high educational attainment level (ISCED 5-8) could make ends meet easily or very easily. This share was much lower in Bulgaria, Italy, and Slovakia. Among those with low educational attainment levels (ISCED 0-2), the percentage of population able to make ends meet easily or very easily was limited to 10 % in most countries, with exceptions in France (26.1 %) and Finland (33.0 %). It is evident that having a high educational attainment level can significantly improve ability to make ends meet of the population.
Main methodological notes
The COVID-19 pandemic highlighted the need for timely short-term data on social inclusion and living conditions. On this basis, Eurostat and the EU Member States developed a new flexible approach for a quarterly data collection on living conditions. This approach is based on a modular design and can be implemented in any existing (host survey) or new quarterly national data collection.
The data collection includes two types of information: core variables of interest and background socio-economic variables. The core variables include information about the evolution of the household income, quality of life and financial difficulties. These variables provide information about quarterly living conditions of the population. The background socio-economic variables contain information about the age, sex, education attainment level, activity status, household composition and other characteristics of the population. Data are collected using a variety of methods: paper-assisted personal interview (PAPI), computer-assisted personal interview (CAPI), computer-assisted telephone interview (CATI), computer-assisted web interview (CAWI) or with other appropriate methods. The core variables of interest are collected directly from the respondents (use of administrative sources is not allowed). By contrast, administrative data can be used for the background socio-economic variables.
The statistical population pertains to private households and all persons composing the household in the territory of the particular country. Persons living in collective households and in institutions are generally excluded from the population.
More information could be found in the dedicated article Quarterly data collection on living conditions-methodology.
Used classifications:
International Standard Classification of Education (ISCED)
Source data for tables and graphs
Data sources
The data in this article are based on new quarterly data collection of living conditions. A total of seven EU Member States (Belgium, Bulgaria, France, Italy, Austria, Slovakia, Finland) joined in the second stage of data collection covering the four quarters of 2023.
Context
The main objective of the temporary quarterly data collection on living conditions was to provide timely information on living conditions of households and household members. This information should fulfil the need of quarterly data on the particular field. The initiative was launched in the middle of 2021 and it was planned to deliver important data for monitoring the recovery after the COVID-19 crisis. The initiative stopped at the end of 2023.
Direct access to
Other articles
Main tables
Dedicated section
Legislation
Regulation (EU) 2019/1700 of the European Parliament and of the Council of 10 October 2019 establishing a common framework for European statistics relating to persons and households, based on data at individual level collected from samples (IESS regulation)